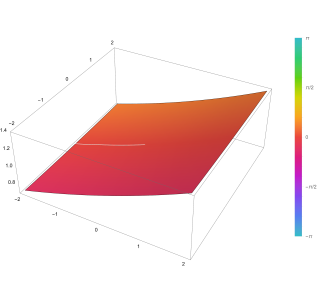
The likelihood function is the joint probability of observed data viewed as a function of the parameters of a statistical model.
In physics, a phonon is a collective excitation in a periodic, elastic arrangement of atoms or molecules in condensed matter, specifically in solids and some liquids. A type of quasiparticle, a phonon is an excited state in the quantum mechanical quantization of the modes of vibrations for elastic structures of interacting particles. Phonons can be thought of as quantized sound waves, similar to photons as quantized light waves. However, photons are fundamental particles that can be individually detected, whereas phonons, being quasiparticles, are an emergent phenomenon.

In probability theory and statistics, the chi-squared distribution with degrees of freedom is the distribution of a sum of the squares of independent standard normal random variables. The chi-squared distribution is a special case of the gamma distribution and is one of the most widely used probability distributions in inferential statistics, notably in hypothesis testing and in construction of confidence intervals. This distribution is sometimes called the central chi-squared distribution, a special case of the more general noncentral chi-squared distribution.

In probability theory and statistics, the gamma distribution is a two-parameter family of continuous probability distributions. The exponential distribution, Erlang distribution, and chi-squared distribution are special cases of the gamma distribution. There are two equivalent parameterizations in common use:
- With a shape parameter k and a scale parameter θ
- With a shape parameter and an inverse scale parameter , called a rate parameter.
In mathematics, a generalized hypergeometric series is a power series in which the ratio of successive coefficients indexed by n is a rational function of n. The series, if convergent, defines a generalized hypergeometric function, which may then be defined over a wider domain of the argument by analytic continuation. The generalized hypergeometric series is sometimes just called the hypergeometric series, though this term also sometimes just refers to the Gaussian hypergeometric series. Generalized hypergeometric functions include the (Gaussian) hypergeometric function and the confluent hypergeometric function as special cases, which in turn have many particular special functions as special cases, such as elementary functions, Bessel functions, and the classical orthogonal polynomials.

In mathematics, the upper and lower incomplete gamma functions are types of special functions which arise as solutions to various mathematical problems such as certain integrals.

In probability and statistics, the Dirichlet distribution (after Peter Gustav Lejeune Dirichlet), often denoted , is a family of continuous multivariate probability distributions parameterized by a vector of positive reals. It is a multivariate generalization of the beta distribution, hence its alternative name of multivariate beta distribution (MBD). Dirichlet distributions are commonly used as prior distributions in Bayesian statistics, and in fact, the Dirichlet distribution is the conjugate prior of the categorical distribution and multinomial distribution.

The Kruskal–Wallis test by ranks, Kruskal–Wallis test, or one-way ANOVA on ranks is a non-parametric method for testing whether samples originate from the same distribution. It is used for comparing two or more independent samples of equal or different sample sizes. It extends the Mann–Whitney U test, which is used for comparing only two groups. The parametric equivalent of the Kruskal–Wallis test is the one-way analysis of variance (ANOVA).
The Friedman test is a non-parametric statistical test developed by Milton Friedman. Similar to the parametric repeated measures ANOVA, it is used to detect differences in treatments across multiple test attempts. The procedure involves ranking each row together, then considering the values of ranks by columns. Applicable to complete block designs, it is thus a special case of the Durbin test.
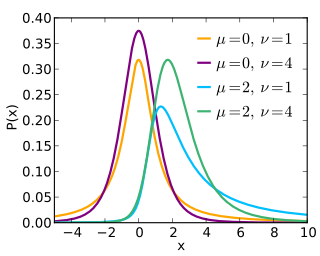
The noncentral t-distribution generalizes Student's t-distribution using a noncentrality parameter. Whereas the central probability distribution describes how a test statistic t is distributed when the difference tested is null, the noncentral distribution describes how t is distributed when the null is false. This leads to its use in statistics, especially calculating statistical power. The noncentral t-distribution is also known as the singly noncentral t-distribution, and in addition to its primary use in statistical inference, is also used in robust modeling for data.
In statistics, the false discovery rate (FDR) is a method of conceptualizing the rate of type I errors in null hypothesis testing when conducting multiple comparisons. FDR-controlling procedures are designed to control the FDR, which is the expected proportion of "discoveries" that are false. Equivalently, the FDR is the expected ratio of the number of false positive classifications to the total number of positive classifications. The total number of rejections of the null include both the number of false positives (FP) and true positives (TP). Simply put, FDR = FP /. FDR-controlling procedures provide less stringent control of Type I errors compared to family-wise error rate (FWER) controlling procedures, which control the probability of at least one Type I error. Thus, FDR-controlling procedures have greater power, at the cost of increased numbers of Type I errors.
In natural language processing, latent Dirichlet allocation (LDA) is a Bayesian network for modeling automatically extracted topics in textual corpora. The LDA is an example of a Bayesian topic model. In this, observations are collected into documents, and each word's presence is attributable to one of the document's topics. Each document will contain a small number of topics.
In statistics, the Durbin–Watson statistic is a test statistic used to detect the presence of autocorrelation at lag 1 in the residuals from a regression analysis. It is named after James Durbin and Geoffrey Watson. The small sample distribution of this ratio was derived by John von Neumann. Durbin and Watson applied this statistic to the residuals from least squares regressions, and developed bounds tests for the null hypothesis that the errors are serially uncorrelated against the alternative that they follow a first order autoregressive process. Note that the distribution of this test statistic does not depend on the estimated regression coefficients and the variance of the errors.
Kendall's W is a non-parametric statistic for rank correlation. It is a normalization of the statistic of the Friedman test, and can be used for assessing agreement among raters and in particular inter-rater reliability. Kendall's W ranges from 0 to 1.
An index of qualitative variation (IQV) is a measure of statistical dispersion in nominal distributions. There are a variety of these, but they have been relatively little-studied in the statistics literature. The simplest is the variation ratio, while more complex indices include the information entropy.
Tukey's range test, also known as Tukey's test, Tukey method, Tukey's honest significance test, or Tukey's HSDtest, is a single-step multiple comparison procedure and statistical test. It can be used to find means that are significantly different from each other.
Named after the Dutch mathematician Bartel Leendert van der Waerden, the Van der Waerden test is a statistical test that k population distribution functions are equal. The Van der Waerden test converts the ranks from a standard Kruskal-Wallis test to quantiles of the standard normal distribution. These are called normal scores and the test is computed from these normal scores.
In statistics, in the analysis of two-way randomized block designs where the response variable can take only two possible outcomes, Cochran's Q test is a non-parametric statistical test to verify whether k treatments have identical effects. It is named after William Gemmell Cochran. Cochran's Q test should not be confused with Cochran's C test, which is a variance outlier test. Put in simple technical terms, Cochran's Q test requires that there only be a binary response and that there be more than 2 groups of the same size. The test assesses whether the proportion of successes is the same between groups. Often it is used to assess if different observers of the same phenomenon have consistent results.
Least-squares support-vector machines (LS-SVM) for statistics and in statistical modeling, are least-squares versions of support-vector machines (SVM), which are a set of related supervised learning methods that analyze data and recognize patterns, and which are used for classification and regression analysis. In this version one finds the solution by solving a set of linear equations instead of a convex quadratic programming (QP) problem for classical SVMs. Least-squares SVM classifiers were proposed by Johan Suykens and Joos Vandewalle. LS-SVMs are a class of kernel-based learning methods.
In statistics, the Jonckheere trend test is a test for an ordered alternative hypothesis within an independent samples (between-participants) design. It is similar to the Kruskal-Wallis test in that the null hypothesis is that several independent samples are from the same population. However, with the Kruskal–Wallis test there is no a priori ordering of the populations from which the samples are drawn. When there is an a priori ordering, the Jonckheere test has more statistical power than the Kruskal–Wallis test. The test was developed by Aimable Robert Jonckheere, who was a psychologist and statistician at University College London.


