Results maps
 1995 results map
 1999 results map
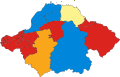 2003 results map
 2007 results map
 2012 results map
 2017 results map
 2022 results map
East Lothian Council in Scotland holds elections every five years, previously holding them every four years from its creation as a single-tier authority in 1995 to 2007.
| Year | Labour | SNP | Conservative | Independent |
|---|---|---|---|---|
| 1974 | 10 | 0 | 6 | 1 |
| 1977 | 9 | 0 | 8 | 0 |
| 1980 | 10 | 0 | 7 | 0 |
| 1984 [a] | 12 | 0 | 5 | 0 |
| 1988 | 12 | 0 | 4 | 1 [b] |
| 1992 | 9 | 1 | 7 | 0 |
| Year | Labour | SNP | Conservative | Green | Liberal Democrats | Independent |
|---|---|---|---|---|---|---|
| 1995 | 15 | 0 | 3 | 0 | 0 | 0 |
| 1999 [a] | 17 | 1 | 5 | 0 | 0 | 0 |
| 2003 | 17 | 1 | 4 | 0 | 1 | 0 |
| 2007 [b] | 7 | 7 | 2 | 0 | 6 | 1 |
| 2012 | 10 | 9 | 3 | 0 | 0 | 1 |
| 2017 [c] | 9 | 6 | 7 | 0 | 0 | 0 |
| 2022 | 9 | 7 | 4 | 1 | 0 | 1 |


| Party | Candidate | FPv% | Count | |||||
|---|---|---|---|---|---|---|---|---|
| 1 | 2 | 3 | 4 | 5 | ||||
| Conservative | Craig Hoy | 35.0 | 2,212 | 2,249 | 2,428 | 2,759 | 3,277 | |
| SNP | Lorraine Glass | 29.5 | 1,866 | 1,874 | 2,044 | 2,469 | ||
| Labour | Neal Black | 21.5 | 1,359 | 1,370 | 1,589 | |||
| Liberal Democrats | Stuart Crawford | 12.3 | 774 | 782 | ||||
| UKIP | David Sisson | 1.7 | 108 | |||||
| Conservative hold | ||||||||
| Valid: 6,319 Spoilt: 44 Quota: 3,160 Turnout: 6,363 | ||||||||
| Party | Candidate | FPv% | Count | |||||
|---|---|---|---|---|---|---|---|---|
| 1 | 2 | 3 | 4 | 5 | ||||
| Labour | Colin Yorkston | 38.5 | 1,793 | 1,815 | 1,861 | 1,927 | 2,390 | |
| SNP | Janis Wilson | 26.2 | 1,217 | 1,242 | 1,258 | 1,391 | 1,458 | |
| Conservative | Andy Ovens | 24.8 | 1,154 | 1,173 | 1,204 | 1,212 | ||
| Scottish Green | Tim Porteus | 5.p | 231 | 241 | 266 | |||
| Liberal Democrats | Ben Morse | 2.9 | 136 | 154 | ||||
| Independent | Calum Miller | 2.6 | 122 | |||||
| Labour hold | ||||||||
| Valid: 4,696 Spoilt: 43 Quota: 2,327 Turnout: 4,739 | ||||||||