Econometrics is the application of statistical methods to economic data in order to give empirical content to economic relationships. More precisely, it is "the quantitative analysis of actual economic phenomena based on the concurrent development of theory and observation, related by appropriate methods of inference". An introductory economics textbook describes econometrics as allowing economists "to sift through mountains of data to extract simple relationships". Jan Tinbergen is one of the two founding fathers of econometrics. The other, Ragnar Frisch, also coined the term in the sense in which it is used today.

Statistics is the discipline that concerns the collection, organization, analysis, interpretation, and presentation of data. In applying statistics to a scientific, industrial, or social problem, it is conventional to begin with a statistical population or a statistical model to be studied. Populations can be diverse groups of people or objects such as "all people living in a country" or "every atom composing a crystal". Statistics deals with every aspect of data, including the planning of data collection in terms of the design of surveys and experiments.
An ecological fallacy is a formal fallacy in the interpretation of statistical data that occurs when inferences about the nature of individuals are deduced from inferences about the group to which those individuals belong. 'Ecological fallacy' is a term that is sometimes used to describe the fallacy of division, which is not a statistical fallacy. The four common statistical ecological fallacies are: confusion between ecological correlations and individual correlations, confusion between group average and total average, Simpson's paradox, and confusion between higher average and higher likelihood.

In statistical modeling, regression analysis is a set of statistical processes for estimating the relationships between a dependent variable and one or more independent variables. The most common form of regression analysis is linear regression, in which one finds the line that most closely fits the data according to a specific mathematical criterion. For example, the method of ordinary least squares computes the unique line that minimizes the sum of squared differences between the true data and that line. For specific mathematical reasons, this allows the researcher to estimate the conditional expectation of the dependent variable when the independent variables take on a given set of values. Less common forms of regression use slightly different procedures to estimate alternative location parameters or estimate the conditional expectation across a broader collection of non-linear models.
Cointegration is a statistical property of a collection (X1, X2, ..., Xk) of time series variables. First, all of the series must be integrated of order d. Next, if a linear combination of this collection is integrated of order less than d, then the collection is said to be co-integrated. Formally, if (X,Y,Z) are each integrated of order d, and there exist coefficients a,b,c such that aX + bY + cZ is integrated of order less than d, then X, Y, and Z are cointegrated. Cointegration has become an important property in contemporary time series analysis. Time series often have trends—either deterministic or stochastic. In an influential paper, Charles Nelson and Charles Plosser (1982) provided statistical evidence that many US macroeconomic time series have stochastic trends.

Regression dilution, also known as regression attenuation, is the biasing of the linear regression slope towards zero, caused by errors in the independent variable.
In robust statistics, robust regression is a form of regression analysis designed to overcome some limitations of traditional parametric and non-parametric methods. Regression analysis seeks to find the relationship between one or more independent variables and a dependent variable. Certain widely used methods of regression, such as ordinary least squares, have favourable properties if their underlying assumptions are true, but can give misleading results if those assumptions are not true; thus ordinary least squares is said to be not robust to violations of its assumptions. Robust regression methods are designed to be not overly affected by violations of assumptions by the underlying data-generating process.

Spatial analysis or spatial statistics includes any of the formal techniques which studies entities using their topological, geometric, or geographic properties. Spatial analysis includes a variety of techniques, many still in their early development, using different analytic approaches and applied in fields as diverse as astronomy, with its studies of the placement of galaxies in the cosmos, to chip fabrication engineering, with its use of "place and route" algorithms to build complex wiring structures. In a more restricted sense, spatial analysis is the technique applied to structures at the human scale, most notably in the analysis of geographic data or transcriptomics data.

The modifiable areal unit problem (MAUP) is a source of statistical bias that can significantly impact the results of statistical hypothesis tests. MAUP affects results when point-based measures of spatial phenomena are aggregated into districts, for example, population density or illness rates. The resulting summary values are influenced by both the shape and scale of the aggregation unit.
In statistics, resampling is any of a variety of methods for doing one of the following:
- Estimating the precision of sample statistics by using subsets of available data (jackknifing) or drawing randomly with replacement from a set of data points (bootstrapping)
- Permutation tests are exact tests: Exchanging labels on data points when performing significance tests
- Validating models by using random subsets
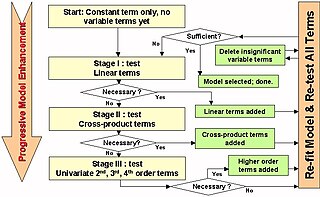
In statistics, stepwise regression is a method of fitting regression models in which the choice of predictive variables is carried out by an automatic procedure. In each step, a variable is considered for addition to or subtraction from the set of explanatory variables based on some prespecified criterion. Usually, this takes the form of a forward, backward, or combined sequence of F-tests or t-tests.
Bootstrapping is any test or metric that uses random sampling with replacement, and falls under the broader class of resampling methods. Bootstrapping assigns measures of accuracy to sample estimates. This technique allows estimation of the sampling distribution of almost any statistic using random sampling methods.
In statistics, Mallows's Cp, named for Colin Lingwood Mallows, is used to assess the fit of a regression model that has been estimated using ordinary least squares. It is applied in the context of model selection, where a number of predictor variables are available for predicting some outcome, and the goal is to find the best model involving a subset of these predictors. A small value of Cp means that the model is relatively precise.
In statistics, model specification is part of the process of building a statistical model: specification consists of selecting an appropriate functional form for the model and choosing which variables to include. For example, given personal income together with years of schooling and on-the-job experience , we might specify a functional relationship as follows:
In statistics, multivariate adaptive regression splines (MARS) is a form of regression analysis introduced by Jerome H. Friedman in 1991. It is a non-parametric regression technique and can be seen as an extension of linear models that automatically models nonlinearities and interactions between variables.
In statistical theory, the field of high-dimensional statistics studies data whose dimension is larger than typically considered in classical multivariate analysis. The area arose owing to the emergence of many modern data sets in which the dimension of the data vectors may be comparable to, or even larger than, the sample size, so that justification for the use of traditional techniques, often based on asymptotic arguments with the dimension held fixed as the sample size increased, was lacking.
Linear least squares (LLS) is the least squares approximation of linear functions to data. It is a set of formulations for solving statistical problems involved in linear regression, including variants for ordinary (unweighted), weighted, and generalized (correlated) residuals. Numerical methods for linear least squares include inverting the matrix of the normal equations and orthogonal decomposition methods.
In statistics, linear regression is a linear approach for modelling the relationship between a scalar response and one or more explanatory variables. The case of one explanatory variable is called simple linear regression; for more than one, the process is called multiple linear regression. This term is distinct from multivariate linear regression, where multiple correlated dependent variables are predicted, rather than a single scalar variable.
Multilevel regression with poststratification (MRP) is a statistical technique used for correcting model estimates for known differences between a sample population, and a target population. For example, Wang et al. used survey data from Xbox gamers to predict U.S. presidential election results. The Xbox gamers were 65% 18- to 29-year-olds and 93% male, while the electorate as a whole was 19% 18- to 29-year-olds and 47% male.

In statistics, a sequence of random variables is homoscedastic if all its random variables have the same finite variance. This is also known as homogeneity of variance. The complementary notion is called heteroscedasticity. The spellings homoskedasticity and heteroskedasticity are also frequently used.