This is a list of election results for the electoral district of Glenelg in South Australian elections.
Member | Party | Term | |
---|---|---|---|
William Fisk | Independent | 1938–1940 | |
Frank Smith | Liberal and Country | 1941–1947 | |
Baden Pattinson | Liberal and Country | 1947–1965 | |
Hugh Hudson | Labor | 1965–1970 | |
John Mathwin | Liberal and Country | 1970–1974 | |
Liberal | 1974–1985 | ||
Party | Candidate | Votes | % | ±% | |
---|---|---|---|---|---|
Liberal | John Mathwin | 9,110 | 59.9 | −2.8 | |
Labor | Robert Dancer | 5,387 | 35.4 | +6.7 | |
Democrats | Ronald Moulds | 720 | 4.7 | −3.9 | |
Total formal votes | 15,217 | 95.9 | −0.9 | ||
Informal votes | 646 | 4.1 | +0.9 | ||
Turnout | 15,863 | 93.1 | +1.1 | ||
Two-party-preferred result | |||||
Liberal | John Mathwin | 9,490 | 62.4 | −4.8 | |
Labor | Robert Dancer | 5,727 | 37.6 | +4.8 | |
Liberal hold | Swing | -4.8 | |||
Party | Candidate | Votes | % | ±% | |
---|---|---|---|---|---|
Liberal | John Mathwin | 9,527 | 62.7 | +3.2 | |
Labor | Maurice Hearn | 4,369 | 28.7 | −11.8 | |
Democrats | Diana Harte | 1,302 | 8.6 | +8.6 | |
Total formal votes | 15,198 | 96.8 | −0.9 | ||
Informal votes | 499 | 3.2 | +0.9 | ||
Turnout | 15,697 | 92.0 | −0.8 | ||
Two-party-preferred result | |||||
Liberal | John Mathwin | 10,218 | 67.2 | +7.7 | |
Labor | Maurice Hearn | 4,980 | 32.8 | −7.7 | |
Liberal hold | Swing | +7.7 | |||
Party | Candidate | Votes | % | ±% | |
---|---|---|---|---|---|
Liberal | John Mathwin | 9,421 | 59.5 | +23.9 | |
Labor | Barbara Wiese | 6,423 | 40.5 | −0.4 | |
Total formal votes | 15,844 | 97.7 | |||
Informal votes | 374 | 2.3 | |||
Turnout | 16,218 | 92.8 | |||
Liberal hold | Swing | +4.2 | |||
Party | Candidate | Votes | % | ±% | |
---|---|---|---|---|---|
Labor | Brian Crawford | 6,706 | 39.8 | −7.5 | |
Liberal | John Mathwin | 6,429 | 38.1 | −14.6 | |
Liberal Movement | Peter Heysen | 3,728 | 22.1 | +22.1 | |
Total formal votes | 16,863 | 97.2 | −0.6 | ||
Informal votes | 490 | 2.8 | +0.6 | ||
Turnout | 17,353 | 93.0 | −1.3 | ||
Two-party-preferred result | |||||
Liberal | John Mathwin | 9,766 | 57.9 | +5.2 | |
Labor | Brian Crawford | 7,096 | 42.1 | −5.2 | |
Liberal hold | Swing | +5.2 | |||
Party | Candidate | Votes | % | ±% | |
---|---|---|---|---|---|
Liberal and Country | John Mathwin | 8,465 | 52.7 | −1.0 | |
Labor | Brian Crawford | 7,604 | 47.3 | +4.3 | |
Total formal votes | 16,069 | 97.8 | −0.9 | ||
Informal votes | 359 | 2.2 | +0.9 | ||
Turnout | 16,428 | 94.3 | −1.3 | ||
Liberal and Country hold | Swing | -3.8 | |||
Party | Candidate | Votes | % | ±% | |
---|---|---|---|---|---|
Liberal and Country | John Mathwin | 8,329 | 53.7 | ||
Labor | Alan Sexton | 6,670 | 43.0 | ||
Democratic Labor | Mark Posa | 504 | 3.3 | ||
Total formal votes | 15,503 | 98.7 | |||
Informal votes | 197 | 1.3 | |||
Turnout | 15,700 | 95.6 | |||
Two-party-preferred result | |||||
Liberal and Country | John Mathwin | 8,767 | 56.5 | ||
Labor | Alan Sexton | 6,746 | 43.5 | ||
Liberal and Country hold | Swing | ||||
Party | Candidate | Votes | % | ±% | |
---|---|---|---|---|---|
Labor | Hugh Hudson | 18,711 | 53.3 | +1.8 | |
Liberal and Country | John McCoy | 15,165 | 43.2 | −1.4 | |
Democratic Labor | Mark Posa | 1,203 | 3.4 | −0.5 | |
Total formal votes | 35,079 | 98.5 | −0.1 | ||
Informal votes | 536 | 1.5 | +0.1 | ||
Turnout | 35,615 | 95.2 | +0.2 | ||
Two-party-preferred result | |||||
Labor | Hugh Hudson | 18,891 | 53.9 | +1.8 | |
Liberal and Country | John McCoy | 16,188 | 46.1 | −1.8 | |
Labor hold | Swing | +1.8 | |||
Party | Candidate | Votes | % | ±% | |
---|---|---|---|---|---|
Labor | Hugh Hudson | 16,869 | 51.5 | +7.4 | |
Liberal and Country | Baden Pattinson | 14,613 | 44.6 | −5.3 | |
Democratic Labor | Mark Posa | 1,267 | 3.9 | −2.1 | |
Total formal votes | 32,749 | 98.6 | +0.1 | ||
Informal votes | 457 | 1.4 | −0.1 | ||
Turnout | 33,206 | 95.0 | +0.8 | ||
Two-party-preferred result | |||||
Labor | Hugh Hudson | 17,059 | 52.1 | +5.4 | |
Liberal and Country | Baden Pattinson | 15,690 | 47.9 | −5.4 | |
Labor gain from Liberal and Country | Swing | +5.4 | |||
Party | Candidate | Votes | % | ±% | |
---|---|---|---|---|---|
Liberal and Country | Baden Pattinson | 15,109 | 49.9 | −5.8 | |
Labor | Ian Charles | 13,346 | 44.1 | +7.7 | |
Democratic Labor | Nathaniel Bishop | 1,809 | 6.0 | −1.9 | |
Total formal votes | 30,264 | 98.5 | +0.5 | ||
Informal votes | 445 | 1.5 | −0.5 | ||
Turnout | 30,709 | 94.2 | +0.3 | ||
Two-party-preferred result | |||||
Liberal and Country | Baden Pattinson | 16,128 | 53.3 | −9.1 | |
Labor | Ian Charles | 14,136 | 46.7 | +9.1 | |
Liberal and Country hold | Swing | -9.1 | |||
Party | Candidate | Votes | % | ±% | |
---|---|---|---|---|---|
Liberal and Country | Baden Pattinson | 14,735 | 55.7 | +2.1 | |
Labor | Richard Clifford | 9,641 | 36.4 | −4.9 | |
Democratic Labor | Nathaniel Bishop | 2,082 | 7.9 | +2.8 | |
Total formal votes | 26,458 | 98.0 | −0.5 | ||
Informal votes | 528 | 2.0 | +0.5 | ||
Turnout | 26,986 | 93.9 | −0.5 | ||
Two-party-preferred result | |||||
Liberal and Country | Baden Pattinson | 62.4 | +4.4 | ||
Labor | Richard Clifford | 37.6 | −4.4 | ||
Liberal and Country hold | Swing | +4.4 | |||
Party | Candidate | Votes | % | ±% | |
---|---|---|---|---|---|
Liberal and Country | Baden Pattinson | 11,650 | 53.6 | ||
Labor | Loftus Fenwick | 8,959 | 41.3 | ||
Labor (A-C) | Peter Lasarewitch | 1,100 | 5.1 | ||
Total formal votes | 21,719 | 98.5 | |||
Informal votes | 325 | 1.5 | |||
Turnout | 22,044 | 94.4 | |||
Two-party-preferred result | |||||
Liberal and Country | Baden Pattinson | 58.0 | |||
Labor | Loftus Fenwick | 42.0 | |||
Liberal and Country hold | Swing | ||||
Party | Candidate | Votes | % | ±% | |
---|---|---|---|---|---|
Liberal and Country | Baden Pattinson | 12,927 | 50.7 | −11.6 | |
Labor | Loftus Fenwick | 12,562 | 49.3 | +11.6 | |
Total formal votes | 25,489 | 97.5 | +0.2 | ||
Informal votes | 617 | 2.5 | −0.2 | ||
Turnout | 26,128 | 95.6 | +1.7 | ||
Liberal and Country hold | Swing | -11.6 | |||
Party | Candidate | Votes | % | ±% | |
---|---|---|---|---|---|
Liberal and Country | Baden Pattinson | 13,673 | 62.3 | +1.7 | |
Labor | John Sexton | 8,272 | 37.7 | +2.3 | |
Total formal votes | 21,945 | 97.3 | +0.2 | ||
Informal votes | 617 | 2.7 | −0.2 | ||
Turnout | 22,562 | 93.9 | 0.0 | ||
Liberal and Country hold | Swing | N/A | |||
Party | Candidate | Votes | % | ±% | |
---|---|---|---|---|---|
Liberal and Country | Baden Pattinson | 11,696 | 60.6 | +3.6 | |
Labor | Ralph Wells | 6,832 | 35.4 | −7.6 | |
Independent | Andrew Low | 768 | 4.0 | +4.0 | |
Total formal votes | 19,296 | 97.1 | +0.7 | ||
Informal votes | 576 | 2.9 | −0.7 | ||
Liberal and Country hold | Swing | N/A | |||
Party | Candidate | Votes | % | ±% | |
---|---|---|---|---|---|
Liberal and Country | Frank Smith | 9,710 | 57.0 | −7.8 | |
Labor | John Fitzgerald | 7,327 | 43.0 | +7.8 | |
Total formal votes | 17,037 | 96.4 | −0.5 | ||
Informal votes | 637 | 3.6 | +0.5 | ||
Turnout | 17,674 | 89.8 | +42.2 | ||
Liberal and Country hold | Swing | -7.8 | |||
Party | Candidate | Votes | % | ±% | |
---|---|---|---|---|---|
Liberal and Country | Frank Smith | 5,232 | 64.8 | +24.7 | |
Labor | Sydney Gay | 2,847 | 35.2 | +15.9 | |
Total formal votes | 8,079 | 96.9 | −1.5 | ||
Informal votes | 257 | 3.1 | +1.5 | ||
Turnout | 8,336 | 47.6 | −12.3 | ||
Liberal and Country gain from Independent | Swing | N/A | |||
Party | Candidate | Votes | % | ±% | |
---|---|---|---|---|---|
Independent | William Fisk | 3,831 | 40.5 | ||
Liberal and Country | Ernest Anthoney | 3,793 | 40.1 | ||
Labor | Thomas Barker | 1,825 | 19.3 | ||
Total formal votes | 9,449 | 98.4 | |||
Informal votes | 154 | 1.6 | |||
Turnout | 9,603 | 59.9 | |||
Two-candidate-preferred result | |||||
Independent | William Fisk | 5,295 | 56.0 | ||
Liberal and Country | Ernest Anthoney | 4,154 | 44.0 | ||
Independent gain from Liberal and Country | Swing | ||||
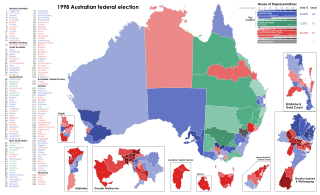
The 1998 Australian federal election was held to determine the members of the 39th Parliament of Australia. It was held on 3 October 1998. All 148 seats of the House of Representatives and 40 seats of the 76-seat Senate were up for election. The incumbent centre-right Liberal/National Coalition government led by Prime Minister John Howard of the Liberal Party and coalition partner Tim Fischer of the National Party defeated the centre-left Australian Labor Party opposition led by Opposition Leader Kim Beazley, despite losing the nationwide popular and two-party preferred vote. However, the Australian Labor Party gained seats from the previous election.
The Mackerras pendulum was devised by the Australian psephologist Malcolm Mackerras as a way of predicting the outcome of an election contested between two major parties in a Westminster style lower house legislature such as the Australian House of Representatives, which is composed of single-member electorates and which uses a preferential voting system such as a Condorcet method or IRV.
The 1968South AustralianState election was held in South Australia on 2 March 1968. All 39 seats in the South Australian House of Assembly were up for election; 38 of the 39 contests were won by candidates from Australia's two major political parties. The incumbent Labor Party South Australia led by Premier of South Australia Don Dunstan and the Liberal and Country League led by Leader of the Opposition Steele Hall) both won 19 seats. The sole independent candidate to win a race, Tom Stott of the Ridley electorate, joined with the LCL's 19 seats to form a coalition government that held a 20 to 19 majority, thus defeating the Dunstan Labor government.
State elections were held in South Australia on 7 March 1959. All 39 seats in the South Australian House of Assembly were up for election. The incumbent Liberal and Country League led by Premier of South Australia Thomas Playford IV defeated the Australian Labor Party led by Leader of the Opposition Mick O'Halloran.
State elections were held in South Australia on 3 March 1956. All 39 seats in the South Australian House of Assembly were up for election. The incumbent Liberal and Country League led by Premier of South Australia Thomas Playford IV defeated the Australian Labor Party led by Leader of the Opposition Mick O'Halloran.
State elections were held in South Australia on 7 March 1953. All 39 seats in the South Australian House of Assembly were up for election. The incumbent Liberal and Country League led by Premier of South Australia Thomas Playford IV defeated the Australian Labor Party led by Leader of the Opposition Mick O'Halloran.
State elections were held in South Australia on 4 March 1950. All 39 seats in the South Australian House of Assembly were up for election. The incumbent Liberal and Country League led by Premier of South Australia Thomas Playford IV defeated the Australian Labor Party led by Leader of the Opposition Mick O'Halloran.
State elections were held in South Australia on 29 April 1944. All 39 seats in the South Australian House of Assembly were up for election. The incumbent Liberal and Country League government led by Premier of South Australia Thomas Playford IV defeated the opposition Australian Labor Party led by Leader of the Opposition Robert Richards.
This is a list of electoral results for the Electoral district of Frome in South Australian state elections.
This is a list of electoral results for the Electoral district of Norwood in South Australian state elections.
This is a list of electoral results for the electoral district of Geraldton in Western Australian state elections.
This is a list of House of Assembly results for the 1959 South Australian state election.
This is a list of House of Assembly results for the 1956 South Australian state election.
This is a list of House of Assembly results for the 1950 South Australian state election.
Elections were held in the Australian state of Victoria on Saturday 21 June 1958 to elect 17 of the 34 members of the state's Legislative Council for six year terms. MLCs were elected in single-member provinces using preferential voting. This was the last time Legislative Council elections were held separately to those of the Legislative Assembly.
Elections were held in the Australian state of Victoria on Saturday 21 June 1952 to elect 17 of the 34 members of the state's Legislative Council for six year terms. MLCs were elected in single-member provinces using preferential voting.
This is a list of electoral results for the Electoral district of Beeloo in Western Australian state elections.
The 2021 Western Australian state election was held on Saturday, March 13, to elect members to the Parliament of Western Australia, where all 59 seats in the Legislative Assembly and all 36 seats in the Legislative Council were up for election.
This is a list of electoral district results for the Victorian 1958 election.
This is a list of electoral results for the electoral district of Hampden in Victorian state elections.