Electricity sector in Belgium

Last updated
Electricity generation in Belgium Electricity generation in Belgium.svg
Electricity generation in Belgium

Electricity production in Belgium reached 87.9 terawatt-hours (TWh) in 2020, with nuclear power (39%), natural gas (30%), and wind (15%) as the primary sources. Additional contributions came from biofuels and waste (7%), solar (6%), and coal (2%). In the same year, the total electricity demand was 80.9 TWh, with consumption predominantly from the industrial sector (50%), followed by commercial (25%), residential (23%), and transport (2%) sectors. [1] [2]

Contents

Belgium's federal electricity policy aims to enhance renewable energy, increase cross-border interconnection capacity, and phase out nuclear power by 2025. A key initiative includes promoting offshore wind energy through competitive auctioning processes. In response to the nuclear phase-out, Belgium is set to introduce between 2.0 and 3.6 gigawatts (GW) of new capacity by 2025. [2]

Electricity per capita by power source

In 2008 Belgium consumed electricity 8,961 kWh/person. EU15 average was 7,409 kWh/person. [3]

Electricity per capita in Belgium (kWh/person) [3]
YearUseProductionNet ImportsFossil Nuclear Other
RE
Biomass
& waste
Wind Non RE
use*
RE
%
Amount %Amount %
20048,9678,2197498.3%3,3234,54050.6 %1681878,6124.0%
20058,9138,3116026.8 %3,3514,54651.0%2002158,4994.7%
20069,1118,4666457.1%3,3434,58150.3 %2343088,5685.9%
20088,9617,96299911.1%2,9974,29547.9 %2524188,2917.5%
20098,1528,319-167-2.0 %3,3304,38853.8%74*43693*7,5497,4%
* Other RE is waterpower, solar and geothermal electricity and wind power until 2008
* Non RE use = use – production of renewable electricity
* RE % = (production of RE / use) * 100% Note: European Union calculates the share of renewable energies in gross electrical consumption.

Imports

Total electricity imports in Belgium were 11 TWh in 2008. This was the seventh highest total in the world behind Brazil (42 TWh), Italy (40 TWh), USA (33 TWh), the Netherlands (16 TWh), Finland (13 TWh), and the UK (11 TWh). [4] More recent data show that this deficit was reduced to 9.6 TWh in 2013.[ citation needed ]

Belgium has traditionally depended on electricity imports, mainly from France and, in recent years, the Netherlands. Although it has been a net importer since 1991, it became a net exporter in more recent years, particularly in 2019 and 2020. The net exports in 2019 reached 1.9 terawatt-hours (TWh), supported by increased nuclear generation, enhanced wind and solar PV production, and the initiation of its first interconnection with the United Kingdom. However, net exports fell to 0.3 TWh in 2020. [2]

Nuclear power

In 2020, Belgium's nuclear sector comprised seven reactors across two power plants, with an installed capacity of 5.94 gigawatts (GW). The nuclear reactors generated 34.4 terawatt-hours (TWh) of electricity, marking a 28% decrease since 2010. Despite this decline, nuclear energy accounted for 17.8% of Belgium's total energy supply and 39.2% of its electricity generation. [2]

Belgium's nuclear policy aims to achieve a secure phase-out by 2025 while prioritizing safe waste disposal and research continuity. Oversight of safety and licensing is entrusted to the Federal Agency for Nuclear Control. Enacted in 2003, Belgium's federal law mandates the phase-out of all nuclear electricity generation. Amendments in 2013 and 2015 extended the operational lifespan of two reactors until 2025. In 2022, Belgium extended 2 gigawatts (GW) of nuclear capacity for ten years, citing the Russian invasion of Ukraine and a commitment to reduce reliance on fossil fuels as reasons. In accordance with this revised plan, the majority of Belgium's nuclear power generation capacity will be phased-out by 2025. Additionally, Belgium implemented a Capacity Remuneration Mechanism (CRM), auctioning payments to 4.4 GW of capacity in October 2021, aimed at supporting electricity supply. [2]

Renewable electricity

From 2010 to 2020, Belgium's production of electricity from renewable sources expanded from 5.4 terawatt-hours (TWh) to 23.4 TWh. This growth was principally attributed to an increase in wind energy, from 1.4% to 14.4% of the country's total electricity generation, and an enhancement in solar photovoltaic (PV) output, from 0.6% to 5.8%. Additionally, electricity generated from bioenergy—which encompasses solid biomass, biogas, renewable waste, and liquid biofuels—rose from 4.4% to 6.0%. Conversely, due to Belgium's constrained hydropower resources, hydropower's share of electricity generation remained minimal, at 0.3% in 2020. [2]

In 2020, Belgium's CO2 emissions from energy use were predominantly from industry (32%), buildings (26%), transportation (25%), and electricity/heat generation (17%). The major fuel sources driving these emissions included oil (46%) and natural gas (40%), with coal (10%) and non-renewable waste (4%) also contributing. [2]

See also

Related Research Articles

<span class="mw-page-title-main">Electricity sector in Norway</span>

The electricity sector in Norway relies predominantly on hydroelectricity. A significant share of the total electrical production is consumed by national industry.

<span class="mw-page-title-main">Energy in Japan</span> Overview of the production, consumption, import and export of energy and electricity in Japan

Japan is a major consumer of energy, ranking fifth in the world by primary energy use. Fossil fuels accounted for 88% of Japan's primary energy in 2019. Japan imports most of its energy due to scarce domestic resources. As of 2022, the country imports 97% of its oil and is the larger LNG importer globally.

<span class="mw-page-title-main">Energy in the United Kingdom</span> Overview of the energy use of the United Kingdom

Energy in the United Kingdom came mostly from fossil fuels in 2021. Total energy consumption in the United Kingdom was 142.0 million tonnes of oil equivalent in 2019. In 2014, the UK had an energy consumption per capita of 2.78 tonnes of oil equivalent compared to a world average of 1.92 tonnes of oil equivalent. Demand for electricity in 2014 was 34.42 GW on average coming from a total electricity generation of 335.0 TWh.

<span class="mw-page-title-main">Renewable energy in Germany</span>

Renewable energy in Germany is mainly based on wind and biomass, plus solar and hydro. Germany had the world's largest photovoltaic installed capacity until 2014, and as of 2023 it has over 82 GW. It is also the world's third country by installed total wind power capacity, 64 GW in 2021 and second for offshore wind, with over 7 GW. Germany has been called "the world's first major renewable energy economy".

<span class="mw-page-title-main">Energy in Brazil</span> Overview of the production, consumption, import and export of energy and electricity in Brazil

Brazil is the 7th largest energy consumer in the world and the largest in South America. At the same time, it is an important oil and gas producer in the region and the world's second largest ethanol fuel producer. The government agencies responsible for energy policy are the Ministry of Mines and Energy (MME), the National Council for Energy Policy (CNPE), the National Agency of Petroleum, Natural Gas and Biofuels (ANP) and the National Agency of Electricity (ANEEL). State-owned companies Petrobras and Eletrobras are the major players in Brazil's energy sector, as well as Latin America's.

<span class="mw-page-title-main">Energy policy of China</span> Energy sources used and produced by China

China is both the world's largest energy consumer and the largest industrial country, and ensuring adequate energy supply to sustain economic growth has been a core concern of the Chinese Government since the founding of the People's Republic of China in 1949. Since the country's industrialization in the 1960s, China is currently the world's largest emitter of greenhouse gases, and coal in China is a major cause of global warming. However, from 2010 to 2015 China reduced energy consumption per unit of GDP by 18%, and CO2 emissions per unit of GDP by 20%. On a per-capita basis, China was only the world's 51st largest emitter of greenhouse gases in 2016. China is also the world's largest renewable energy producer, and the largest producer of hydroelectricity, solar power and wind power in the world. The energy policy of China is connected to its industrial policy, where the goals of China's industrial production dictate its energy demand managements.  

<span class="mw-page-title-main">Wind power in Sweden</span>

Sweden consumes about 150 terawatt hours of electricity per year, of which about 27.1 TW·h (19.0%) was generated from domestic wind power resources in 2021, up from 2.4% in 2010 and 0.3% in 2000.

<span class="mw-page-title-main">Electricity sector in China</span>

China is the world's largest electricity producer, having overtaken the United States in 2011 after rapid growth since the early 1990s. In 2021, China produced 8.5 petawatt-hour (PWh) of electricity, approximately 30% of the world's electricity production.

There is a large array of stakeholders that provide services through electricity generation, transmission, distribution and marketing for industrial, commercial, public and residential customers in the United States. It also includes many public institutions that regulate the sector. In 1996, there were 3,195 electric utilities in the United States, of which fewer than 1,000 were engaged in power generation. This leaves a large number of mostly smaller utilities engaged only in power distribution. There were also 65 power marketers. Of all utilities, 2,020 were publicly owned, 932 were rural electric cooperatives, and 243 were investor-owned utilities. The electricity transmission network is controlled by Independent System Operators or Regional Transmission Organizations, which are not-for-profit organizations that are obliged to provide indiscriminate access to various suppliers to promote competition.

<span class="mw-page-title-main">Electricity sector in Sweden</span> Overview of the electricity sector in Sweden

Majority of electricity production in Sweden relies on hydro power and nuclear power. In 2008 the consumption of electricity in Sweden was 16018 kWh per capita, compared to EU average 7409 kWh per capita. Sweden has a national grid, which is part of the Synchronous grid of Northern Europe. A specialty of the Nordic energy market is the existence of so-called electricity price areas, which complicate the wholesale Nordic energy market.

<span class="mw-page-title-main">Electricity sector in the United Kingdom</span> Overview of the electricity sector in the United Kingdom

The United Kingdom has a National Grid that covers most of mainland Great Britain and several of the surrounding islands, as well as some connectivity to other countries. The electrical sector supplies power to consumers at 230 volts AC with a frequency of 50 Hz. In 2020 the electricity sector's grid supply came from 55% low-carbon power, 36.1% fossil fuelled power, and 8.4% imports. Renewable power is showing strong growth, while fossil fuel generator use in general and coal use in particular is shrinking, with historically dominant coal generators now mainly being run in winter due to pollution and costs, and contributed just 1.6% of the supply in 2020.

<span class="mw-page-title-main">Electricity sector in France</span> Overview of the electricity sector in France

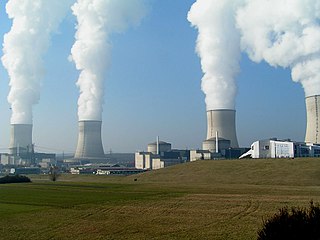
The electricity sector in France is dominated by its nuclear power, which accounted for 71.7% of total production in 2018, while renewables and fossil fuels accounted for 21.3% and 7.1%, respectively. France has the largest share of nuclear electricity in the world, and together with renewable energy supplies, this has helped its grid achieve very low carbon intensity.

<span class="mw-page-title-main">Electricity sector in Japan</span> Overview of the electricity sector in Japan

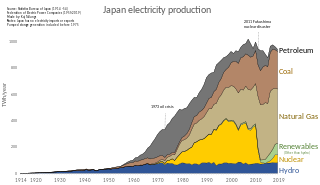
The electric power industry in Japan covers the generation, transmission, distribution, and sale of electric energy in Japan. Japan consumed approximately 918 terawatt-hours (TWh) of electricity in 2014. Before the 2011 Fukushima Daiichi nuclear disaster, about a quarter of electricity in the country was generated by nuclear power. In the following years, most nuclear power plants have been on hold, being replaced mostly by coal and natural gas. Solar power is a growing source of electricity, and Japan has the third largest solar installed capacity with about 50 GW as of 2017. Japan's electricity production is characterized by a diverse energy mix, including nuclear, fossil fuels, renewable energy, and hydroelectric power.

<span class="mw-page-title-main">Electricity sector in Spain</span> Overview of the electricity sector in Spain

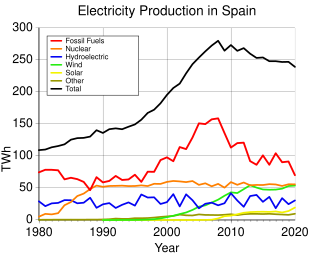
In 2023, Spain consumed 244,686 gigawatt hours (GWh) of electricity, a 2.3% decline from 2022.

<span class="mw-page-title-main">Electricity sector in Switzerland</span> Overview of the electricity sector in Switzerland

The electricity sector in Switzerland relies mainly on hydroelectricity, since the Alps cover almost two-thirds of the country's land mass, providing many large mountain lakes and artificial reservoirs suited for hydro power. In addition, the water masses drained from the Swiss Alps are intensively used by run-of-the-river hydroelectricity (ROR). With 9,052 kWh per person in 2008, the country's electricity consumption is relatively high and was 22% above the European Union's average.

South Africa has a large energy sector, being the third-largest economy in Africa. The country consumed 227 TWh of electricity in 2018. The vast majority of South Africa's electricity was produced from coal, with the fuel responsible for 88% of production in 2017. South Africa is the 7th largest coal producer in the world. As of July 2018, South Africa had a coal power generation capacity of 39 gigawatts (GW). South Africa is the world's 14th largest emitter of greenhouse gases. South Africa is planning to shift away from coal in the electricity sector and the country produces the most solar and wind energy by terawatt-hours in Africa. The country aims to decommission 34 GW of coal-fired power capacity by 2050. It also aims to build at least 20 GW of renewable power generation capacity by 2030. South Africa aims to generate 77,834 megawatts (MW) of electricity by 2030, with new capacity coming significantly from renewable sources to meet emission reduction targets. Through its goals stated in the Integrated Resource Plan, it announced the Renewable Energy Independent Power Producer Procurement Programme, which aims to increase renewable power generation through private sector investment.

The Polish energy sector is the fifth largest in Europe. In 2023, the country consumed 167.52 TWh of electricity, a 3.44% year–on–year decrease from 2022. Out of this, 76.61 TWh came from hard coal, 34.57 TWh from lignite, 22 TWh from wind energy, and 13.65 TWh from gas, with the remainder coming from other sources, such as solar, biomass, and hydropower.

<span class="mw-page-title-main">Energy in Sweden</span> Overview of energy use in Sweden

Energy in Sweden describes energy and electricity production, consumption and import in Sweden. Electricity sector in Sweden is the main article of electricity in Sweden. The Swedish climate bill of February 2017 aims to make Sweden carbon neutral by 2045. The Swedish target is to decline emission of climate gases 63% from 1990 to 2030 and international transportation excluding foreign flights 70%. By 2014 just over half of the country's total final energy consumption in electricity, heating and cooling and transport combined was provided by renewables, the highest share amongst the then 28 EU member countries. About a third of Sweden's electricity is generated by nuclear power. In generating a year's worth of this energy, Swedes generate about 4 tonnes of CO2 emissions each. Since 2010, sustainability measures have reduced total emissions even as the population has increased.

<span class="mw-page-title-main">Energy in Spain</span> Overview of the production, consumption, import and export of energy and electricity in Spain

Primary energy consumption in Spain in 2015 was mainly composed of fossil fuels. The largest sources are petroleum (42.3%), natural gas (19.8%) and coal (11.6%). The remaining 26.3% is accounted for by nuclear energy (12%) and different renewable energy sources (14.3%). Domestic production of primary energy includes nuclear (44,8%), solar, wind and geothermal (22,4%), biomass and waste (21,1%), hydropower (7,2%) and fossil (4,5%).

<span class="mw-page-title-main">Energy in Belarus</span> Overview of the production, consumption, import and export of energy and electricity in Belarus

Energy in Belarus describes energy and electricity production, consumption and import in Belarus. Belarus is a net energy importer. According to IEA, the energy import vastly exceeded the energy production in 2015, describing Belarus as one of the world's least energy sufficient countries in the world. Belarus is very dependent on Russia.
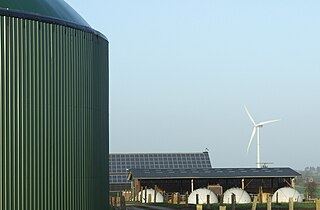
References

  1. "Belgium 2022 – Analysis". IEA. Retrieved 2024-03-05.
  2. 1 2 3 4 5 6 7 "Belgium 2022 - Energy Policy Review" (PDF). International Energy Agency.
  3. 1 2 Energy in Sweden, Facts and figures, The Swedish Energy Agency, (in Swedish: Energiläget i siffror), Table: Specific electricity production per inhabitant with breakdown by power source (kWh/person), Source: IEA/OECD 2006 T23 Archived July 4, 2011, at the Wayback Machine , 2007 T25 Archived July 4, 2011, at the Wayback Machine , 2008 T26 Archived July 4, 2011, at the Wayback Machine , 2009 T25 Archived January 20, 2011, at the Wayback Machine and 2010 T49 Archived October 16, 2013, at the Wayback Machine .
  4. IEA Key stats 2010 pages 27, 48