Related Research Articles

The United Kingdom straddles the higher mid-latitudes between 49° and 61°N on the western seaboard of Europe. Since the UK is always in or close to the path of the polar front jet stream, frequent changes in pressure and unsettled weather are typical. Many types of weather can be experienced in a single day. The basic climate of the UK annually is wet and cool in winter, spring, and fall with frequent cloudy skies, and drier and cool to mild in summer.
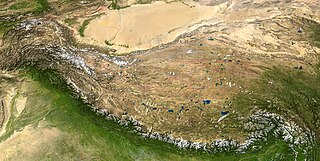
A rain shadow is an area of significantly reduced rainfall behind a mountainous region, on the side facing away from prevailing winds, known as its leeward side.

Cherrapunji or Sohra is a sub-divisional town East Khasi Hills district in the Indian state of Meghalaya. It was the traditional capital of ka hima Sohra.
The climate of Bismarck in the U.S. state of North Dakota is humid continental, caused primarily by the combination of its mid-level latitude and location not far from the geographic centre of the U.S. Its summers are hot enough for it to border on having a Köppen Dwa classification, and precipitation is high enough for it to barely avoid being classified as semi-arid. The city's climate displays four very distinct seasons and great variation in temperatures over very short periods of time. Like other cities in the northern Great Plains, its climate is also fairly dry.
The winter of 1894–1895 was severe for the British Isles with a Central England temperature (CET) of 1.17 °C or 34.1 °F. Many climatologists have come to view this winter as the end of the Little Ice Age and the culmination of a decade of harsh winters in Britain. Whereas the average CET for the 10 winters from 1885–1886 to 1894–1895 was 2.87 °C or 37.2 °F, no winter with a CET under 3.0 °C or 37.4 °F followed for 22 years and no month as cold as February or January 1895 until 1940. In contrast, between 1659 and 1894, no spell with every winter CET above 3.0 °C or 37.4 °F had lasted longer than 12 winters.[b]
Lhünzhub, or Ganden Chökhor is a small town, the administrative center of Lhünzhub County in the Lhasa Prefecture of Tibet, China. It is located northeast of Lhasa.
In Australia, the Federation Drought is the name given to a prolonged period of drought that occurred around the time of Federation in 1901.
The 1950 rainfall records for the Australian states of New South Wales and Queensland reported probably the most remarkable record high rainfall totals ever recorded anywhere in the continent. Averaged over both of these states, 1950 is clearly the wettest year since adequate records became available circa 1885. Queensland recorded a statewide average rainfall of around 1,125 millimetres (44.3 in) as against a mean since 1885 of around 640 millimetres (25.2 in), whilst New South Wales recorded around 930 millimetres (36.6 in) as against an instrumental mean around 520 millimetres (20.5 in). Australia's wettest town, Tully also recorded its highest annual rainfall total in 1950 with 7,925 millimetres (312.0 in).
Between 1979 and 1983 almost all of eastern Australia was affected by a major drought.

Kurān wa Munjān, also spelled Kiran wa Munjan or Koran va Monjan, is a village in Badakhshan Province in north-eastern Afghanistan. It is the capital of Kuran wa Munjan District.

The climate of Paraguay consists of a subtropical climate in the Paranaense region and a tropical climate in the Chaco. The Paranaense region has a humid climate, with abundant rainfall throughout the year and only moderate seasonal changes in temperature.
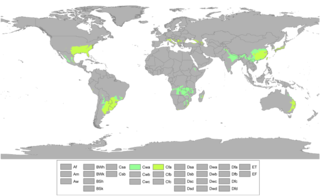
A humid subtropical climate is a temperate climate type characterized by long and hot summers, and cool to mild winters. These climates normally lie on the southeast side of all continents, generally between latitudes 25° and 40° and are located poleward from adjacent tropical climates, and equatorward from either humid continental or oceanic climates. It is also known as warm temperate climate in some climate classifications.
The 1911–16 Australian drought consisted of a series of droughts that affected various regions of Australia between the years of 1911 and 1916. Most of the dry spells during this period can be related to three El Niño events in 1911, 1913 and 1914, though rainfall deficiencies actually began in northern Australia before the first of these El Niños set in and did not ease in coastal districts of New South Wales until well after the last El Niño had firmly dissipated and trends toward very heavy rainfall developed in other areas of the continent.

The climate of Wales refers to the weather conditions prevailing in Wales in general or over a long period.

An area of tropical monsoon climate is a tropical climate subtype that corresponds to the Köppen climate classification category Am. Tropical monsoon climates have monthly mean temperatures above 18 °C (64 °F) in every month of the year and a dry season. The tropical monsoon climate is the intermediate climate between the wet Af and the drier Aw.

Earth rainfall climatology Is the study of rainfall, a sub-field of meteorology. Formally, a wider study includes water falling as ice crystals, i.e. hail, sleet, snow. The aim of rainfall climatology is to measure, understand and predict rain distribution across different regions of planet Earth, a factor of air pressure, humidity, topography, cloud type and raindrop size, via direct measurement and remote sensing data acquisition. Current technologies accurately predict rainfall 3–4 days in advance using numerical weather prediction. Geostationary orbiting satellites gather IR and visual wavelength data to measure realtime localised rainfall by estimating cloud albedo, water content, and the corresponding probability of rain.
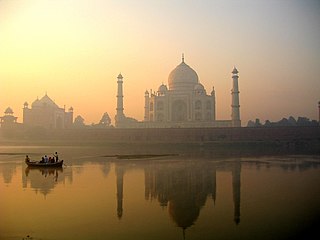
The climate of Agra features a semi-arid climate that borders on a humid subtropical climate. The city features mild winters, hot and dry summers and a monsoon season. The monsoon, though substantial in Agra, is not quite as heavy as the monsoon in other parts of India. The mean annual rainfall of Agra district is 671 mm (26.4 in). The district receives the majority of this rainfall during the monsoon months i.e., June to September, which averages around 603 mm (23.7 in). Agra has a reputation for being one of the hottest and the coldest towns in India. In summer the city witnesses a sudden surge in temperature and at times, mercury goes beyond the 46 °C (115 °F) mark in addition to a very high level of humidity. During summer, the daytime temperature hovers around 46–50 °C (115–122 °F). Nights are relatively cooler and temperature lowers to 30 °C (86 °F). Winter minimum temperatures sometimes go as low as 3 or 3.5 °C but usually hover in the range of 6–8 °C (43–46 °F).
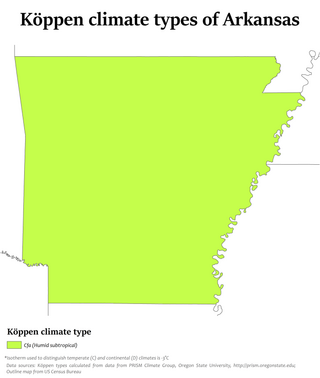
Little Rock has a humid subtropical climate, with hot, usually humid summers, but subject to drought, primarily in late summer. According to the Trewartha climate classification system, Little Rock is subtropical because nine of its months exceed 50 °F (10 °C) in average temperature. Summers are usually hot, occasionally extremely hot; winters are short and cool, but with marked temperature variations, as the area is subject to alternating incursions of warm, moist air from the Gulf of Mexico and cold, dry air from Canada.
Khandkhel or Khand Khil is a town in the Said Karam District of Paktia Province, Afghanistan. It is located 25 km to the northeast of Gardez, the capital of Paktia, and is 40 km to the southwest of Aryob.
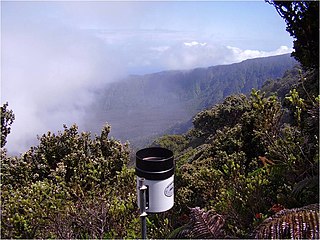
The Big Bog is a high-altitude bog on the island of Maui, the largest in the Hawaiian Islands. It is located on Haleakala's east rift zone, at the border between Hāna Forest Reserve and Haleakalā National Park. It is alleged to be one of the wettest places on Earth, with a reported annual rainfall of 404 inches (10,300 mm) for the period 1992-2018 according to the University of Hawaiʻi at Mānoa.
References
- ↑ Nicholas, F. J. and Glasspoole, J. 1931. “General Monthly Rainfall over England and Wales 1727 to 1931”, British Rainfall (1931), p. 299.
- 1 2 3 4 5 6 7 8 9 10 Lough, Janice; Wigley Tom and Jones, Phil; “Spatial patterns of precipitation in England and Wales and a revised homogeneous England and Wales precipitation series”; in Journal of Climatology; Volume 4, pp. 1-25 (1984)
- ↑ Craddock, J.M.; “Annual rainfall in England since 1725” in Quarterly Journal of the Royal Meteorological Society, 102 (1976), pp. 823-840
- ↑ "Met Office Hadley Centre HadUKP Data Download". www.metoffice.gov.uk.
- ↑ Simpson, I. R. and Jones, Phil; “Updated precipitation series for the UK derived from Met Office gridded data”; in International Journal of Climatology 32 (2012), pp. 2271–2282
- ↑ Woodley, M.R.; “A Review of Two National Rainfall Series”; in International Journal of Climatology, 16, pp. 677-687 (1996)
- 1 2 Thompson, R.; “A time-series analysis of the changing seasonality of precipitation in the British Isles and neighbouring areas”; in Journal of Hydrology, 224 (1999); pp. 169–183
- 1 2 Alexander, L. V. and Jones, Phil; “Updated Precipitation Series for the U.K. and Discussion of Recent Extremes”; in Atmospheric Science Letters, Volume 1 (2001)
- ↑ "HadEWP ranked driest to wettest from 1766 to 2022". Met Office.
- ↑ "Monthly England & Wales precipitation (mm). Daily automated values used after 1996". Met Office.