Management science (MS) is the broad interdisciplinary study of problem solving and decision making in human organizations, with strong links to management, economics, business, engineering, management consulting, and other fields. It uses various scientific research-based principles, strategies, and analytical methods including mathematical modeling, statistics and numerical algorithms to improve an organization's ability to enact rational and accurate management decisions by arriving at optimal or near optimal solutions to complex decision problems. Management science helps businesses to achieve goals using various scientific methods.

Statistics is the discipline that concerns the collection, organization, analysis, interpretation, and presentation of data. In applying statistics to a scientific, industrial, or social problem, it is conventional to begin with a statistical population or a statistical model to be studied. Populations can be diverse groups of people or objects such as "all people living in a country" or "every atom composing a crystal". Statistics deals with every aspect of data, including the planning of data collection in terms of the design of surveys and experiments.
Geostatistics is a branch of statistics focusing on spatial or spatiotemporal datasets. Developed originally to predict probability distributions of ore grades for mining operations, it is currently applied in diverse disciplines including petroleum geology, hydrogeology, hydrology, meteorology, oceanography, geochemistry, geometallurgy, geography, forestry, environmental control, landscape ecology, soil science, and agriculture. Geostatistics is applied in varied branches of geography, particularly those involving the spread of diseases (epidemiology), the practice of commerce and military planning (logistics), and the development of efficient spatial networks. Geostatistical algorithms are incorporated in many places, including geographic information systems (GIS) and the R statistical environment.
A prediction, or forecast, is a statement about a future event. They are often, but not always, based upon experience or knowledge. There is no universal agreement about the exact difference from "estimation"; different authors and disciplines ascribe different connotations.
Social statistics is the use of statistical measurement systems to study human behavior in a social environment. This can be accomplished through polling a group of people, evaluating a subset of data obtained about a group of people, or by observation and statistical analysis of a set of data that relates to people and their behaviors.

In mathematics, a time series is a series of data points indexed in time order. Most commonly, a time series is a sequence taken at successive equally spaced points in time. Thus it is a sequence of discrete-time data. Examples of time series are heights of ocean tides, counts of sunspots, and the daily closing value of the Dow Jones Industrial Average.

In mathematics, extrapolation is a type of estimation, beyond the original observation range, of the value of a variable on the basis of its relationship with another variable. It is similar to interpolation, which produces estimates between known observations, but extrapolation is subject to greater uncertainty and a higher risk of producing meaningless results. Extrapolation may also mean extension of a method, assuming similar methods will be applicable. Extrapolation may also apply to human experience to project, extend, or expand known experience into an area not known or previously experienced so as to arrive at a knowledge of the unknown. The extrapolation method can be applied in the interior reconstruction problem.

In statistical modeling, regression analysis is a set of statistical processes for estimating the relationships between a dependent variable and one or more independent variables. The most common form of regression analysis is linear regression, in which one finds the line that most closely fits the data according to a specific mathematical criterion. For example, the method of ordinary least squares computes the unique line that minimizes the sum of squared differences between the true data and that line. For specific mathematical reasons, this allows the researcher to estimate the conditional expectation of the dependent variable when the independent variables take on a given set of values. Less common forms of regression use slightly different procedures to estimate alternative location parameters or estimate the conditional expectation across a broader collection of non-linear models.
Data assimilation is a mathematical discipline that seeks to optimally combine theory with observations. There may be a number of different goals sought, for example—to determine the optimal state estimate of a system, to determine initial conditions for a numerical forecast model, to interpolate sparse observation data using knowledge of the system being observed, to train numerical model parameters based on observed data. Depending on the goal, different solution methods may be used. Data assimilation is distinguished from other forms of machine learning, image analysis, and statistical methods in that it utilizes a dynamical model of the system being analyzed.
In robust statistics, robust regression is a form of regression analysis designed to overcome some limitations of traditional parametric and non-parametric methods. Regression analysis seeks to find the relationship between one or more independent variables and a dependent variable. Certain widely used methods of regression, such as ordinary least squares, have favourable properties if their underlying assumptions are true, but can give misleading results if those assumptions are not true; thus ordinary least squares is said to be not robust to violations of its assumptions. Robust regression methods are designed to be not overly affected by violations of assumptions by the underlying data-generating process.
In spatial ecology and macroecology, scaling pattern of occupancy (SPO), also known as the area-of-occupancy (AOO) is the way in which species distribution changes across spatial scales. In physical geography and image analysis, it is similar to the modifiable areal unit problem. Simon A. Levin (1992) states that the problem of relating phenomena across scales is the central problem in biology and in all of science. Understanding the SPO is thus one central theme in ecology.
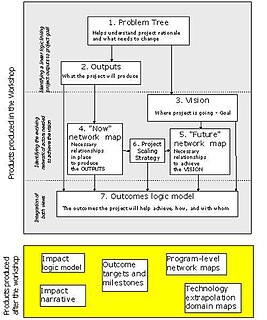
Participatory impact pathways analysis (PIPA) is a project management approach in which the participants in a project, including project staff, key stakeholders, and the ultimate beneficiaries, together co-construct their program theory.

The following outline is provided as an overview of and topical guide to the field of Meteorology.
The net-map toolbox is a social network analysis tool that uses interviews and mapping to help people understand, visualize, discuss, and improve situations in which many different actors influence outcomes. Social network analysis is a research approach used by scholars such as S.D. Berkowitz, Stephen Borgatti, Ronald Burt, Linton Freeman, Mark Granovetter, Nicholas Mullins, Anatol Rapoport, Stanley Wasserman, Barry Wellman, and Harrison White to better understand the implications of the position of individual actors in a social structure.

Species distribution modelling (SDM), also known as environmental(or ecological) niche modelling (ENM), habitat modelling, predictive habitat distribution modelling, and range mapping uses computer algorithms to predict the distribution of a species across geographic space and time using environmental data. The environmental data are most often climate data, but can include other variables such as soil type, water depth, and land cover. SDMs are used in several research areas in conservation biology, ecology and evolution. These models can be used to understand how environmental conditions influence the occurrence or abundance of a species, and for predictive purposes. Predictions from an SDM may be of a species’ future distribution under climate change, a species’ past distribution in order to assess evolutionary relationships, or the potential future distribution of an invasive species. Predictions of current and/or future habitat suitability can be useful for management applications.
National Innovations on Climate Resilient Agriculture (NICRA) was launched during February 2011 by Indian Council of Agricultural Research (ICAR) with the funding from Ministry of Agriculture, Government of India. The mega project has three major objectives of strategic research, technology demonstrations and capacity building. Assessment of the impact of climate change simultaneous with formulation of adaptive strategies is the prime approach under strategic research across all sectors of agriculture, dairying and fisheries.

Frédéric Yves Bois, Pharm.D.Ph.D. is a French biological scientist working in toxicology and bioinformatics. He is currently Research Director at the French Institut National de l'Environnement et des Risques (INERIS).
Bayesian Analysis is an open-access peer-reviewed scientific journal covering theoretical and applied aspects of Bayesian methods. It is published by the International Society for Bayesian Analysis and is hosted at the Project Euclid web site.
The Surveillance of Partially Observable Systems is a research method done for the first time by S. Amir Mir M. and Daniel Lane from 2005 to 2008 at the University of Ottawa, Canada.
Interrupted time series analysis (ITS), sometimes known as quasi-experimental time series analysis, is a method of statistical analysis involving tracking a long-term period before and after a point of intervention to assess the intervention's effects. The time series refers to the data over the period, while the interruption is the intervention, which is a controlled external influence or set of influences. Effects of the intervention are evaluated by changes in the level and slope of the time series and statistical significance of the intervention parameters. Interrupted time series design is the design of experiments based on the interrupted time series approach.