Galton board

Last updated
Galton box Galton box.jpg
Galton box
A Galton box demonstrated

The Galton board, also known as the Galton box or quincunx or bean machine, is a device invented by Sir Francis Galton [1] to demonstrate the central limit theorem, in particular that with sufficient sample size the binomial distribution approximates a normal distribution. Among its applications, it afforded insight into regression to the mean or "reversion to mediocrity".

Contents

Description

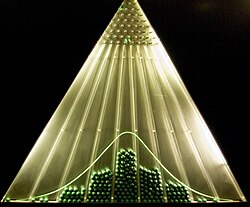
The Galton board consists of a vertical board with interleaved rows of pegs. Beads are dropped from the top and, when the device is level, bounce either left or right as they hit the pegs. Eventually they are collected into bins at the bottom, where the height of bead columns accumulated in the bins approximate a bell curve. Overlaying Pascal's triangle onto the pins shows the number of different paths that can be taken to get to each bin. [2]

Large-scale working models of this device created by Charles and Ray Eames can be seen in the Mathematica: A World of Numbers... and Beyond exhibits permanently on view at the Boston Museum of Science, the New York Hall of Science, or the Henry Ford Museum. [3] The Ford Museum machine was displayed at the IBM Pavilion during 1964-65 New York World's Fair, later appearing at Pacific Science Center in Seattle. [4] [5] Another large-scale version is displayed in the lobby of Index Fund Advisors in Irvine, California. [6]

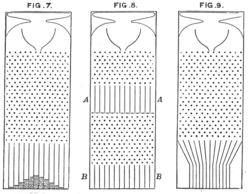
Boards can be constructed for other distributions by changing the shape of the pins or biasing them towards one direction, and even bimodal boards are possible. [7] A board for the log-normal distribution (common in many natural processes, particularly biological ones), which uses isosceles triangles of varying widths to 'multiply' the distance the bead travels instead of fixed sizes steps which would 'sum', was constructed by Jacobus Kapteyn while studying and popularizing the statistics of the log-normal in order to help visualize it and demonstrate its plausibility. [8] As of 1963, it was preserved in the University of Groningen. [9] There is also an improved log-normal machine that uses skewed triangles whose right sides are longer, and thus avoiding shifting the median of the beads to the left. [10]

Distribution of the beads

If a bead bounces to the right k times on its way down (and to the left on the remaining pegs) it ends up in the kth bin counting from the left. Denoting the number of rows of pegs in a Galton Board by n, the number of paths to the kth bin on the bottom is given by the binomial coefficient . Note that the leftmost bin is the 0-bin, next to it is the 1-bin, etc. and the furthest one to the right is the n-bin - making thus the total number of bins equal to n+1 (each row does not need to have more pegs than the number that identifies the row itself, e.g. the first row has 1 peg, the second 2 pegs, until the n-th row that has n pegs which correspond to the n+1 bins). If the probability of bouncing right on a peg is p (which equals 0.5 on an unbiased level machine) the probability that the ball ends up in the kth bin equals . This is the probability mass function of a binomial distribution. The number of rows correspond to the size of a binomial distribution in number of trials, while the probability p of each pin is the binomial's p.

According to the central limit theorem (more specifically, the de Moivre–Laplace theorem), the binomial distribution approximates the normal distribution provided that the number of rows and the number of balls are both large. Varying the rows will result in different standard deviations or widths of the bell-shaped curve or the normal distribution in the bins.

Another interpretation more accurate from the physical view is given by the Entropy: since the energy that is carried by every falling bead is finite, so even that on any tip their collision are chaotic because the derivative is undefined (there is no way to previously figure out for which side is going to fall), the mean and variance of each bean is restricted to be finite (they will never bound out of the box), so the Gaussian shape arises because it is the maximum entropy probability distribution for a continuous process with defined mean and variance. So, the rise of the normal distribution could be interpreted as that all possible information carried by each bean related to which path it has travel have been already completely lost through their downhill collisions.

Examples

History

Sir Francis Galton was fascinated with the order of the bell curve that emerges from the apparent chaos of beads bouncing off of pegs in the Galton Board. He described this relationship in his book Natural Inheritance (1889) in fanciful terms:

Order in Apparent Chaos: I know of scarcely anything so apt to impress the imagination as the wonderful form of cosmic order expressed by the Law of Frequency of Error. The law would have been personified by the Greeks and deified, if they had known of it. It reigns with serenity and in complete self-effacement amidst the wildest confusion. The huger the mob, and the greater the apparent anarchy, the more perfect is its sway. It is the supreme law of Unreason. Whenever a large sample of chaotic elements are taken in hand and marshalled in the order of their magnitude, an unsuspected and most beautiful form of regularity proves to have been latent all along. [1] :66

Games

Several games have been developed utilizing the idea of pins changing the route of balls or other objects:

Related Research Articles

<span class="mw-page-title-main">Binomial distribution</span> Probability distribution

In probability theory and statistics, the binomial distribution with parameters n and p is the discrete probability distribution of the number of successes in a sequence of n independent experiments, each asking a yes–no question, and each with its own Boolean-valued outcome: success or failure. A single success/failure experiment is also called a Bernoulli trial or Bernoulli experiment, and a sequence of outcomes is called a Bernoulli process; for a single trial, i.e., n = 1, the binomial distribution is a Bernoulli distribution. The binomial distribution is the basis for the popular binomial test of statistical significance.

A histogram is a visual representation of the distribution of quantitative data. The term was first introduced by Karl Pearson. To construct a histogram, the first step is to "bin" the range of values— divide the entire range of values into a series of intervals—and then count how many values fall into each interval. The bins are usually specified as consecutive, non-overlapping intervals of a variable. The bins (intervals) are adjacent and are typically of equal size.

In probability theory and statistics, kurtosis is a measure of the "tailedness" of the probability distribution of a real-valued random variable. Like skewness, kurtosis describes a particular aspect of a probability distribution. There are different ways to quantify kurtosis for a theoretical distribution, and there are corresponding ways of estimating it using a sample from a population. Different measures of kurtosis may have different interpretations.

<span class="mw-page-title-main">Probability distribution</span> Mathematical function for the probability a given outcome occurs in an experiment

In probability theory and statistics, a probability distribution is the mathematical function that gives the probabilities of occurrence of different possible outcomes for an experiment. It is a mathematical description of a random phenomenon in terms of its sample space and the probabilities of events.

<span class="mw-page-title-main">Skewness</span> Measure of the asymmetry of random variables

In probability theory and statistics, skewness is a measure of the asymmetry of the probability distribution of a real-valued random variable about its mean. The skewness value can be positive, zero, negative, or undefined.

<span class="mw-page-title-main">Abraham de Moivre</span> French mathematician (1667–1754)

Abraham de Moivre FRS was a French mathematician known for de Moivre's formula, a formula that links complex numbers and trigonometry, and for his work on the normal distribution and probability theory.

<span class="mw-page-title-main">Beta distribution</span> Probability distribution

In probability theory and statistics, the beta distribution is a family of continuous probability distributions defined on the interval [0, 1] or in terms of two positive parameters, denoted by alpha (α) and beta (β), that appear as exponents of the variable and its complement to 1, respectively, and control the shape of the distribution.

In probability and statistics, an exponential family is a parametric set of probability distributions of a certain form, specified below. This special form is chosen for mathematical convenience, including the enabling of the user to calculate expectations, covariances using differentiation based on some useful algebraic properties, as well as for generality, as exponential families are in a sense very natural sets of distributions to consider. The term exponential class is sometimes used in place of "exponential family", or the older term Koopman–Darmois family. Sometimes loosely referred to as "the" exponential family, this class of distributions is distinct because they all possess a variety of desirable properties, most importantly the existence of a sufficient statistic.

In statistics, a binomial proportion confidence interval is a confidence interval for the probability of success calculated from the outcome of a series of success–failure experiments. In other words, a binomial proportion confidence interval is an interval estimate of a success probability when only the number of experiments and the number of successes are known.

<span class="mw-page-title-main">Lattice model (finance)</span> Method for evaluating stock options that divides time into discrete intervals

In finance, a lattice model is a technique applied to the valuation of derivatives, where a discrete time model is required. For equity options, a typical example would be pricing an American option, where a decision as to option exercise is required at "all" times before and including maturity. A continuous model, on the other hand, such as Black–Scholes, would only allow for the valuation of European options, where exercise is on the option's maturity date. For interest rate derivatives lattices are additionally useful in that they address many of the issues encountered with continuous models, such as pull to par. The method is also used for valuing certain exotic options, where because of path dependence in the payoff, Monte Carlo methods for option pricing fail to account for optimal decisions to terminate the derivative by early exercise, though methods now exist for solving this problem.

In statistics, binomial regression is a regression analysis technique in which the response has a binomial distribution: it is the number of successes in a series of independent Bernoulli trials, where each trial has probability of success . In binomial regression, the probability of a success is related to explanatory variables: the corresponding concept in ordinary regression is to relate the mean value of the unobserved response to explanatory variables.

<span class="mw-page-title-main">Beta-binomial distribution</span> Discrete probability distribution

In probability theory and statistics, the beta-binomial distribution is a family of discrete probability distributions on a finite support of non-negative integers arising when the probability of success in each of a fixed or known number of Bernoulli trials is either unknown or random. The beta-binomial distribution is the binomial distribution in which the probability of success at each of n trials is not fixed but randomly drawn from a beta distribution. It is frequently used in Bayesian statistics, empirical Bayes methods and classical statistics to capture overdispersion in binomial type distributed data.

<i>Mathematica: A World of Numbers... and Beyond</i> Museum exhibit about mathematics

Mathematica: A World of Numbers... and Beyond is a kinetic and static exhibition of mathematical concepts designed by Charles and Ray Eames, originally debuted at the California Museum of Science and Industry in 1961. Duplicates have since been made, and they have been moved to other institutions.

Relative species abundance is a component of biodiversity and is a measure of how common or rare a species is relative to other species in a defined location or community. Relative abundance is the percent composition of an organism of a particular kind relative to the total number of organisms in the area. Relative species abundances tend to conform to specific patterns that are among the best-known and most-studied patterns in macroecology. Different populations in a community exist in relative proportions; this idea is known as relative abundance.

A quincunx originally meant a 5/12 fraction of something, but most modern uses involve patterns of five points. "Quincunx" or "quincuncial" may in particular refer to

<span class="mw-page-title-main">CumFreq</span> Software tool for data analysis and statistics

In statistics and data analysis the application software CumFreq is a tool for cumulative frequency analysis of a single variable and for probability distribution fitting.

Probability distribution fitting or simply distribution fitting is the fitting of a probability distribution to a series of data concerning the repeated measurement of a variable phenomenon. The aim of distribution fitting is to predict the probability or to forecast the frequency of occurrence of the magnitude of the phenomenon in a certain interval.

<span class="mw-page-title-main">Cumulative frequency analysis</span>

Cumulative frequency analysis is the analysis of the frequency of occurrence of values of a phenomenon less than a reference value. The phenomenon may be time- or space-dependent. Cumulative frequency is also called frequency of non-exceedance.

References

  1. 1 2 Galton, Sir Francis (1894). Natural Inheritance. Macmillan. ISBN   978-1297895982
  2. "The Galton Board". www.galtonboard.com. Four Pines Publishing, Inc. Retrieved 2018-03-06.
  3. "Henry Ford museum acquires Eames' Mathematica exhibit". Auction Central News. LiveAuctioneers. 20 March 2015. Retrieved 2018-03-06.
  4. "Pavilions & Attractions - IBM - Page Six". New York World's Fair. Retrieved 22 December 2011.
  5. "Mathematica Exhibition from the Office of Charles and Ray Eames Opens inside Henry Ford Museum of American Innovation, Sept. 23" (press release). Henry Ford Museum of American Innovation. September 21, 2017.
  6. Archived at Ghostarchive and the Wayback Machine : "IFA.tv - From Chaos to Order on the Galton Board -- A Random Walker". YouTube . 23 December 2009. Retrieved 2018-03-06.
  7. Brehmer et al 2018, "Mining gold from implicit models to improve likelihood-free inference": "Simulator Mining Example"
  8. Kapteyn 1903, Skew frequency curves in biology and statistics v1; Kapteyn & van Uven 1916, Skew frequency curves in biology and statistics v2
  9. Aitchison & Brown 1963, The Lognormal Distribution, with Special Reference to its Uses in Economics Archived 2019-08-02 at the Wayback Machine
  10. Limpert et al 2001, "Log-normal Distributions across the Sciences: Keys and Clues"