Multivariate statistics is a subdivision of statistics encompassing the simultaneous observation and analysis of more than one outcome variable, i.e., multivariate random variables. Multivariate statistics concerns understanding the different aims and background of each of the different forms of multivariate analysis, and how they relate to each other. The practical application of multivariate statistics to a particular problem may involve several types of univariate and multivariate analyses in order to understand the relationships between variables and their relevance to the problem being studied.
Psychological statistics is application of formulas, theorems, numbers and laws to psychology. Statistical methods for psychology include development and application statistical theory and methods for modeling psychological data. These methods include psychometrics, factor analysis, experimental designs, and Bayesian statistics. The article also discusses journals in the same field.
The following outline is provided as an overview of and topical guide to statistics:

Principal component analysis (PCA) is a linear dimensionality reduction technique with applications in exploratory data analysis, visualization and data preprocessing.
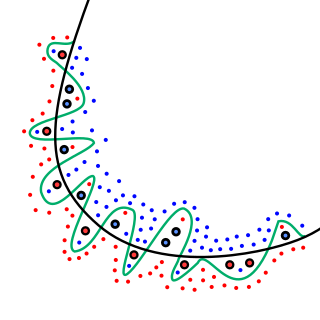
In mathematical modeling, overfitting is "the production of an analysis that corresponds too closely or exactly to a particular set of data, and may therefore fail to fit to additional data or predict future observations reliably". An overfitted model is a mathematical model that contains more parameters than can be justified by the data. In a mathematical sense, these parameters represent the degree of a polynomial. The essence of overfitting is to have unknowingly extracted some of the residual variation as if that variation represented underlying model structure.
Factor analysis is a statistical method used to describe variability among observed, correlated variables in terms of a potentially lower number of unobserved variables called factors. For example, it is possible that variations in six observed variables mainly reflect the variations in two unobserved (underlying) variables. Factor analysis searches for such joint variations in response to unobserved latent variables. The observed variables are modelled as linear combinations of the potential factors plus "error" terms, hence factor analysis can be thought of as a special case of errors-in-variables models.
In statistics, canonical-correlation analysis (CCA), also called canonical variates analysis, is a way of inferring information from cross-covariance matrices. If we have two vectors X = (X1, ..., Xn) and Y = (Y1, ..., Ym) of random variables, and there are correlations among the variables, then canonical-correlation analysis will find linear combinations of X and Y that have a maximum correlation with each other. T. R. Knapp notes that "virtually all of the commonly encountered parametric tests of significance can be treated as special cases of canonical-correlation analysis, which is the general procedure for investigating the relationships between two sets of variables." The method was first introduced by Harold Hotelling in 1936, although in the context of angles between flats the mathematical concept was published by Jordan in 1875.
In statistics, a generalized linear model (GLM) is a flexible generalization of ordinary linear regression. The GLM generalizes linear regression by allowing the linear model to be related to the response variable via a link function and by allowing the magnitude of the variance of each measurement to be a function of its predicted value.
Linear discriminant analysis (LDA), normal discriminant analysis (NDA), or discriminant function analysis is a generalization of Fisher's linear discriminant, a method used in statistics and other fields, to find a linear combination of features that characterizes or separates two or more classes of objects or events. The resulting combination may be used as a linear classifier, or, more commonly, for dimensionality reduction before later classification.

In statistics, the coefficient of determination, denoted R2 or r2 and pronounced "R squared", is the proportion of the variation in the dependent variable that is predictable from the independent variable(s).
The Helmert–Wolf blocking (HWB) is a least squares solution method for the solution of a sparse block system of linear equations. It was first reported by F. R. Helmert for use in geodesy problems in 1880; H. Wolf (1910–1994) published his direct semianalytic solution in 1978. It is based on ordinary Gaussian elimination in matrix form or partial minimization form.
The fast Kalman filter (FKF), devised by Antti Lange (born 1941), is an extension of the Helmert–Wolf blocking (HWB) method from geodesy to safety-critical real-time applications of Kalman filtering (KF) such as GNSS navigation up to the centimeter-level of accuracy and satellite imaging of the Earth including atmospheric tomography.
This glossary of statistics and probability is a list of definitions of terms and concepts used in the mathematical sciences of statistics and probability, their sub-disciplines, and related fields. For additional related terms, see Glossary of mathematics and Glossary of experimental design.
In statistics, canonical analysis (from Ancient Greek: κανων bar, measuring rod, ruler) belongs to the family of regression methods for data analysis. Regression analysis quantifies a relationship between a predictor variable and a criterion variable by the coefficient of correlation r, coefficient of determination r2, and the standard regression coefficient β. Multiple regression analysis expresses a relationship between a set of predictor variables and a single criterion variable by the multiple correlation R, multiple coefficient of determination R2, and a set of standard partial regression weights β1, β2, etc. Canonical variate analysis captures a relationship between a set of predictor variables and a set of criterion variables by the canonical correlations ρ1, ρ2, ..., and by the sets of canonical weights C and D.
A whitening transformation or sphering transformation is a linear transformation that transforms a vector of random variables with a known covariance matrix into a set of new variables whose covariance is the identity matrix, meaning that they are uncorrelated and each have variance 1. The transformation is called "whitening" because it changes the input vector into a white noise vector.
In statistics, regression validation is the process of deciding whether the numerical results quantifying hypothesized relationships between variables, obtained from regression analysis, are acceptable as descriptions of the data. The validation process can involve analyzing the goodness of fit of the regression, analyzing whether the regression residuals are random, and checking whether the model's predictive performance deteriorates substantially when applied to data that were not used in model estimation.
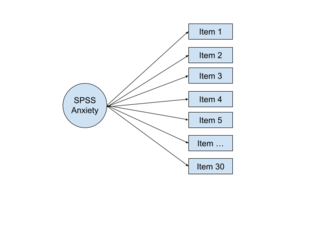
In multivariate statistics, exploratory factor analysis (EFA) is a statistical method used to uncover the underlying structure of a relatively large set of variables. EFA is a technique within factor analysis whose overarching goal is to identify the underlying relationships between measured variables. It is commonly used by researchers when developing a scale and serves to identify a set of latent constructs underlying a battery of measured variables. It should be used when the researcher has no a priori hypothesis about factors or patterns of measured variables. Measured variables are any one of several attributes of people that may be observed and measured. Examples of measured variables could be the physical height, weight, and pulse rate of a human being. Usually, researchers would have a large number of measured variables, which are assumed to be related to a smaller number of "unobserved" factors. Researchers must carefully consider the number of measured variables to include in the analysis. EFA procedures are more accurate when each factor is represented by multiple measured variables in the analysis.
In statistics, linear regression is a statistical model which estimates the linear relationship between a scalar response and one or more explanatory variables. The case of one explanatory variable is called simple linear regression; for more than one, the process is called multiple linear regression. This term is distinct from multivariate linear regression, where multiple correlated dependent variables are predicted, rather than a single scalar variable. If the explanatory variables are measured with error then errors-in-variables models are required, also known as measurement error models.
In statistics, confirmatory composite analysis (CCA) is a sub-type of structural equation modeling (SEM). Although, historically, CCA emerged from a re-orientation and re-start of partial least squares path modeling (PLS-PM), it has become an independent approach and the two should not be confused. In many ways it is similar to, but also quite distinct from confirmatory factor analysis (CFA). It shares with CFA the process of model specification, model identification, model estimation, and model assessment. However, in contrast to CFA which always assumes the existence of latent variables, in CCA all variables can be observable, with their interrelationships expressed in terms of composites, i.e., linear compounds of subsets of the variables. The composites are treated as the fundamental objects and path diagrams can be used to illustrate their relationships. This makes CCA particularly useful for disciplines examining theoretical concepts that are designed to attain certain goals, so-called artifacts, and their interplay with theoretical concepts of behavioral sciences.