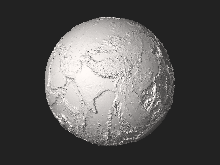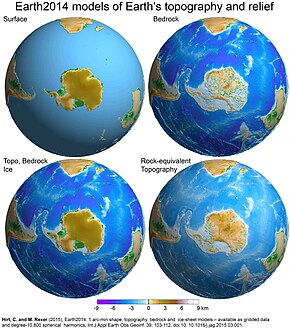
The geography of Antarctica is dominated by its south polar location and, thus, by ice. The Antarctic continent, located in the Earth's southern hemisphere, is centered asymmetrically around the South Pole and largely south of the Antarctic Circle. It is washed by the Southern Ocean or, depending on definition, the southern Pacific, Atlantic, and Indian Oceans. It has an area of more than 14 million km2. Antarctica is the largest ice desert in the world.

A digital elevation model (DEM) or digital surface model (DSM) is a 3D computer graphics representation of elevation data to represent terrain or overlaying objects, commonly of a planet, moon, or asteroid. A "global DEM" refers to a discrete global grid. DEMs are used often in geographic information systems (GIS), and are the most common basis for digitally produced relief maps. A digital terrain model (DTM) represents specifically the ground surface while DEM and DSM may represent tree top canopy or building roofs.

Topography is the study of the forms and features of land surfaces. The topography of an area may refer to the land forms and features themselves, or a description or depiction in maps.
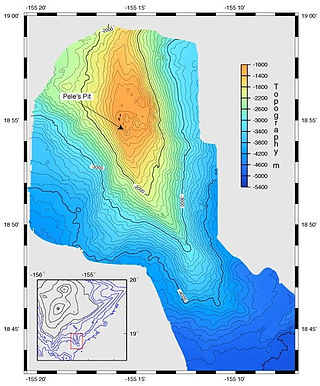
A bathymetric chart is a type of isarithmic map that depicts the submerged topography and physiographic features of ocean and sea bottoms. Their primary purpose is to provide detailed depth contours of ocean topography as well as provide the size, shape and distribution of underwater features. Topographic maps display elevation above ground and are complementary to bathymetric charts. Charts use a series of lines and points at equal intervals to showcase depth or elevation. A closed shape with increasingly smaller shapes inside of it can indicate an ocean trench or a seamount, or underwater mountain, depending on whether the depths increase or decrease going inward.

The Advanced Spaceborne Thermal Emission and Reflection Radiometer (ASTER) is a Japanese remote sensing instrument onboard the Terra satellite launched by NASA in 1999. It has been collecting data since February 2000.
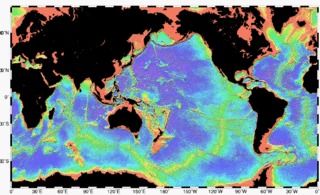
Bathymetry is the study of underwater depth of ocean floors, lake floors, or river floors. In other words, bathymetry is the underwater equivalent to hypsometry or topography. The first recorded evidence of water depth measurements are from Ancient Egypt over 3000 years ago. Bathymetric charts, are typically produced to support safety of surface or sub-surface navigation, and usually show seafloor relief or terrain as contour lines and selected depths (soundings), and typically also provide surface navigational information. Bathymetric maps may also use a Digital Terrain Model and artificial illumination techniques to illustrate the depths being portrayed. The global bathymetry is sometimes combined with topography data to yield a global relief model. Paleobathymetry is the study of past underwater depths.

NASA WorldWind is an open-source virtual globe. According to the website, "WorldWind is an open source virtual globe API. WorldWind allows developers to quickly and easily create interactive visualizations of 3D globe, map and geographical information. Organizations around the world use WorldWind to monitor weather patterns, visualize cities and terrain, track vehicle movement, analyze geospatial data and educate humanity about the Earth." It was first developed by NASA in 2003 for use on personal computers and then further developed in concert with the open source community since 2004. As of 2017, a web-based version of WorldWind is available online. An Android version is also available.

The elevation of a geographic location is its height above or below a fixed reference point, most commonly a reference geoid, a mathematical model of the Earth's sea level as an equipotential gravitational surface . The term elevation is mainly used when referring to points on the Earth's surface, while altitude or geopotential height is used for points above the surface, such as an aircraft in flight or a spacecraft in orbit, and depth is used for points below the surface.

The Shuttle Radar Topography Mission (SRTM) is an international research effort that obtained digital elevation models on a near-global scale from 56°S to 60°N, to generate the most complete high-resolution digital topographic database of Earth prior to the release of the ASTER GDEM in 2009. SRTM consisted of a specially modified radar system that flew on board the Space Shuttle Endeavour during the 11-day STS-99 mission in February 2000. The radar system was based on the older Spaceborne Imaging Radar-C/X-band Synthetic Aperture Radar (SIR-C/X-SAR), previously used on the Shuttle in 1994. To acquire topographic data, the SRTM payload was outfitted with two radar antennas. One antenna was located in the Shuttle's payload bay, the other – a critical change from the SIR-C/X-SAR, allowing single-pass interferometry – on the end of a 60-meter (200-foot) mast that extended from the payload bay once the Shuttle was in space. The technique employed is known as interferometric synthetic aperture radar. Intermap Technologies was the prime contractor for processing the interferometric synthetic aperture radar data.

An ice stream is a region of fast-moving ice within an ice sheet. It is a type of glacier, a body of ice that moves under its own weight. They can move upwards of 1,000 metres (3,300 ft) a year, and can be up to 50 kilometres (31 mi) in width, and hundreds of kilometers in length. They tend to be about 2 km (1.2 mi) deep at the thickest, and constitute the majority of the ice that leaves the sheet. In Antarctica, the ice streams account for approximately 90% of the sheet's mass loss per year, and approximately 50% of the mass loss in Greenland.
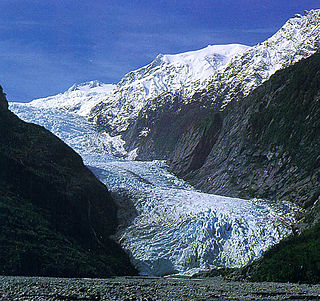
Glacier morphology, or the form a glacier takes, is influenced by temperature, precipitation, topography, and other factors. The goal of glacial morphology is to gain a better understanding of glaciated landscapes and the way they are shaped. Types of glaciers can range from massive ice sheets, such as the Greenland ice sheet, to small cirque glaciers found perched on mountain tops. Glaciers can be grouped into two main categories:
The National Elevation Dataset (NED) consists of high precision topography or ground surface elevation data for the United States. It was maintained by the USGS and all the data is in the public domain. Since the 3D Elevation Program came online, the NED was subsumed into The National Map as one of its layers of information.
The Molloy Deep is a bathymetric feature in the Fram Strait, within the Greenland Sea east of Greenland and about 160 km west of Svalbard. It is the location of the deepest point in the Arctic Ocean. The Molloy Deep, Molloy Hole, Molloy Fracture Zone, and Molloy Ridge were named after Arthur E. Molloy, a U.S. Navy research scientist who worked in the North Atlantic, North Pacific and Arctic Oceans in the 1950s-1970s.
The General Bathymetric Chart of the Oceans (GEBCO) is a publicly available bathymetric chart of the world's oceans. The project was conceived with the aim of preparing a global series of charts showing the general shape of the seafloor. Over the years it has become a reference map of the bathymetry of the world’s oceans for scientists and others.

The Charity Shoal crater is a 1.2–1.4 kilometers (0.75–0.87 mi) in diameter circular feature that lies submerged beneath the northeast end of Lake Ontario about 12 kilometers (7.5 mi) southwest of Wolfe Island, and 25 kilometers (16 mi) south of Kingston, Ontario at about latitude 44° 02′ N and longitude 76° 29′ W. It is hypothesized to be a Middle Ordovician impact crater.
Ocean general circulation models (OGCMs) are a particular kind of general circulation model to describe physical and thermodynamical processes in oceans. The oceanic general circulation is defined as the horizontal space scale and time scale larger than mesoscale. They depict oceans using a three-dimensional grid that include active thermodynamics and hence are most directly applicable to climate studies. They are the most advanced tools currently available for simulating the response of the global ocean system to increasing greenhouse gas concentrations. A hierarchy of OGCMs have been developed that include varying degrees of spatial coverage, resolution, geographical realism, process detail, etc.
Bathymetric Attributed Grid (BAG) is a file format designed to store and exchange bathymetric data.
Kirsteen Jane Tinto is a glaciologist known for her research on the behavior and subglacial geology of the Greenland and Antarctic ice sheets.
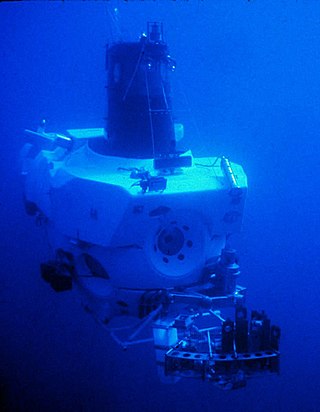
Underwater exploration is the exploration of any underwater environment, either by direct observation by the explorer, or by remote observation and measurement under the direction of the investigators. Systematic, targeted exploration is the most effective method to increase understanding of the ocean and other underwater regions, so they can be effectively managed, conserved, regulated, and their resources discovered, accessed, and used. Less than 10% of the ocean has been mapped in any detail, less has been visually observed, and the total diversity of life and distribution of populations is similarly obscure.

The International Bathymetric Chart of the Southern Ocean (IBCSO) is a regional mapping initiative of the General Bathymetric Chart of the Oceans (GEBCO). IBSCO receives support from the Nippon Foundation – GEBCO Seabed 2030 Project.

