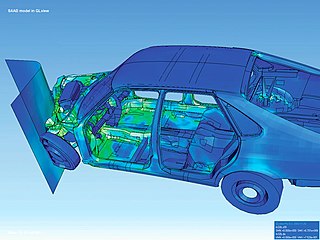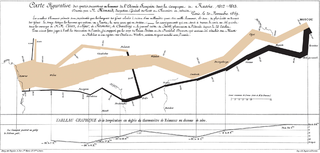
Information design is the practice of presenting information in a way that fosters an efficient and effective understanding of the information. The term has come to be used for a specific area of graphic design related to displaying information effectively, rather than just attractively or for artistic expression. Information design is closely related to the field of data visualization and is often taught as part of graphic design courses. The broad applications of information design along with its close connections to other fields of design and communication practices have created some overlap in the definitions of communication design, data visualization, and information architecture.
Graphics are visual images or designs on some surface, such as a wall, canvas, screen, paper, or stone, to inform, illustrate, or entertain. In contemporary usage, it includes a pictorial representation of data, as in design and manufacture, in typesetting and the graphic arts, and in educational and recreational software. Images that are generated by a computer are called computer graphics.

Numeracy is the ability to understand, reason with, and to apply simple numerical concepts. Basic numeracy skills consist of comprehending fundamental arithmetical operations like addition, subtraction, multiplication, and division. For example, if one can understand simple mathematical equations such as 2 + 2 = 4, then one would be considered to possess at least basic numeric knowledge. Substantial aspects of numeracy also include number sense, operation sense, computation, measurement, geometry, probability and statistics. A numerically literate person can manage and respond to the mathematical demands of life.

Visualization or visualisation is any technique for creating images, diagrams, or animations to communicate a message. Visualization through visual imagery has been an effective way to communicate both abstract and concrete ideas since the dawn of humanity. Examples from history include cave paintings, Egyptian hieroglyphs, Greek geometry, and Leonardo da Vinci's revolutionary methods of technical drawing for engineering and scientific purposes.

Infographics are graphic visual representations of information, data, or knowledge intended to present information quickly and clearly. They can improve cognition by utilizing graphics to enhance the human visual system's ability to see patterns and trends. Similar pursuits are information visualization, data visualization, statistical graphics, information design, or information architecture. Infographics have evolved in recent years to be for mass communication, and thus are designed with fewer assumptions about the readers' knowledge base than other types of visualizations. Isotypes are an early example of infographics conveying information quickly and easily to the masses.

Visual literacy is the ability to interpret, negotiate, and make meaning from information presented in the form of an image, extending the meaning of literacy, which commonly signifies interpretation of a written or printed text. Visual literacy is based on the idea that pictures can be "read" and that meaning can be through a process of reading.

Reading comprehension is the ability to process text, understand its meaning, and to integrate with what the reader already knows. Fundamental skills required in efficient reading comprehension are knowing meaning of words, ability to understand meaning of a word from discourse context, ability to follow organization of passage and to identify antecedents and references in it, ability to draw inferences from a passage about its contents, ability to identify the main thought of a passage, ability to answer questions answered in a passage, ability to recognize the literary devices or propositional structures used in a passage and determine its tone, to understand the situational mood conveyed for assertions, questioning, commanding, refraining etc. and finally ability to determine writer's purpose, intent and point of view, and draw inferences about the writer (discourse-semantics).
Geovisualization or geovisualisation, also known as cartographic visualization, refers to a set of tools and techniques supporting the analysis of geospatial data through the use of interactive visualization.
Educational animations are animations produced for the specific purpose of fostering learning. It is associated with educational technology with the way it supports teaching and learning through the use of technological tools to facilitate learning and to improve performance.

The visual language is a system of communication using visual elements. Speech as a means of communication cannot strictly be separated from the whole of human communicative activity which includes the visual and the term 'language' in relation to vision is an extension of its use to describe the perception, comprehension and production of visible signs.

Graphic communication as the name suggests is communication using graphic elements. These elements include symbols such as glyphs and icons, images such as drawings and photographs, and can include the passive contributions of substrate, colour and surroundings. It is the process of creating, producing, and distributing material incorporating words and images to convey data, concepts, and emotions.
Alice Mary Coleman is emerita professor of geography at King's College London. She is noted for directing the 1960s Second Land Use Survey of Britain and for analyses of land use planning and urban design which have influenced the design of residential developments since the 1980s.

Reading is the process of taking in the sense or meaning of letters, symbols, etc., especially by sight or touch.
The social sciences are the sciences concerned with societies, human behaviour, and social relationships.
Multimodality is the application of multiple literacies within one medium. For example, understanding a televised weather forecast (medium) involves understanding spoken language, written language, weather specific language, geography, and symbols. Multiple literacies or "modes" contribute to an audience's understanding of a composition. Everything from the placement of images to the organization of the content to the method of delivery creates meaning. This is the result of a shift from isolated text being relied on as the primary source of communication, to the image being utilized more frequently in the digital age. Multimodality describes communication practices in terms of the textual, aural, linguistic, spatial, and visual resources used to compose messages.
Professor Tom Lowrie was appointed a Centenary Professor at the University of Canberra, Australia, in 2014. He has an established international research profile in the discipline area of STEM education and mathematics education.
The Programme for the International Assessment of Adult Competencies (PIAAC) is a worldwide study by the Organisation for Economic Co-operation and Development (OECD) in 24 countries of cognitive and workplace skills. The main aim is to be able to assess the skills of literacy, numeracy and problem solving in technology-rich environments, and use the collected information to help countries develop ways to further improve these skills. The focus is on the working-age population. The first data was released on October 8, 2013. A new PIAAC survey is expected to be published in 2021/2022.
Graph literacy is the ability to understand information that presented graphically, which are including general knowledge about how to extract information and make inferences from different graphical formats. Although related, graph literacy is distinct from other forms of literacy in the sense that it relates more specifically to one's ability to obtain meaning from information presented graphically. It can include the storage of mental representations in long-term memory, knowledge about the properties of different types of formats, and procedures to interpret them. However, similar to other types of literacy, higher graph literacy is associated with higher education levels and suggests that developing the skills required to interpret graphical information requires knowledge that is acquired through formal education and experience.
Education graphics, or edugraphics, are graphic visual representations of educational information intended to simplify social-cultural content, communication-related content, linguistic content, etc. The use of rich visual content improves cognition, as the students comprehension is enhanced when both visual and text-based cues are combined.
William George Victor Balchin was a British geographer. He was noted for original research in geology and significant contributions to geography, and for establishing the academic concept of graphicacy.


