The Human Footprint is an ecological footprint map of human influence on the terrestrial systems of the Earth. It was first published in a 2002 article in the journal BioScience by Eric W. Sanderson, Malanding Jaiteh, Marc A. Levy, Kent H. Redford, Antoinette V. Wannebo, and Gillian Woolmer.[2] A map of human influence became possible with the advent of high-resolution satellite imagery in the 1990s.[3]
The map is made to a resolution of 1km2 (0.39sqmi) and is an aggregate of eight factors: major roadways, navigable waterways, railways, crop lands, pasture lands, the built environment, light pollution, and human population density.[4] In order to compare the effect of influence from different factors, the magnitude of influence for each factor was ranked on a scale of 0–10. These eight factors measure four types of data, which are cumulatively used as a measure of human influence: population density, land transformation, accessibility, and electrical power infrastructure.[2] The first Human Footprint map was published in 2002 with data that had been collected in the early 1990s, approximately 1993. In 2016, an updated map was published using the same methodology, using data from 2009.[5]
Due to incomplete satellite imagery, the original Human Footprint map did not include Antarctica nor some of the Small Island Developing States of the Pacific Ocean. Marine and freshwater systems are excluded, as different factors would be necessary to map human influence.[2]
Other Human Footprint
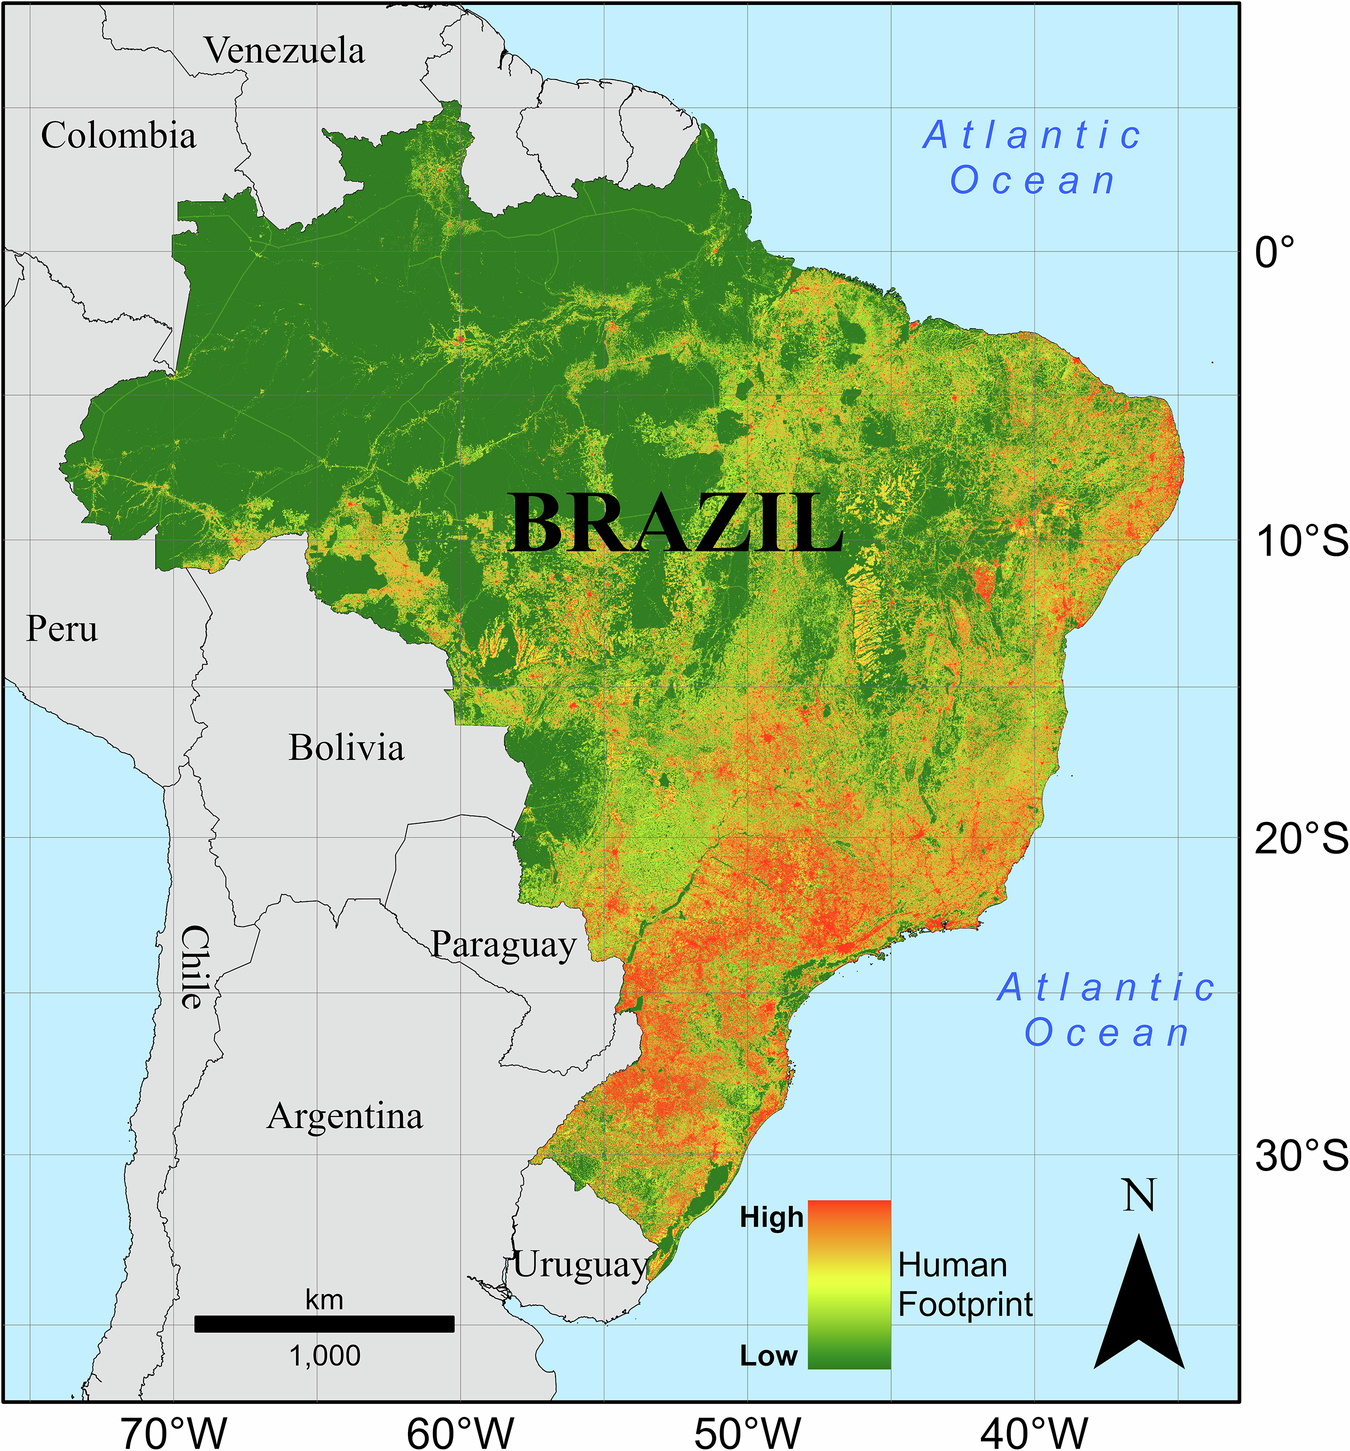
The original human footprint was conducted at 1km2 (0.39sqmi), which is considered too coarse to monitor the impact of human activities at the operational scale for many species with small home ranges. To allow human footprint maps to account for extremely localized interactions, human footprint indices now exist at resolutions as high as 10m2 (110sqft) in countries such as Brazil [6]. Such a resolution allows for assessing the impact of human impacts on the environment for species with limited home ranges and operating in highly localized environments.
Change over time
The Human Footprint increased by 9% from 1993 to 2009, at least partly attributable to a human population increase of 23% and a global economy increase of 153% during the same period.[4] Though population and economic growth far exceed the growth of the Human Footprint, the areas that saw increased human influence were those with the highest biodiversity.[5]
See also
Carbon footprint: the total greenhouse gas (GHG) emissions caused by an individual, event, organization, service, or product, expressed as carbon dioxide equivalent
Last of the Wild: a complementary global map produced in the same 2002 study that shows the wildest remaining areas of each biome
This page is based on this Wikipedia article Text is available under the CC BY-SA 4.0 license; additional terms may apply. Images, videos and audio are available under their respective licenses.