Related Research Articles

In statistics, correlation or dependence is any statistical relationship, whether causal or not, between two random variables or bivariate data. Although in the broadest sense, "correlation" may indicate any type of association, in statistics it usually refers to the degree to which a pair of variables are linearly related. Familiar examples of dependent phenomena include the correlation between the height of parents and their offspring, and the correlation between the price of a good and the quantity the consumers are willing to purchase, as it is depicted in the so-called demand curve.

A prediction, or forecast, is a statement about a future event or data. They are often, but not always, based upon experience or knowledge. There is no universal agreement about the exact difference from "estimation"; different authors and disciplines ascribe different connotations.
Forecasting is the process of making predictions based on past and present data. Later these can be compared (resolved) against what happens. For example, a company might estimate their revenue in the next year, then compare it against the actual results. Prediction is a similar, but more general term. Forecasting might refer to specific formal statistical methods employing time series, cross-sectional or longitudinal data, or alternatively to less formal judgmental methods or the process of prediction and resolution itself. Usage can differ between areas of application: for example, in hydrology the terms "forecast" and "forecasting" are sometimes reserved for estimates of values at certain specific future times, while the term "prediction" is used for more general estimates, such as the number of times floods will occur over a long period.

In mathematics, a time series is a series of data points indexed in time order. Most commonly, a time series is a sequence taken at successive equally spaced points in time. Thus it is a sequence of discrete-time data. Examples of time series are heights of ocean tides, counts of sunspots, and the daily closing value of the Dow Jones Industrial Average.
In the field of machine learning and specifically the problem of statistical classification, a confusion matrix, also known as an error matrix, is a specific table layout that allows visualization of the performance of an algorithm, typically a supervised learning one. Each row of the matrix represents the instances in an actual class while each column represents the instances in a predicted class, or vice versa – both variants are found in the literature. The name stems from the fact that it makes it easy to see whether the system is confusing two classes.
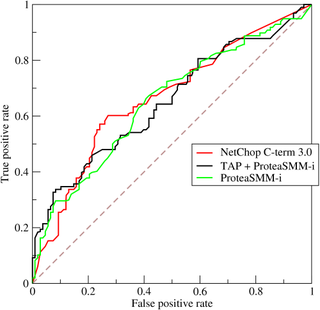
A receiver operating characteristic curve, or ROC curve, is a graphical plot that illustrates the diagnostic ability of a binary classifier system as its discrimination threshold is varied. The method was originally developed for operators of military radar receivers starting in 1941, which led to its name.
In statistics, the coefficient of multiple correlation is a measure of how well a given variable can be predicted using a linear function of a set of other variables. It is the correlation between the variable's values and the best predictions that can be computed linearly from the predictive variables.

In statistics, the coefficient of determination, denoted R2 or r2 and pronounced "R squared", is the proportion of the variation in the dependent variable that is predictable from the independent variable(s).
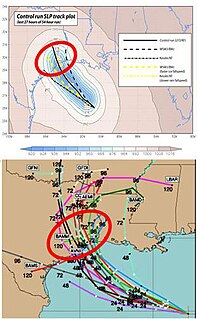
Ensemble forecasting is a method used in or within numerical weather prediction. Instead of making a single forecast of the most likely weather, a set of forecasts is produced. This set of forecasts aims to give an indication of the range of possible future states of the atmosphere. Ensemble forecasting is a form of Monte Carlo analysis. The multiple simulations are conducted to account for the two usual sources of uncertainty in forecast models: (1) the errors introduced by the use of imperfect initial conditions, amplified by the chaotic nature of the evolution equations of the atmosphere, which is often referred to as sensitive dependence on initial conditions; and (2) errors introduced because of imperfections in the model formulation, such as the approximate mathematical methods to solve the equations. Ideally, the verified future atmospheric state should fall within the predicted ensemble spread, and the amount of spread should be related to the uncertainty (error) of the forecast. In general, this approach can be used to make probabilistic forecasts of any dynamical system, and not just for weather prediction.
The Brier Score is a strictly proper score function or strictly proper scoring rule that measures the accuracy of probabilistic predictions. For unidimensional predictions, it is strictly equivalent to the mean squared error as applied to predicted probabilities.
In statistics, a forecast error is the difference between the actual or real and the predicted or forecast value of a time series or any other phenomenon of interest. Since the forecast error is derived from the same scale of data, comparisons between the forecast errors of different series can only be made when the series are on the same scale.
Stock market prediction is the act of trying to determine the future value of a company stock or other financial instrument traded on an exchange. The successful prediction of a stock's future price could yield significant profit. The efficient-market hypothesis suggests that stock prices reflect all currently available information and any price changes that are not based on newly revealed information thus are inherently unpredictable. Others disagree and those with this viewpoint possess myriad methods and technologies which purportedly allow them to gain future price information.
The root-mean-square deviation (RMSD) or root-mean-square error (RMSE) is a frequently used measure of the differences between values predicted by a model or an estimator and the values observed. The RMSD represents the square root of the second sample moment of the differences between predicted values and observed values or the quadratic mean of these differences. These deviations are called residuals when the calculations are performed over the data sample that was used for estimation and are called errors when computed out-of-sample. The RMSD serves to aggregate the magnitudes of the errors in predictions for various data points into a single measure of predictive power. RMSD is a measure of accuracy, to compare forecasting errors of different models for a particular dataset and not between datasets, as it is scale-dependent.

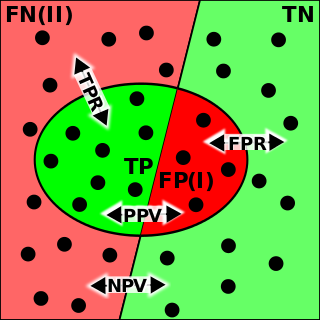
In pattern recognition, information retrieval, object detection and classification, precision and recall are performance metrics that apply to data retrieved from a collection, corpus or sample space.
In statistics, regression validation is the process of deciding whether the numerical results quantifying hypothesized relationships between variables, obtained from regression analysis, are acceptable as descriptions of the data. The validation process can involve analyzing the goodness of fit of the regression, analyzing whether the regression residuals are random, and checking whether the model's predictive performance deteriorates substantially when applied to data that were not used in model estimation.
Demand forecasting is known as the process of making future estimations in relation to customer demand over a specific period. Generally, demand forecasting will consider historical data and other analytical information to produce the most accurate predictions. More specifically, the methods of demand forecasting entails using predictive analytics of historical data to understand and predict customer demand in order to understand key economic conditions and assist in making crucial supply decisions to optimise business profitability. Demand forecasting methods are divided into two major categories, qualitative and quantitative methods. Qualitative methods are based on expert opinion and information gathered from the field. It is mostly used in situations when there is minimal data available to analyse. For example, when a business or product is newly being introduced to the market. Quantitative methods however, use data, and analytical tools in order to create predictions. Demand forecasting may be used in production planning, inventory management, and at times in assessing future capacity requirements, or in making decisions on whether to enter a new market.
In the fields of forecasting and prediction, forecast skill or prediction skill is any measure of the accuracy and/or degree of association of prediction to an observation or estimate of the actual value of what is being predicted ; it may be quantified as a skill score.
In statistics, the phi coefficient is a measure of association for two binary variables. In machine learning, it is known as the Matthews correlation coefficient (MCC) and used as a measure of the quality of binary (two-class) classifications, introduced by biochemist Brian W. Matthews in 1975. Introduced by Karl Pearson, and also known as the Yule phi coefficient from its introduction by Udny Yule in 1912 this measure is similar to the Pearson correlation coefficient in its interpretation. In fact, a Pearson correlation coefficient estimated for two binary variables will return the phi coefficient. Two binary variables are considered positively associated if most of the data falls along the diagonal cells. In contrast, two binary variables are considered negatively associated if most of the data falls off the diagonal. If we have a 2×2 table for two random variables x and y
The evaluation of binary classifiers compares two methods of assigning a binary attribute, one of which is usually a standard method and the other is being investigated. There are many metrics that can be used to measure the performance of a classifier or predictor; different fields have different preferences for specific metrics due to different goals. For example, in medicine sensitivity and specificity are often used, while in computer science precision and recall are preferred. An important distinction is between metrics that are independent on the prevalence, and metrics that depend on the prevalence – both types are useful, but they have very different properties.
In statistics, linear regression is a linear approach for modelling the relationship between a scalar response and one or more explanatory variables. The case of one explanatory variable is called simple linear regression; for more than one, the process is called multiple linear regression. This term is distinct from multivariate linear regression, where multiple correlated dependent variables are predicted, rather than a single scalar variable.
References
- 1 2 "Information Coefficient – IC". Investopedia. Retrieved August 3, 2012.
- ↑ Dan diBartolomeo (2008). "Measuring Investment Skill Using The Effective Information Coefficient" (pdf). Journal of Performance Measurement. Retrieved August 3, 2012.
| | This finance-related article is a stub. You can help Wikipedia by expanding it. |