Related Research Articles

In descriptive statistics, summary statistics are used to summarize a set of observations, in order to communicate the largest amount of information as simply as possible. Statisticians commonly try to describe the observations in
Heritability is a statistic used in the fields of breeding and genetics that estimates the degree of variation in a phenotypic trait in a population that is due to genetic variation between individuals in that population. The concept of heritability can be expressed in the form of the following question: "What is the proportion of the variation in a given trait within a population that is not explained by the environment or random chance?"

In statistics, correlation or dependence is any statistical relationship, whether causal or not, between two random variables or bivariate data. Although in the broadest sense, "correlation" may indicate any type of association, in statistics it usually refers to the degree to which a pair of variables are linearly related. Familiar examples of dependent phenomena include the correlation between the height of parents and their offspring, and the correlation between the price of a good and the quantity the consumers are willing to purchase, as it is depicted in the so-called demand curve.

In statistics, the standard score is the number of standard deviations by which the value of a raw score is above or below the mean value of what is being observed or measured. Raw scores above the mean have positive standard scores, while those below the mean have negative standard scores.
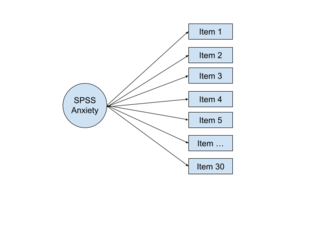
Factor analysis is a statistical method used to describe variability among observed, correlated variables in terms of a potentially lower number of unobserved variables called factors. For example, it is possible that variations in six observed variables mainly reflect the variations in two unobserved (underlying) variables. Factor analysis searches for such joint variations in response to unobserved latent variables. The observed variables are modelled as linear combinations of the potential factors plus "error" terms, hence factor analysis can be thought of as a special case of errors-in-variables models.
The g factor is a construct developed in psychometric investigations of cognitive abilities and human intelligence. It is a variable that summarizes positive correlations among different cognitive tasks, reflecting the fact that an individual's performance on one type of cognitive task tends to be comparable to that person's performance on other kinds of cognitive tasks. The g factor typically accounts for 40 to 50 percent of the between-individual performance differences on a given cognitive test, and composite scores based on many tests are frequently regarded as estimates of individuals' standing on the g factor. The terms IQ, general intelligence, general cognitive ability, general mental ability, and simply intelligence are often used interchangeably to refer to this common core shared by cognitive tests. However, the g factor itself is merely a mathematical construct indicating the level of observed correlation between cognitive tasks. The measured value of this construct depends on the cognitive tasks that are used, and little is known about the underlying causes of the observed correlations.
In statistics, an effect size is a value measuring the strength of the relationship between two variables in a population, or a sample-based estimate of that quantity. It can refer to the value of a statistic calculated from a sample of data, the value of a parameter for a hypothetical population, or to the equation that operationalizes how statistics or parameters lead to the effect size value. Examples of effect sizes include the correlation between two variables, the regression coefficient in a regression, the mean difference, or the risk of a particular event happening. Effect sizes complement statistical hypothesis testing, and play an important role in power analyses, sample size planning, and in meta-analyses. The cluster of data-analysis methods concerning effect sizes is referred to as estimation statistics.
In statistics and research, internal consistency is typically a measure based on the correlations between different items on the same test. It measures whether several items that propose to measure the same general construct produce similar scores. For example, if a respondent expressed agreement with the statements "I like to ride bicycles" and "I've enjoyed riding bicycles in the past", and disagreement with the statement "I hate bicycles", this would be indicative of good internal consistency of the test.
Cohen's kappa coefficient is a statistic that is used to measure inter-rater reliability for qualitative (categorical) items. It is generally thought to be a more robust measure than simple percent agreement calculation, as κ takes into account the possibility of the agreement occurring by chance. There is controversy surrounding Cohen's kappa due to the difficulty in interpreting indices of agreement. Some researchers have suggested that it is conceptually simpler to evaluate disagreement between items.
The point biserial correlation coefficient (rpb) is a correlation coefficient used when one variable is dichotomous; Y can either be "naturally" dichotomous, like whether a coin lands heads or tails, or an artificially dichotomized variable. In most situations it is not advisable to dichotomize variables artificially. When a new variable is artificially dichotomized the new dichotomous variable may be conceptualized as having an underlying continuity. If this is the case, a biserial correlation would be the more appropriate calculation.
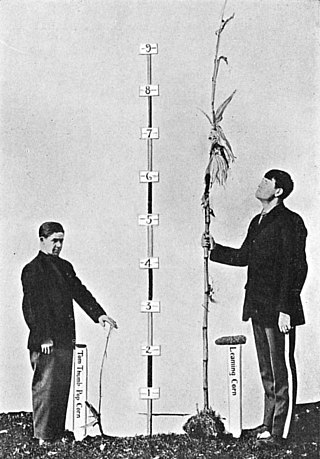
The study of height and intelligence examines correlations between height and human intelligence. Some epidemiological research on the subject has shown that there is a small but statistically significant positive correlation between height and intelligence after controlling for socioeconomic class and parental education. The cited study, however, does not draw any conclusions about height and intelligence, but rather suggests "a continuing effect of post-natal growth on childhood cognition beyond the age of 9 years." This correlation arises in both the developed and developing world and persists across age groups. An individual’s taller stature has been attributed to higher economic status, which often translates to a higher quality of nutrition. This correlation, however, can be inverted to characterize one’s socioeconomic status as a consequence of stature, where shorter stature can attract discrimination that affects many factors, among them employment, and treatment by educators. One such theory argues that since height strongly correlates with white and gray matter volume, it may act as a biomarker for cerebral development which itself mediates intelligence. Competing explanations include that certain genetic factors may influence both height and intelligence, or that both height and intelligence may be affected in similar ways by adverse environmental exposures during development. Measurements of the total surface area and mean thickness of the cortical grey matter using a magnetic resonance imaging (MRI) revealed that the height of individuals had a positive correlation with the total cortical surface area. This supports the idea that genes that influence height also influence total surface area of the brain, which in turn influences intelligence, resulting in the correlation. Other explanations further qualify the positive correlation between height and intelligence, suggesting that because the correlation becomes weaker with higher socioeconomic class and education level, environmental factors could partially override any genetic factors affecting both characteristics.
In statistics, standardized (regression) coefficients, also called beta coefficients or beta weights, are the estimates resulting from a regression analysis where the underlying data have been standardized so that the variances of dependent and independent variables are equal to 1. Therefore, standardized coefficients are unitless and refer to how many standard deviations a dependent variable will change, per standard deviation increase in the predictor variable.
In statistics, inter-rater reliability is the degree of agreement among independent observers who rate, code, or assess the same phenomenon.
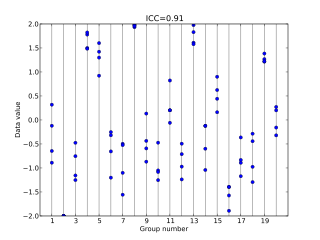
In statistics, the intraclass correlation, or the intraclass correlation coefficient (ICC), is a descriptive statistic that can be used when quantitative measurements are made on units that are organized into groups. It describes how strongly units in the same group resemble each other. While it is viewed as a type of correlation, unlike most other correlation measures it operates on data structured as groups, rather than data structured as paired observations.
In statistics, the concordance correlation coefficient measures the agreement between two variables, e.g., to evaluate reproducibility or for inter-rater reliability.
In statistics and regression analysis, moderation occurs when the relationship between two variables depends on a third variable. The third variable is referred to as the moderator variable or simply the moderator. The effect of a moderating variable is characterized statistically as an interaction; that is, a categorical or continuous variable that is associated with the direction and/or magnitude of the relation between dependent and independent variables. Specifically within a correlational analysis framework, a moderator is a third variable that affects the zero-order correlation between two other variables, or the value of the slope of the dependent variable on the independent variable. In analysis of variance (ANOVA) terms, a basic moderator effect can be represented as an interaction between a focal independent variable and a factor that specifies the appropriate conditions for its operation.
In multivariate statistics, exploratory factor analysis (EFA) is a statistical method used to uncover the underlying structure of a relatively large set of variables. EFA is a technique within factor analysis whose overarching goal is to identify the underlying relationships between measured variables. It is commonly used by researchers when developing a scale and serves to identify a set of latent constructs underlying a battery of measured variables. It should be used when the researcher has no a priori hypothesis about factors or patterns of measured variables. Measured variables are any one of several attributes of people that may be observed and measured. Examples of measured variables could be the physical height, weight, and pulse rate of a human being. Usually, researchers would have a large number of measured variables, which are assumed to be related to a smaller number of "unobserved" factors. Researchers must carefully consider the number of measured variables to include in the analysis. EFA procedures are more accurate when each factor is represented by multiple measured variables in the analysis.
A correlation coefficient is a numerical measure of some type of correlation, meaning a statistical relationship between two variables. The variables may be two columns of a given data set of observations, often called a sample, or two components of a multivariate random variable with a known distribution.
Daniel John Bauer is an American statistician, professor, and director of the quantitative psychology program at the University of North Carolina, where he is also on the faculty at the Center for Developmental Science. He is known for rigorous methodological work on latent variable models and is a proponent of integrative data analysis, a meta-analytic technique that pools raw data across multiple independent studies.
In statistics, confirmatory composite analysis (CCA) is a sub-type of structural equation modeling (SEM). Although, historically, CCA emerged from a re-orientation and re-start of partial least squares path modeling (PLS-PM), it has become an independent approach and the two should not be confused. In many ways it is similar to, but also quite distinct from confirmatory factor analysis (CFA). It shares with CFA the process of model specification, model identification, model estimation, and model assessment. However, in contrast to CFA which always assumes the existence of latent variables, in CCA all variables can be observable, with their interrelationships expressed in terms of composites, i.e., linear compounds of subsets of the variables. The composites are treated as the fundamental objects and path diagrams can be used to illustrate their relationships. This makes CCA particularly useful for disciplines examining theoretical concepts that are designed to attain certain goals, so-called artifacts, and their interplay with theoretical concepts of behavioral sciences.
References
- Kenneth O. McGraw & S. P. Wong (1996). "Forming inferences about some intraclass correlation coefficients" (PDF). Psychological Methods . 1 (1): 30–46. doi:10.1037/1082-989X.1.1.30. There are several errors in the article:
- Kenneth O. McGraw & S. P. Wong (1996). "Correction to McGraw and Wong (1996)". Psychological Methods . 1: 390. doi:10.1037/1082-989x.1.4.390.