Related Research Articles
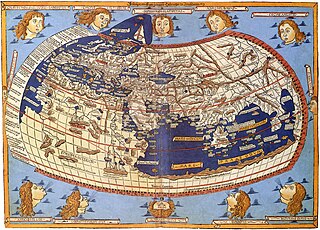
Cartography is the study and practice of making and using maps. Combining science, aesthetics and technique, cartography builds on the premise that reality can be modeled in ways that communicate spatial information effectively.
In cartography, a map projection is any of a broad set of transformations employed to represent the curved two-dimensional surface of a globe on a plane. In a map projection, coordinates, often expressed as latitude and longitude, of locations from the surface of the globe are transformed to coordinates on a plane. Projection is a necessary step in creating a two-dimensional map and is one of the essential elements of cartography.

Technical drawing, drafting or drawing, is the act and discipline of composing drawings that visually communicate how something functions or is constructed.

Stereoscopy is a technique for creating or enhancing the illusion of depth in an image by means of stereopsis for binocular vision. The word stereoscopy derives from Greek στερεός (stereos) 'firm, solid' and σκοπέω (skopeō) 'to look, to see'. Any stereoscopic image is called a stereogram. Originally, stereogram referred to a pair of stereo images which could be viewed using a stereoscope.

A voxel is a three-dimensional counterpart to a pixel. It represents a value on a regular grid in a three-dimensional space. Voxels are frequently used in the visualization and analysis of medical and scientific data. They are also commonly used in video games, both as a technological feature, as in Outcast, and a graphical style, which was popularised by Minecraft.

Axonometric projection is a type of orthographic projection used for creating a pictorial drawing of an object, where the object is rotated around one or more of its axes to reveal multiple sides.

Scientific visualization is an interdisciplinary branch of science concerned with the visualization of scientific phenomena. It is also considered a subset of computer graphics, a branch of computer science. The purpose of scientific visualization is to graphically illustrate scientific data to enable scientists to understand, illustrate, and glean insight from their data. Research into how people read and misread various types of visualizations is helping to determine what types and features of visualizations are most understandable and effective in conveying information.
2.5D perspective refers to gameplay or movement in a video game or virtual reality environment that is restricted to a two-dimensional (2D) plane with little to no access to a third dimension in a space that otherwise appears to be three-dimensional and is often simulated and rendered in a 3D digital environment.

In scientific visualization and computer graphics, volume rendering is a set of techniques used to display a 2D projection of a 3D discretely sampled data set, typically a 3D scalar field.
In three-dimensional geometry, a parallel projection is a projection of an object in three-dimensional space onto a fixed plane, known as the projection plane or image plane, where the rays, known as lines of sight or projection lines, are parallel to each other. It is a basic tool in descriptive geometry. The projection is called orthographic if the rays are perpendicular (orthogonal) to the image plane, and oblique or skew if they are not.

Data and information visualization is the practice of designing and creating easy-to-communicate and easy-to-understand graphic or visual representations of a large amount of complex quantitative and qualitative data and information with the help of static, dynamic or interactive visual items. Typically based on data and information collected from a certain domain of expertise, these visualizations are intended for a broader audience to help them visually explore and discover, quickly understand, interpret and gain important insights into otherwise difficult-to-identify structures, relationships, correlations, local and global patterns, trends, variations, constancy, clusters, outliers and unusual groupings within data. When intended for the general public to convey a concise version of known, specific information in a clear and engaging manner, it is typically called information graphics.

A heat map is a 2-dimensional data visualization technique that represents the magnitude of individual values within a dataset as a color. The variation in color may be by hue or intensity.

Terrain cartography or relief mapping is the depiction of the shape of the surface of the Earth on a map, using one or more of several techniques that have been developed. Terrain or relief is an essential aspect of physical geography, and as such its portrayal presents a central problem in cartographic design, and more recently geographic information systems and geovisualization.
Phantograms, also known as Phantaglyphs, Op-Ups, free-standing anaglyphs, levitated images, and book anaglyphs, are a form of optical illusion. Phantograms use perspectival anamorphosis to produce a 2D image that is distorted in a particular way so as to appear, to a viewer at a particular vantage point, three-dimensional, standing above or recessed into a flat surface. The illusion of depth and perspective is heightened by stereoscopy techniques; a combination of two images, most typically but not necessarily an anaglyph. With common (red–cyan) 3D glasses, the viewer's vision is segregated so that each eye sees a different image.
Specialized wind energy software applications aid in the development and operation of wind farms.

Computer graphics deals with generating images and art with the aid of computers. Computer graphics is a core technology in digital photography, film, video games, digital art, cell phone and computer displays, and many specialized applications. A great deal of specialized hardware and software has been developed, with the displays of most devices being driven by computer graphics hardware. It is a vast and recently developed area of computer science. The phrase was coined in 1960 by computer graphics researchers Verne Hudson and William Fetter of Boeing. It is often abbreviated as CG, or typically in the context of film as computer generated imagery (CGI). The non-artistic aspects of computer graphics are the subject of computer science research.

Martin M. Wattenberg is an American scientist and artist known for his work with data visualization. He is currently the Gordon McKay Professor of Computer Science at the Harvard University School of Engineering and Applied Sciences.
Brian A McClendon is an American software executive, engineer, and inventor. He was a co-founder and angel investor in Keyhole, Inc., a geospatial data visualization company that was purchased by Google in 2004 to produce Google Earth. Keyhole itself was spun off from another company called Intrinsic Graphics, of which McClendon was also a co-founder. McClendon was elected a member of the National Academy of Engineering in 2015 for strategic, technical, and managerial leadership resulting in widespread accurate and useful geographic information.
James Hoffman is a software engineer and inventor who has worked in scientific visualization and was instrumental in producing the first visualization of Costa's minimal surface. His scientific visualizations have been published in Scientific American and Nature, among other journals. Most recently, Hoffman has been involved in the solar start-up company Sun Synchrony, which is developing his solar inventions.
4DMedical is a medical technology company, based in Australia and the United States.
References
- ↑ U.S. Patent No. 6,489,962, "Analglyphic representations of image and elevation data," issued December 3, 2002.
- ↑ "Reviews". Discover Magazine. April 2000. Retrieved 2009-09-09.
- ↑ "Briefly Noted". The New Yorker. 2000-01-17. p. 83. Retrieved 2009-09-09.
- ↑ "Peabody Museum's 'Martian Perspectives' exhibit offers 3-D views of the 'Red Planet'". Yale Bulletin and Calendar . 28 (17). 2001-01-21. Archived from the original on 2009-04-18. Retrieved 2009-09-09.
| International | |
|---|---|
| National | |