Systematic representation of the surface of a sphere or ellipsoid onto a plane
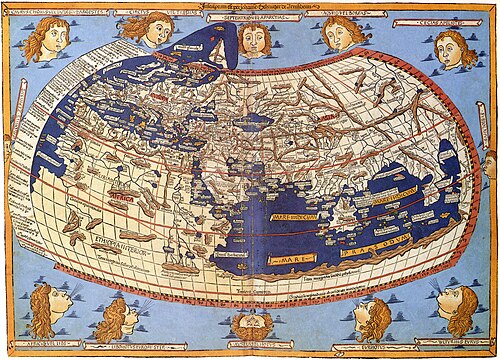
A medieval depiction of the Ecumene (1482, Johannes Schnitzer, engraver), constructed after the coordinates in Ptolemy's Geography and using his second map projection
In cartography, a map projection is any of a broad set of transformations employed to represent the curved two-dimensional surface of a globe on a plane.[1][2][3] In a map projection, coordinates, often expressed as latitude and longitude, of locations from the surface of the globe are transformed to coordinates on a plane.[4][5] Projection is a necessary step in creating a two-dimensional map and is one of the essential elements of cartography.
All projections of a sphere on a plane necessarily distort the surface in some way.[6] Depending on the purpose of the map, some distortions are acceptable and others are not; therefore, different map projections exist in order to preserve some properties of the sphere-like body at the expense of other properties. The study of map projections is primarily about the characterization of their distortions. There is no limit to the number of possible map projections.[7]:1 More generally, projections are considered in several fields of pure mathematics, including differential geometry, projective geometry, and manifolds. However, the term "map projection" refers specifically to a cartographic projection.
Despite the name's literal meaning, projection is not limited to perspective projections, such as those resulting from casting a shadow on a screen, or the rectilinear image produced by a pinhole camera on a flat film plate. Rather, any mathematical function that transforms coordinates from the curved surface distinctly and smoothly to the plane is a projection. Few projections in practical use are perspective.[citation needed]
Most of this article assumes that the surface to be mapped is that of a sphere. The Earth and other large celestial bodies are generally better modeled as oblate spheroids, whereas small objects such as asteroids often have irregular shapes. The surfaces of planetary bodies can be mapped even if they are too irregular to be modeled well with a sphere or ellipsoid.[8]
Map projections can be constructed to preserve some of these properties at the expense of others. Because the Earth's curved surface is not isometric to a plane, preservation of shapes inevitably requires a variable scale and, consequently, non-proportional presentation of areas. Similarly, an area-preserving projection can not be conformal, resulting in shapes and bearings distorted in most places of the map. Each projection preserves, compromises, or approximates basic metric properties in different ways. The purpose of the map determines which projection should form the base for the map. Because maps have many different purposes, a diversity of projections have been created to suit those purposes.
Another consideration in the configuration of a projection is its compatibility with data sets to be used on the map. Data sets are geographic information; their collection depends on the chosen datum (model) of the Earth. Different datums assign slightly different coordinates to the same location, so in large scale maps, such as those from national mapping systems, it is important to match the datum to the projection. The slight differences in coordinate assignation between different datums is not a concern for world maps or those of large regions, where such differences are reduced to imperceptibility.
Carl Friedrich Gauss's Theorema Egregium proved that a sphere's surface cannot be represented on a plane without distortion. The same applies to other reference surfaces used as models for the Earth, such as oblate spheroids, ellipsoids, and geoids. Since any map projection is a representation of one of those surfaces on a plane, all map projections distort.[5]
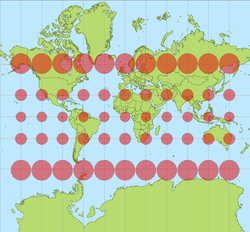
The classical way of showing the distortion inherent in a projection is to use Tissot's indicatrix. For a given point, using the scale factor h along the meridian, the scale factor k along the parallel, and the angle θ′ between them, Nicolas Tissot described how to construct an ellipse that illustrates the amount and orientation of the components of distortion.[7]:147–149[10]:24 By spacing the ellipses regularly along the meridians and parallels, the network of indicatrices shows how distortion varies across the map.
Other distortion metrics
Many other ways have been described of showing the distortion in projections.[11][12] Like Tissot's indicatrix, the Goldberg-Gott indicatrix is based on infinitesimals, and depicts flexion and skewness (bending and lopsidedness) distortions.[13]
Rather than the original (enlarged) infinitesimal circle as in Tissot's indicatrix, some visual methods project finite shapes that span a part of the map. For example, a small circle of fixed radius (e.g., 15 degrees angular radius).[14] Sometimes spherical triangles are used.[citation needed] In the first half of the 20th century, projecting a human head onto different projections was common to show how distortion varies across one projection as compared to another.[15] In dynamic media, shapes of familiar coastlines and boundaries can be dragged across an interactive map to show how the projection distorts sizes and shapes according to position on the map.[16]
Another way to visualize local distortion is through grayscale or color gradations whose shade represents the magnitude of the angular deformation or areal inflation. Sometimes both are shown simultaneously by blending two colors to create a bivariate map.[17]
To measure distortion globally across areas instead of at just a single point necessarily involves choosing priorities to reach a compromise. Some schemes use distance distortion as a proxy for the combination of angular deformation and areal inflation; such methods arbitrarily choose what paths to measure and how to weight them in order to yield a single result. Many have been described.[13][18][19][20][21]
Design and construction
The creation of a map projection involves two steps:
Selection of a model for the shape of the Earth or planetary body (usually choosing between a sphere or ellipsoid). Because the Earth's actual shape is irregular, information is lost in this step.
Transformation of geographic coordinates (longitude and latitude) to Cartesian (x,y) or polar (r, θ) plane coordinates. In large-scale maps, Cartesian coordinates normally have a simple relation to eastings and northings defined as a grid superimposed on the projection. In small-scale maps, eastings and northings are not meaningful, and grids are not superimposed.
Some of the simplest map projections are literal projections, as obtained by placing a light source at some definite point relative to the globe and projecting its features onto a specified surface. Although most projections are not defined in this way, picturing the light source-globe model can be helpful in understanding the basic concept of a map projection.
A surface that can be unfolded or unrolled into a plane or sheet without stretching, tearing or shrinking is called a developable surface. The cylinder, cone and the plane are all developable surfaces. The sphere and ellipsoid do not have developable surfaces, so any projection of them onto a plane will have to distort the image. (To compare, one cannot flatten an orange peel without tearing and warping it.)
One way of describing a projection is first to project from the Earth's surface to a developable surface such as a cylinder or cone, and then to unroll the surface into a plane. While the first step inevitably distorts some properties of the globe, the developable surface can then be unfolded without further distortion.
Aspect of the projection
This transverse Mercator projection is mathematically the same as a standard Mercator, but oriented around a different axis.
Once a choice is made between projecting onto a cylinder, cone, or plane, the aspect of the shape must be specified. The aspect describes how the developable surface is placed relative to the globe: it may be normal (such that the surface's axis of symmetry coincides with the Earth's axis), transverse (at right angles to the Earth's axis) or oblique (any angle in between).
Notable lines
Comparison of tangent and secant cylindrical, conic and azimuthal map projections with standard parallels shown in red
The developable surface may also be either tangent or secant to the sphere or ellipsoid. Tangent means the surface touches but does not slice through the globe; secant means the surface does slice through the globe. Moving the developable surface away from contact with the globe never preserves or optimizes metric properties, so that possibility is not discussed further here.
Tangent and secant lines (standard lines) are represented undistorted. If these lines are a parallel of latitude, as in conical projections, it is called a standard parallel. The central meridian is the meridian to which the globe is rotated before projecting. The central meridian (usually written λ0) and a parallel of origin (usually written φ0) are often used to define the origin of the map projection.[22][23]
A globe is the only way to represent the Earth with constant scale throughout the entire map in all directions. A map cannot achieve that property for any area, no matter how small. It can, however, achieve constant scale along specific lines.
Some possible properties are:
The scale depends on location, but not on direction. This is equivalent to preservation of angles, the defining characteristic of a conformal map.
Scale is constant along any parallel in the direction of the parallel. This applies for any cylindrical or pseudocylindrical projection in normal aspect.
Combination of the above: the scale depends on latitude only, not on longitude or direction. This applies for the Mercator projection in normal aspect.
Scale is constant along all straight lines radiating from a particular geographic location. This is the defining characteristic of an equidistant projection such as the azimuthal equidistant projection. There are also projections (Maurer's two-point equidistant projection, Close) where true distances from two points are preserved.[7]:234
Choosing a model for the shape of the body
Projection construction is also affected by how the shape of the Earth or planetary body is approximated. In the following section on projection categories, the earth is taken as a sphere in order to simplify the discussion. However, the Earth's actual shape is closer to an oblate ellipsoid. Whether spherical or ellipsoidal, the principles discussed hold without loss of generality.
Selecting a model for a shape of the Earth involves choosing between the advantages and disadvantages of a sphere versus an ellipsoid. Spherical models are useful for small-scale maps such as world atlases and globes, since the error at that scale is not usually noticeable or important enough to justify using the more complicated ellipsoid. The ellipsoidal model is commonly used to construct topographic maps and for other large- and medium-scale maps that need to accurately depict the land surface. Auxiliary latitudes are often employed in projecting the ellipsoid.
A third model is the geoid, a more complex and accurate representation of Earth's shape coincident with what mean sea level would be if there were no winds, tides, or land. Compared to the best fitting ellipsoid, a geoidal model would change the characterization of important properties such as distance, conformality and equivalence. Therefore, in geoidal projections that preserve such properties, the mapped graticule would deviate from a mapped ellipsoid's graticule. Normally the geoid is not used as an Earth model for projections, however, because Earth's shape is very regular, with the undulation of the geoid amounting to less than 100m from the ellipsoidal model out of the 6.3millionm Earth radius. For irregular planetary bodies such as asteroids, however, sometimes models analogous to the geoid are used to project maps from.[24][25][26][27][28]
Other regular solids are sometimes used as generalizations for smaller bodies' geoidal equivalent. For example, Io is better modeled by triaxial ellipsoid or prolated spheroid with small eccentricities. Haumea's shape is a Jacobi ellipsoid, with its major axis twice as long as its minor and with its middle axis one and half times as long as its minor. See map projection of the triaxial ellipsoid for further information.
Classification
One way to classify map projections is based on the type of surface onto which the globe is projected. In this scheme, the projection process is described as placing a hypothetical projection surface the size of the desired study area in contact with part of the Earth, transferring features of the Earth's surface onto the projection surface, then unraveling and scaling the projection surface into a flat map. The most common projection surfaces are cylindrical (e.g., Mercator), conic (e.g., Albers), and planar (e.g., stereographic). Many mathematical projections, however, do not neatly fit into any of these three projection methods. Hence other peer categories have been described in the literature, such as pseudoconic, pseudocylindrical, pseudoazimuthal, retroazimuthal, and polyconic.
Another way to classify projections is according to properties of the model they preserve. Some of the more common categories are:
Preserving direction (azimuthal or zenithal), a trait possible only from one or two points to every other point[10]:192
Preserving shape locally (conformal or orthomorphic)
Preserving area (equal-area or equiareal or equivalent or authalic)
Preserving distance (equidistant), a trait possible only between one or two points and every other point
Preserving shortest route, a trait preserved only by the gnomonic projection
Because the sphere is not a developable surface, it is impossible to construct a map projection that is both equal-area and conformal.
Projections by surface
The three developable surfaces (plane, cylinder, cone) provide useful models for understanding, describing, and developing map projections. However, these models are limited in two fundamental ways. For one thing, most world projections in use do not fall into any of those categories. For another thing, even most projections that do fall into those categories are not naturally attainable through physical projection. As L. P. Lee notes,
No reference has been made in the above definitions to cylinders, cones or planes. The projections are termed cylindric or conic because they can be regarded as developed on a cylinder or a cone, as the case may be, but it is as well to dispense with picturing cylinders and cones, since they have given rise to much misunderstanding. Particularly is this so with regard to the conic projections with two standard parallels: they may be regarded as developed on cones, but they are cones which bear no simple relationship to the sphere. In reality, cylinders and cones provide us with convenient descriptive terms, but little else.[29]
Lee's objection refers to the way the terms cylindrical, conic, and planar (azimuthal) have been abstracted in the field of map projections. If maps were projected as in light shining through a globe onto a developable surface, then the spacing of parallels would follow a very limited set of possibilities. Such a cylindrical projection (for example) is one which:
Is rectangular;
Has straight vertical meridians, spaced evenly;
Has straight parallels symmetrically placed about the equator;
Has parallels constrained to where they fall when light shines through the globe onto the cylinder, with the light source someplace along the line formed by the intersection of the prime meridian with the equator, and the center of the sphere.
(If you rotate the globe before projecting then the parallels and meridians will not necessarily still be straight lines. Rotations are normally ignored for the purpose of classification.)
Where the light source emanates along the line described in this last constraint is what yields the differences between the various "natural" cylindrical projections. But the term cylindrical as used in the field of map projections relaxes the last constraint entirely. Instead the parallels can be placed according to any algorithm the designer has decided suits the needs of the map. The famous Mercator projection is one in which the placement of parallels does not arise by projection; instead parallels are placed how they need to be in order to satisfy the property that a course of constant bearing is always plotted as a straight line.
The Mercator projection shows rhumbs as straight lines. A rhumb is a course of constant bearing. Bearing is the compass direction of movement.
A normal cylindrical projection is any projection in which meridians are mapped to equally spaced vertical lines and circles of latitude (parallels) are mapped to horizontal lines.
The mapping of meridians to vertical lines can be visualized by imagining a cylinder whose axis coincides with the Earth's axis of rotation. This cylinder is wrapped around the Earth, projected onto, and then unrolled.
By the geometry of their construction, cylindrical projections stretch distances east-west. The amount of stretch is the same at any chosen latitude on all cylindrical projections, and is given by the secant of the latitude as a multiple of the equator's scale. The various cylindrical projections are distinguished from each other solely by their north-south stretching (where latitude is given by φ):
North-south stretching equals east-west stretching (secφ): The east-west scale matches the north-south scale: conformal cylindrical or Mercator; this distorts areas excessively in high latitudes.
North-south stretching grows with latitude faster than east-west stretching (sec2φ): The cylindric perspective (or central cylindrical) projection; unsuitable because distortion is even worse than in the Mercator projection.
North-south stretching grows with latitude, but less quickly than the east-west stretching: such as the Miller cylindrical projection (sec 4/5φ).
North-south distances neither stretched nor compressed (1): equirectangular projection or "plate carrée".
North-south compression equals the cosine of the latitude (the reciprocal of east-west stretching): equal-area cylindrical. This projection has many named specializations differing only in the scaling constant, such as the Gall–Peters or Gall orthographic (undistorted at the 45° parallels), Behrmann (undistorted at the 30° parallels), and Lambert cylindrical equal-area (undistorted at the equator). Since this projection scales north-south distances by the reciprocal of east-west stretching, it preserves area at the expense of shapes.
In the first case (Mercator), the east-west scale always equals the north-south scale. In the second case (central cylindrical), the north-south scale exceeds the east-west scale everywhere away from the equator. Each remaining case has a pair of secant lines—a pair of identical latitudes of opposite sign (or else the equator) at which the east-west scale matches the north-south-scale.
Normal cylindrical projections map the whole Earth as a finite rectangle, except in the first two cases, where the rectangle stretches infinitely tall while retaining constant width.
Transverse cylindrical
A transverse cylindrical projection is a cylindrical projection that in the tangent case uses a great circle along a meridian as contact line for the cylinder.
A sinusoidal projection shows relative sizes accurately, but grossly distorts shapes. Distortion can be reduced by "interrupting" the map.
Pseudocylindrical projections represent the centralmeridian as a straight line segment. Other meridians are longer than the central meridian and bow outward, away from the central meridian. Pseudocylindrical projections map parallels as straight lines. Along parallels, each point from the surface is mapped at a distance from the central meridian that is proportional to its difference in longitude from the central meridian. Therefore, meridians are equally spaced along a given parallel. On a pseudocylindrical map, any point further from the equator than some other point has a higher latitude than the other point, preserving north-south relationships. This trait is useful when illustrating phenomena that depend on latitude, such as climate. Examples of pseudocylindrical projections include:
Sinusoidal, which was the first pseudocylindrical projection developed. On the map, as in reality, the length of each parallel is proportional to the cosine of the latitude.[30] The area of any region is true.
Collignon projection, which in its most common forms represents each meridian as two straight line segments, one from each pole to the equator.
The HEALPix projection combines an equal-area cylindrical projection in equatorial regions with the Collignon projection in polar areas.
Conic
Albers conic
The term "conic projection" is used to refer to any projection in which meridians are mapped to equally spaced lines radiating out from the apex and circles of latitude (parallels) are mapped to circular arcs centered on the apex.[31]
When making a conic map, the map maker arbitrarily picks two standard parallels. Those standard parallels may be visualized as secant lines where the cone intersects the globe—or, if the map maker chooses the same parallel twice, as the tangent line where the cone is tangent to the globe. The resulting conic map has low distortion in scale, shape, and area near those standard parallels. Distances along the parallels to the north of both standard parallels or to the south of both standard parallels are stretched; distances along parallels between the standard parallels are compressed. When a single standard parallel is used, distances along all other parallels are stretched.
Conic projections that are commonly used are:
Equidistant conic, which keeps parallels evenly spaced along the meridians to preserve a constant distance scale along each meridian, typically the same or similar scale as along the standard parallels.
Albers conic, which adjusts the north-south distance between non-standard parallels to compensate for the east-west stretching or compression, giving an equal-area map.
Lambert conformal conic, which adjusts the north-south distance between non-standard parallels to equal the east-west stretching, giving a conformal map.
Pseudoconic
Bonne, an equal-area projection on which most meridians and parallels appear as curved lines. It has a configurable standard parallel along which there is no distortion.
Werner cordiform, upon which distances are correct from one pole, as well as along all parallels.
An azimuthal equidistant projection shows distances and directions accurately from the center point, but distorts shapes and sizes elsewhere.
Azimuthal projections have the property that directions from a central point are preserved and therefore great circles through the central point are represented by straight lines on the map. These projections also have radial symmetry in the scales and hence in the distortions: map distances from the central point are computed by a function r(d) of the true distance d, independent of the angle; correspondingly, circles with the central point as center are mapped into circles which have as center the central point on the map.
The mapping of radial lines can be visualized by imagining a plane tangent to the Earth, with the central point as tangent point.
The radial scale is r′(d) and the transverse scale r(d)/(Rsind/R) where R is the radius of the Earth.
Some azimuthal projections are true perspective projections; that is, they can be constructed mechanically, projecting the surface of the Earth by extending lines from a point of perspective (along an infinite line through the tangent point and the tangent point's antipode) onto the plane:
The gnomonic projection displays great circles as straight lines. Can be constructed by using a point of perspective at the center of the Earth. r(d) = ctand/R; so that even just a hemisphere is already infinite in extent.[32][33]
The orthographic projection maps each point on the Earth to the closest point on the plane. Can be constructed from a point of perspective an infinite distance from the tangent point; r(d) = csind/R.[34] Can display up to a hemisphere on a finite circle. Photographs of Earth from far enough away, such as the Moon, approximate this perspective.
Near-sided perspective projection, which simulates the view from space at a finite distance and therefore shows less than a full hemisphere, such as used in The Blue Marble 2012).[35]
The General Perspective projection can be constructed by using a point of perspective outside the Earth. Photographs of Earth (such as those from the International Space Station) give this perspective. It is a generalization of near-sided perspective projection, allowing tilt.
The stereographic projection, which is conformal, can be constructed by using the tangent point's antipode as the point of perspective. r(d) = ctand/2R; the scale is c/(2Rcos2d/2R).[36] Can display nearly the entire sphere's surface on a finite circle. The sphere's full surface requires an infinite map.
Other azimuthal projections are not true perspective projections:
Azimuthal equidistant: r(d) = cd; it is used by amateur radio operators to know the direction to point their antennas toward a point and see the distance to it. Distance from the tangent point on the map is proportional to surface distance on the Earth (;[37] for the case where the tangent point is the North Pole, see the flag of the United Nations)
Lambert azimuthal equal-area. Distance from the tangent point on the map is proportional to straight-line distance through the Earth: r(d) = csind/2R[38]
Logarithmic azimuthal is constructed so that each point's distance from the center of the map is the logarithm of its distance from the tangent point on the Earth. r(d) = clnd/d0); locations closer than at a distance equal to the constant d0 are not shown.[39]
Comparison of some azimuthal projections centred on 90°N at the same scale, ordered by projection altitude in Earth radii (clickfordetail)
Polyhedral map projections use a polyhedron to subdivide the globe into faces, and then projects each face to the globe. The most well-known polyhedral map projection is Buckminster Fuller's Dymaxion map.
Conformal, or orthomorphic, map projections preserve angles locally, implying that they map infinitesimal circles of constant size anywhere on the Earth to infinitesimal circles of varying sizes on the map. In contrast, mappings that are not conformal distort most such small circles into ellipses of distortion. An important consequence of conformality is that relative angles at each point of the map are correct, and the local scale (although varying throughout the map) in every direction around any one point is constant. These are some conformal projections:
Equal-area maps preserve area measure, generally distorting shapes in order to do so. Equal-area maps are also called equivalent or authalic. These are some projections that preserve area:
If the length of the line segment connecting two projected points on the plane is proportional to the geodesic (shortest surface) distance between the two unprojected points on the globe, then we say that distance has been preserved between those two points. An equidistant projection preserves distances from one or two special points to all other points. The special point or points may get stretched into a line or curve segment when projected. In that case, the point on the line or curve segment closest to the point being measured to must be used to measure the distance.
Plate carrée: Distances from the two poles are preserved, in equatorial aspect.
Compromise projections give up the idea of perfectly preserving metric properties, seeking instead to strike a balance between distortions, or to simply make things look right. Most of these types of projections distort shape in the polar regions more than at the equator. These are some compromise projections:
The mathematics of projection do not permit any particular map projection to be best for everything.[39] Something will always be distorted. Thus, many projections exist to serve the many uses of maps and their vast range of scales.
Modern national mapping systems typically employ a transverse Mercator or close variant for large-scale maps in order to preserve conformality and low variation in scale over small areas. For smaller-scale maps, such as those spanning continents or the entire world, many projections are in common use according to their fitness for the purpose, such as Winkel tripel, Robinson and Mollweide.[40] Reference maps of the world often appear on compromise projections. Due to distortions inherent in any map of the world, the choice of projection becomes largely one of aesthetics.
Thematic maps normally require an equal area projection so that phenomena per unit area are shown in correct proportion.[41] However, representing area ratios correctly necessarily distorts shapes more than many maps that are not equal-area.
The Mercator projection, developed for navigational purposes, has often been used in world maps where other projections would have been more appropriate.[42][43][44][45] This problem has long been recognized even outside professional circles. For example, a 1943 New York Times editorial states:
The time has come to discard [the Mercator] for something that represents the continents and directions less deceptively ... Although its usage ... has diminished ... it is still highly popular as a wall map apparently in part because, as a rectangular map, it fills a rectangular wall space with more map, and clearly because its familiarity breeds more popularity.[7]:166
A controversy in the 1980s over the Peters map motivated the American Cartographic Association (now the Cartography and Geographic Information Society) to produce a series of booklets (including Which Map Is Best[46]) designed to educate the public about map projections and distortion in maps. In 1989 and 1990, after some internal debate, seven North American geographic organizations adopted a resolution recommending against using any rectangular projection (including Mercator and Gall–Peters) for reference maps of the world.[47][48]
UV mapping– 3D model's surface projected to a 2D image
World map– Map of most or all of the surface of the Earth
Spherical image projection– Video projection techniquePages displaying short descriptions of redirect targets
References
Citations
↑Lambert, Johann; Tobler, Waldo (2011). Notes and comments on the composition of terrestrial and celestial maps. Redlands, CA: ESRI Press. ISBN978-1-58948-281-4.
↑Richardus, Peter; Adler, Ron (1972). map projections. New York, NY: American Elsevier Publishing Company, inc. ISBN0-444-10362-7.
↑Robinson, Arthur; Randall, Sale; Morrison, Joel; Muehrcke, Phillip (1985). Elements of Cartography (fifthed.). Wiley. ISBN0-471-09877-9.
↑Snyder, J.P.; Voxland, P.M. (1989). "An album of map projections". Album of Map Projections(PDF). U.S. Geological Survey Professional Paper. Vol.1453. United States Government Printing Office. doi:10.3133/pp1453. Retrieved 8 March 2022.
↑Canters, Frank (2002). Small-scale map projection design. Research monographs in geographic information systems. London: Taylor & Francis. p.291. ISBN9780203472095.
↑Wirth, Ervin; Kun, Péter (July 2015). "Real-time projection visualisation with Indicatrix Mapper QGIS Plugin"(PDF). In Brovelli, Maria Antonia; Minghini, Marco; Negreti, Marco (eds.). Open Innovation for Europe. FOSS4G Europe 2015. Geomatics Workbooks. Vol.12. Como, Italy: Polytechnic University of Milan. pp.697–700. ISSN1591-092X. Archived(PDF) from the original on 23 July 2022.
↑Airy, G.B. (1861). "Explanation of a projection by balance of errors for maps applying to a very large extent of the Earth's surface; and comparison of this projection with other projections". London, Edinburgh, and Dublin Philosophical Magazine. 4. 22 (149): 409–421. doi:10.1080/14786446108643179.
↑Clark, P. E.; Clark, C. S. (2013). "CSNB Mapping Applied to Irregular Bodies". Constant-Scale Natural Boundary Mapping to Reveal Global and Cosmic Processes. SpringerBriefs in Astronomy. p.71. doi:10.1007/978-1-4614-7762-4_6. ISBN978-1-4614-7761-7.
↑Lee, L.P. (1944). "The nomenclature and classification of map projections". Empire Survey Review. VII (51): 190–200. doi:10.1179/sre.1944.7.51.190. p. 193
12Snyder, John P. (1997). "Enlarging the Heart of a Map". In Robinson, Arthur H.; Snyder, John P. (eds.). Matching the Map Projection to the Need. Cartography and Geographic Information Society. Archived from the original on 2 July 2010. Retrieved 14 April 2016. Reprinted in: Snyder, John P. (2017). "Matching the Map Projection to the Need". In Lapaine, Miljenko; Usery, E. Lynn (eds.). Choosing a Map Projection. Lecture Notes in Geoinformation and Cartography. Cham, Switzerland: International Cartographic Association. pp.78–83. doi:10.1007/978-3-319-51835-0_3. ISBN978-3-319-51835-0.
↑Choosing a World Map. Falls Church, Virginia: American Congress on Surveying and Mapping. 1988. p.1. ISBN0-9613459-2-6.
↑Slocum, Terry A.; Robert B. McMaster; Fritz C. Kessler; Hugh H. Howard (2005). Thematic Cartography and Geographic Visualization (2nded.). Upper Saddle River, NJ: Pearson Prentice Hall. p.166. ISBN0-13-035123-7.
↑Bauer, H.A. (1942). "Globes, Maps, and Skyways (Air Education Series)". New York. p. 28
↑Raisz, Erwin Josephus. (1938). General Cartography. New York: McGraw–Hill. 2d ed., 1948. p. 87.
↑Robinson, Arthur Howard. (1960). Elements of Cartography, second edition. New York: John Wiley and Sons. p. 82.
↑American Cartographic Association's Committee on Map Projections, 1986. Which Map is Best p. 12. Falls Church: American Congress on Surveying and Mapping.
↑"Geographers and Cartographers Urge End to Popular Use of Rectangular Maps". American Cartographer. 16: 222–223. 1989. doi:10.1559/152304089783814089.
Sources
Fran Evanisko, American River College, lectures for Geography 20: "Cartographic Design for GIS", Fall 2002
Map Projections—PDF versions of numerous projections, created and released into the Public Domain by Paul B. Anderson ... member of the International Cartographic Association's Commission on Map Projections
"An Album of Map Projections"(PDF).(12.6MB), U.S. Geological Survey Professional Paper 1453, by John P. Snyder (USGS) and Philip M. Voxland (U. Minnesota), 1989.
This page is based on this Wikipedia article Text is available under the CC BY-SA 4.0 license; additional terms may apply. Images, videos and audio are available under their respective licenses.


