World map

Last updated

A world map on the Winkel tripel projection,
a low-error map projection adopted by the National Geographic Society for reference maps Winkel triple projection SW.jpg
A world map on the Winkel tripel projection,
a low-error map projection adopted by the National Geographic Society for reference maps
NASA's Blue Marble Next Generation, a composite of cloud-free satellite images Blue Marble 2002.png
NASA's Blue Marble Next Generation, a composite of cloud-free satellite images

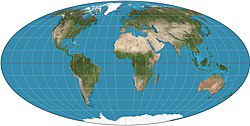
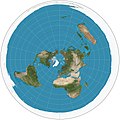
A world map is a map of most or all of the surface of Earth. World maps, because of their scale, must deal with the problem of projection. Maps rendered in two dimensions by necessity distort the display of the three-dimensional surface of the Earth. While this is true of any map, these distortions reach extremes in a world map. Many techniques have been developed to present world maps that address diverse technical and aesthetic goals. [2]

Contents

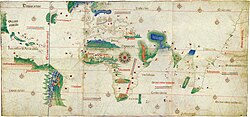
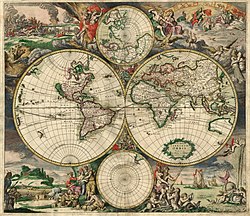
Charting a world map requires global knowledge of the Earth, its oceans, and its continents. From prehistory through the Middle ages, creating an accurate world map would have been impossible because less than half of Earth's coastlines and only a small fraction of its continental interiors were known to any culture. With exploration that began during the European Renaissance, knowledge of the Earth's surface accumulated rapidly, such that most of the world's coastlines had been mapped, at least roughly, by the mid-1700s and the continental interiors by the twentieth century.

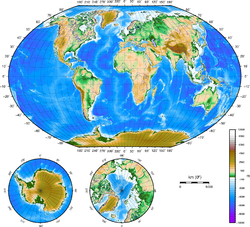
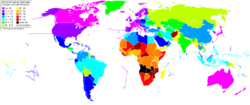
Maps of the world generally focus either on political features or on physical features. Political maps emphasize territorial boundaries and human settlement. Physical maps show geographical features such as mountains, soil type, or land use. Geological maps show not only the surface, but characteristics of the underlying rock, fault lines, and subsurface structures. Choropleth maps use color hue and intensity to contrast differences between regions, such as demographic or economic statistics.

Map projections

All world maps are based on one of several map projections, or methods of representing a globe on a plane. All projections distort geographic features, distances, and directions in some way. The various map projections that have been developed provide different ways of balancing accuracy and the unavoidable distortion inherent in making world maps.

Perhaps the best-known projection is the Mercator Projection, originally designed as a nautical chart.

Thematic maps

A thematic map shows geographical information about one or a few focused subjects. These maps "can portray physical, social, political, cultural, economic, sociological, agricultural, or any other aspects of a city, state, region, nation, or continent". [3]

Historical maps

Early world maps cover depictions of the world from the Iron Age to the Age of Discovery and the emergence of modern geography during the early modern period. Old maps provide information about places that were known in past times, as well as the philosophical and cultural basis of the map, which were often much different from modern cartography. Maps are one means by which scientists distribute their ideas and pass them on to future generations. [4]

See also

Related Research Articles

<span class="mw-page-title-main">Cartography</span> Study and practice of making maps

Cartography is the study and practice of making and using maps. Combining science, aesthetics and technique, cartography builds on the premise that reality can be modeled in ways that communicate spatial information effectively.

<span class="mw-page-title-main">Gall–Peters projection</span> Cylindrical equal-area map projection

The Gall–Peters projection is a rectangular, equal-area map projection. Like all equal-area projections, it distorts most shapes. It is a cylindrical equal-area projection with latitudes 45° north and south as the regions on the map that have no distortion.

<span class="mw-page-title-main">Map</span> Symbolic depiction of relationships

A map is a symbolic depiction emphasizing relationships between elements of some space, such as objects, regions, or themes.

<span class="mw-page-title-main">Mercator projection</span> Cylindrical conformal map projection

The Mercator projection is a cylindrical map projection presented by Flemish geographer and cartographer Gerardus Mercator in 1569. It became the standard map projection for navigation because it is unique in representing north as up and south as down everywhere while preserving local directions and shapes. The map is thereby conformal. As a side effect, the Mercator projection inflates the size of objects away from the equator. This inflation is very small near the equator but accelerates with increasing latitude to become infinite at the poles. As a result, landmasses such as Greenland, Antarctica, Canada and Russia appear far larger than they actually are relative to landmasses near the equator, such as Central Africa.

<span class="mw-page-title-main">Map projection</span> Systematic representation of the surface of a sphere or ellipsoid onto a plane

In cartography, a map projection is any of a broad set of transformations employed to represent the curved two-dimensional surface of a globe on a plane. In a map projection, coordinates, often expressed as latitude and longitude, of locations from the surface of the globe are transformed to coordinates on a plane. Projection is a necessary step in creating a two-dimensional map and is one of the essential elements of cartography.

<span class="mw-page-title-main">Gerardus Mercator</span> Flemish cartographer (1512–1594)

Gerardus Mercator was a Flemish geographer, cosmographer and cartographer. He is most renowned for creating the 1569 world map based on a new projection which represented sailing courses of constant bearing as straight lines—an innovation that is still employed in nautical charts.

<span class="mw-page-title-main">Topographic map</span> Medium to large scale map that shows a precise map of the terrain

In modern mapping, a topographic map or topographic sheet is a type of map characterized by large-scale detail and quantitative representation of relief features, usually using contour lines, but historically using a variety of methods. Traditional definitions require a topographic map to show both natural and artificial features. A topographic survey is typically based upon a systematic observation and published as a map series, made up of two or more map sheets that combine to form the whole map. A topographic map series uses a common specification that includes the range of cartographic symbols employed, as well as a standard geodetic framework that defines the map projection, coordinate system, ellipsoid and geodetic datum. Official topographic maps also adopt a national grid referencing system.

<span class="mw-page-title-main">Dymaxion map</span> Polyhedral compromise map projection

The Dymaxion map or Fuller map is a projection of a world map onto the surface of an icosahedron, which can be unfolded and flattened to two dimensions. The flat map is heavily interrupted in order to preserve shapes and sizes.

<span class="mw-page-title-main">Globe</span> Scale model of a celestial body

A globe is a spherical model of Earth, of some other celestial body, or of the celestial sphere. Globes serve purposes similar to maps, but, unlike maps, they do not distort the surface that they portray except to scale it down. A model globe of Earth is called a terrestrial globe. A model globe of the celestial sphere is called a celestial globe.

<span class="mw-page-title-main">Cartogram</span> Map distorting size to show another value

A cartogram is a thematic map of a set of features, in which their geographic size is altered to be directly proportional to a selected variable, such as travel time, population, or Gross National Product. Geographic space itself is thus warped, sometimes extremely, in order to visualize the distribution of the variable. It is one of the most abstract types of map; in fact, some forms may more properly be called diagrams. They are primarily used to display emphasis and for analysis as nomographs.

<span class="mw-page-title-main">Nicolas Auguste Tissot</span> French cartographer (1824–1907)

Nicolas Auguste Tissot was a French cartographer, who in 1859 and 1881 published an analysis of the distortion that occurs on map projections. He devised Tissot's indicatrix, or distortion circle, which when plotted on a map will appear as an ellipse whose elongation depends on the amount of distortion by the map at that point. The angle and extent of the elongation represents the amount of angular distortion of the map. The size of the ellipse indicates the amount that the area is distorted.

The earliest known world maps date to classical antiquity, the oldest examples of the 6th to 5th centuries BCE still based on the flat Earth paradigm. World maps assuming a spherical Earth first appear in the Hellenistic period. The developments of Greek geography during this time, notably by Eratosthenes and Posidonius culminated in the Roman era, with Ptolemy's world map, which would remain authoritative throughout the Middle Ages. Since Ptolemy, knowledge of the approximate size of the Earth allowed cartographers to estimate the extent of their geographical knowledge, and to indicate parts of the planet known to exist but not yet explored as terra incognita.

<span class="mw-page-title-main">Spatial reference system</span> System to specify locations on Earth

A spatial reference system (SRS) or coordinate reference system (CRS) is a framework used to precisely measure locations on the surface of Earth as coordinates. It is thus the application of the abstract mathematics of coordinate systems and analytic geometry to geographic space. A particular SRS specification comprises a choice of Earth ellipsoid, horizontal datum, map projection, origin point, and unit of measure. Thousands of coordinate systems have been specified for use around the world or in specific regions and for various purposes, necessitating transformations between different SRS.

The history of cartography refers to the development and consequences of cartography, or mapmaking technology, throughout human history. Maps have been one of the most important human inventions for millennia, allowing humans to explain and navigate their way through the world.

Critical cartography is a set of mapping practices and methods of analysis grounded in critical theory, specifically the thesis that maps reflect and perpetuate relations of power, typically in favor of a society's dominant group. Critical cartographers aim to reveal the “‘hidden agendas of cartography’ as tools of socio-spatial power”. While the term "critical cartography" often refers to a body of theoretical literature, critical cartographers also call for practical applications of critical cartographic theory, such as counter-mapping, participatory mapping, and neogeography.

In cartography, a conformal map projection is one in which every angle between two curves that cross each other on Earth is preserved in the image of the projection; that is, the projection is a conformal map in the mathematical sense. For example, if two roads cross each other at a 39° angle, their images on a map with a conformal projection cross at a 39° angle.

Cartographic propaganda is a map created with the goal of achieving a result similar to traditional propaganda. The map can be outright falsified, or created using subjectivity with the goal of persuasion. The idea that maps are subjective is not new; cartographers refer to maps as a human-subjective product and some view cartography as an "industry, which packages and markets spatial knowledge" or as a communicative device distorted by human subjectivity. However, cartographic propaganda is widely successful because maps are often presented as a miniature model of reality, and it is a rare occurrence that a map is referred to as a distorted model, which sometimes can "lie" and contain items that are completely different from reality. Because the word propaganda has become a pejorative, it has been suggested that mapmaking of this kind should be described as "persuasive cartography", defined as maps intended primarily to influence opinions or beliefs – to send a message – rather than to communicate geographic information.

This glossary of geography terms is a list of definitions of terms and concepts used in geography and related fields, including Earth science, oceanography, cartography, and human geography, as well as those describing spatial dimension, topographical features, natural resources, and the collection, analysis, and visualization of geographic data. It is split across two articles:

<span class="mw-page-title-main">Mercator 1569 world map</span> First map in Mercators projection

The Mercator world map of 1569 is titled Nova et Aucta Orbis Terrae Descriptio ad Usum Navigantium Emendate Accommodata. The title shows that Gerardus Mercator aimed to present contemporary knowledge of the geography of the world and at the same time 'correct' the chart to be more useful to sailors. This 'correction', whereby constant bearing sailing courses on the sphere are mapped to straight lines on the plane map, characterizes the Mercator projection. While the map's geography has been superseded by modern knowledge, its projection proved to be one of the most significant advances in the history of cartography, inspiring the 19th century map historian Adolf Nordenskiöld to write "The master of Rupelmonde stands unsurpassed in the history of cartography since the time of Ptolemy." The projection heralded a new era in the evolution of navigation maps and charts and it is still their basis.

<span class="mw-page-title-main">Graticule (cartography)</span>

A graticule, on a map, is a graphical depiction of a coordinate system as a grid of lines, each line representing a constant coordinate value. It is thus a form of isoline, and is commonly found on maps of many kinds, at scales from local to global.

References

  1. Large-Scale Distortions in Map Projections Archived 16 February 2016 at the Wayback Machine , 2007, David M. Goldberg & J. Richard Gott III, 2007, V42 N4.
  2. American Cartographic Association's Committee on Map Projections (1988). Choosing a World Map. Falls Church: American Congress on Surveying and Mapping. pp. 1–2.
  3. Thematic Maps Archived 7 September 2012 at the Wayback Machine Map Collection & Cartographic Information Services Unit. University Library, University of Washington. Accessed 27 December 2009.
  4. "History of maps and cartography". emporia.edu. Archived from the original on 9 July 2011. Retrieved 17 October 2007.

Further reading