A nautical chart or hydrographic chart is a graphic representation of a sea region or water body and adjacent coasts or banks. Depending on the scale of the chart, it may show depths of water (bathymetry) and heights of land (topography), natural features of the seabed, details of the coastline, navigational hazards, locations of natural and human-made aids to navigation, information on tides and currents, local details of the Earth's magnetic field, and human-made structures such as harbours, buildings, and bridges. Nautical charts are essential tools for marine navigation; many countries require vessels, especially commercial ships, to carry them. Nautical charting may take the form of charts printed on paper (raster navigational charts) or computerized electronic navigational charts. Recent technologies have made available paper charts which are printed "on demand" with cartographic data that has been downloaded to the commercial printing company as recently as the night before printing. With each daily download, critical data such as Local Notices to Mariners are added to the on-demand chart files so that these charts are up to date at the time of printing.
Nautical charts are based on hydrographic surveys and bathymetric surveys. As surveying is laborious and time-consuming, hydrographic data for many areas of sea may be dated and are sometimes unreliable. Depths are measured in a variety of ways. Historically the sounding line was used. In modern times, echo sounding is used for measuring the seabed in the open sea. When measuring the safe depth of water over an entire obstruction, such as a shipwreck, the minimum depth is checked by sweeping the area with a length of horizontal wire. All depths on charts is measured with respect to a datum/reference level. This ensures that difficult to find projections, such as masts, do not present a danger to vessels navigating over the obstruction.
Publication
Nautical charts are issued by power of the national hydrographic offices in many countries. These charts are considered "official" in contrast to those made by commercial publishers. Many hydrographic offices provide regular, sometimes weekly, manual updates of their charts through their sales agents. Individual hydrographic offices produce national chart series and international chart series. Coordinated by the International Hydrographic Organization, the international chart series is a worldwide system of charts ("INT" chart series), which is being developed with the goal of unifying as many chart systems as possible.
There are also commercially published charts, some of which may carry additional information of particular interest, e.g. for yacht skippers.
Chart correction
The nature of a waterway depicted by a chart may change, and artificial aids to navigation may be altered at short notice. Therefore, old or uncorrected charts should never be used for navigation. Every producer of nautical charts also provides a system to inform mariners of changes that affect the chart. In the United States, chart corrections and notifications of new editions are provided by various governmental agencies by way of Notice to Mariners, Local Notice to Mariners, Summary of Corrections, and Broadcast Notice to Mariners. In the U.S., NOAA also has a printing partner who prints the "POD" (print on demand) NOAA charts, and they contain the very latest corrections and notifications at the time of printing. To give notice to mariners, radio broadcasts provide advance notice of urgent corrections.
A good way to keep track of corrections is with a Chart and Publication Correction Record Card system. Using this system, the navigator does not immediately update every chart in the portfolio when a new Notice to Mariners arrives, instead creating a card for every chart and noting the correction on this card. When the time comes to use the chart, he pulls the chart and chart's card, and makes the indicated corrections on the chart. This system ensures that every chart is properly corrected prior to use. A prudent mariner should obtain a new chart if he has not kept track of corrections and his chart is more than several months old.
Various Digital Notices to Mariners systems are available on the market such as Digitrace, Voyager, or ChartCo, to correct British Admiralty charts as well as NOAA charts. These systems provide only vessel relevant corrections via e-mail or web downloads, reducing the time needed to sort out corrections for each chart. Tracings to assist corrections are provided at the same time.
The Canadian Coast Guard produces the Notice to Mariners publication which informs mariners of important navigational safety matters affecting Canadian Waters. This electronic publication is published on a monthly basis and can be downloaded from the Notices to Mariners (NOTMAR) Web site. The information in the Notice to Mariners is formatted to simplify the correction of paper charts and navigational publications.
Various and diverse methods exist for the correction of electronic navigational charts.
Limitations
In 1973 the cargo ship MV Muirfield (a merchant vessel named after Muirfield, Scotland) struck an unknown object in the Indian Ocean in waters charted at a depth of greater than 5,000 metres (16,404ft), resulting in extensive damage to her keel.[1] In 1983, HMAS Moresby, a Royal Australian Navysurvey ship, surveyed the area where Muirfield was damaged, and charted in detail a previously unsuspected hazard to navigation, the Muirfield Seamount. The dramatic accidental discovery of the Muirfield Seamount is often cited as an example of limitations in the vertical geodetic datum accuracy of some offshore areas as represented on nautical charts, especially on small-scale charts.
A similar incident involving a passenger ship occurred in 1992 when the Cunard liner Queen Elizabeth 2 struck a submerged rock off Block Island in the Atlantic Ocean.[2] In November 1999, the semi-submersible, heavy-lift shipMighty Servant 2 capsized and sank after hitting an uncharted single underwater isolated pinnacle of granite off Indonesia. Five crew members died and Mighty Servant 2 was declared a total loss.[3] More recently, in 2005 the submarine USS San Francisco ran into an uncharted seamount (sea mountain) about 560 kilometres (350 statute miles) south of Guam at a speed of 35 knots (40.3mph; 64.8km/h), sustaining serious damage and killing one seaman. In September 2006 the jack-up bargeOctopus ran aground on an uncharted sea mount within the Orkney Islands (United Kingdom) while being towed by the tug Harold. £1M worth of damage was caused to the barge and delayed work on the installation of a tidal energy generator prototype. As stated in the Mariners Handbook and subsequent accident report: "No chart is infallible. Every chart is liable to be incomplete".[4]
Map projection, positions, and bearings
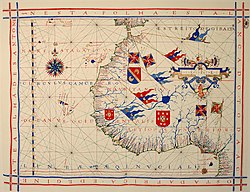
A pre-Mercator nautical chart of 1571, from Portuguese cartographer Fernão Vaz Dourado (c.1520– c.1580). It belongs to the so-called plane chart model, where observed latitudes and magnetic directions are plotted directly into the plane, with a constant scale, as if the Earth's surface were a flat plane (Portuguese National Archives of Torre do Tombo, Lisbon)
Historically the first projection, invented by Marinus of Tyre ca. AD 100 according to Ptolemy, was what is now called equirectangular projection (historically called plane chart, plate carrée, Portuguese: carta plana quadrada). While it is very convenient for small seas like the Aegean, it is unsuitable for seas larger than Mediterranean or an open ocean, even though early explorers had to use it for want of a better.
The Mercator projection is now used on the vast majority of nautical charts. Since the Mercator projection is conformal, that is, bearings in the chart are identical to the corresponding angles in nature, courses plotted on the chart may be used directly as the course-to-steer at the helm.
Positions of places shown on the chart can be measured from the longitude and latitude scales on the borders of the chart, relative to a geodetic datum such as WGS 84.
A bearing is the angle between the line joining the two points of interest and the line from one of the points to the north, such as a ship's course or a compass reading to a landmark. On nautical charts, the top of the chart is always true north, rather than magnetic north, towards which a compass points. Most charts include a compass rose depicting the variation between magnetic and true north.
However, the use of the Mercator projection has drawbacks. This projection shows the lines of longitude as parallel. On the real globe, the lines of longitude converge as they approach the north or south pole. This means that east–west distances are exaggerated at high latitudes. To keep the projection conformal, the projection increases the displayed distance between lines of latitude (north–south distances) in proportion; thus a square is shown as a square everywhere on the chart, but a square on the Arctic Circle appears much bigger than a square of the same size at the equator. In practical use, this is less of a problem than it sounds. One minute of latitude is, for practical purposes, a nautical mile. Distances in nautical miles can therefore be measured on the latitude gradations printed on the side of the chart.[6]
Conventional nautical charts are printed on large sheets of paper at a variety of scales. Mariners will generally carry many charts to provide sufficient detail for the areas they might need to visit. Electronic navigational charts, which use computer software and electronic databases to provide navigation information, can augment or in some cases replace paper charts, though many mariners carry paper charts as a backup in case the electronic charting system fails.
Details on a nautical chart
Many countries' hydrographic agencies publish a "Chart 1", which explains all of the symbols, terms and abbreviations used on charts that they produce for both domestic and international use. Each country starts with the base symbology specified in IHO standard INT 1, and is then permitted to add its own supplemental symbologies to its domestic charts, which are also explained in its version of Chart 1. Ships are typically required to carry copies of Chart 1 with their paper charts.
Labels
Automatically labeled nautical chart
Nautical charts must be labeled with navigational and depth information. There are a few commercial software packages that do automatic label placement for any kind of map or chart. Modern systems render electronic charts consistent with the IHO S-52 specification, issued by the International Hydrographic Organization (IHO).[7]
Pilotage information
Detail of a United States NOAA chart, showing a harbour area
The chart uses symbols to provide pilotage information about the nature and position of features useful to navigators, such as sea bed information, sea mark, and landmarks. Some symbols describe the sea bed with information such as its depth, materials as well as possible navigational hazards such as shipwrecks. Other symbols show the position and characteristics of navigational aids such as buoys, lights, lighthouses, coastal and land features and structures that are useful for position fixing. The abbreviation "ED" is commonly used to label geographic locations whose existence is doubtful.
Colours distinguish between human-made features, dry land, sea bed that dries with the tide, and seabed that is permanently underwater and indicate water depth.
Depths which have been measured are indicated by the numbers shown on the chart. Depths on charts published in most parts of the world use metres. Older charts, as well as those published by the United States government, may use feet or fathoms. Depth contour lines show the shape of underwater relief. Coloured areas of the sea emphasise shallow water and dangerous underwater obstructions. Depths are measured from the chart datum, which is related to the local sea level. The chart datum varies according to the standard used by each national hydrographic office. In general, the trend is towards using lowest astronomical tide (LAT), the lowest tide predicted in the full tidal cycle, but in non-tidal areas and some tidal areas Mean Sea Level (MSL) is used.
Heights, e.g. a lighthouse, are generally given relative to mean high water spring (MHWS). Vertical clearances, e.g. below a bridge or cable, are given relative to highest astronomical tide (HAT). The chart will indicate what datum is in use.
The use of HAT for heights and LAT for depths, means that the mariner can quickly look at the chart to ensure that they have sufficient clearance to pass any obstruction, though they may have to calculate height of tide to ensure their safety.
Tidal information
Tidal races and strong currents have special chart symbols. Tidal flow information may be shown on charts using tidal diamonds, indicating the speed and bearing of the tidal flow during each hour of the tidal cycle.
Calder, Nigel (2008). How to Read a Nautical Chart. McGraw-Hill Professional. ISBN978-0-07-159287-1.
References
↑ Calder, Nigel. How to Read a Navigational Chart: A Complete Guide to the Symbols, Abbreviations, and Data Displayed on Nautical Charts. International Marine/Ragged Mountain Press, 2002.
↑ British Admiralty. The Mariner's Handbook. 1999 edition, page 23.
This page is based on this Wikipedia article Text is available under the CC BY-SA 4.0 license; additional terms may apply. Images, videos and audio are available under their respective licenses.