Bathymetric chart

Last updated

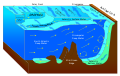
A bathymetric chart is a type of isarithmic map that depicts the submerged topography and physiographic features of ocean and sea bottoms. [1] Their primary purpose is to provide detailed depth contours of ocean topography as well as provide the size, shape and distribution of underwater features. Topographic maps display elevation above ground and are complementary to bathymetric charts. Charts use a series of lines and points at equal intervals to showcase depth or elevation. A closed shape with increasingly smaller shapes inside of it can indicate an ocean trench or a seamount, or underwater mountain, depending on whether the depths increase or decrease going inward. [2]

Contents

Bathymetric map of Kama`ehuakanaloa Seamount (formerly Loihi) LoihiBathemetric.jpg
Bathymetric map of Kamaʻehuakanaloa Seamount (formerly Loihi)

Bathymetric surveys and charts are associated with the science of oceanography, particularly marine geology, and underwater engineering or other specialized purposes.

Bathymetric Map of Medicine Lake, CA MedicineLakeBathymetricMeters20080926.png
Bathymetric Map of Medicine Lake, CA

Bathymetric data used to produce charts can also be converted to bathymetric profiles which are vertical sections through a feature.

Bathymetric chart of Bear Lake Bathymetry.jpg
Bathymetric chart of Bear Lake

History

Ancient Egypt

The use of bathymetry and the development of bathymetric charts dates back around the 19th century BC to ancient Egypt. Depictions on tomb walls such as the bas-relief carvings of Deir al-Bahri commissioned by Queen Hatshepsut in the 16th century BC show ancient mariners using long slender poles as sounding poles to determine the depth of the Nile River and into the Nile River Delta. [3]

Ancient Greece

The first written account and mapped records of sounding did not occur until 1000 years after the Egyptians had begun sounding and mapping the Nile. The Greek historian Herodotus writes of a sounding in 66 feet of water of the mouth of the Nile in the river delta. He writes of yellow mud being brought up similar to the same that was deposited with the yearly floods. [4] These accounts show a heightened awareness of regional depths and seafloor characteristics among ancient mariners and demonstrate that discoveries in bathymetry and the use of bathymetric charts had progressed significantly.

Ancient Rome

The New Testament recounts soundings being taken with the shipwreck of Paul on the island of Malta in the Book of Acts. Chapter 27, verses 27-44 [5] recount the experience:

27 "...as we were driven up and down in Adria, about midnight the shipmen deemed that they drew near to some country;"

28 "And sounded, and found it twenty fathoms: and when they had gone a little further, they sounded again, and found it fifteen fathoms."

29 "Then fearing lest we should have fallen upon rocks, they cast four anchors out of the stern..."

39 "And when it was day, they knew not the land..."

40 "And when they had taken up the anchors, they committed themselves unto the sea . . . and made toward shore."

41 And falling into a place where two seas met, they ran the ship aground; and the forepart stuck fast, and remained unmoveable, but the hinder part was broken with the violence of the waves.

Verse 39 states that "they knew not the land" indicating that their knowledge of sea was obtained from the experiences of others as well as the memory of having been there before. Sailing directions called a periplus did exist by the First Century A.D. giving general coastal configurations. Commercially available charts of the depths of the sea and surrounding coast would not be available for almost another thousand years.

Early modern period

Up to this point, bathymetric charts were rare as mariners continued to rely on heavy ropes and lead weights to take depth readings and chart the open ocean. Minor advances in the surveying and depth charting of the oceans occurred in the 200 years since Columbus sailed to the Americas. In 1647, Robert Dudley published the atlas, 'Dell'Arcano del Mare' (Secrets of the Sea). His work far outpaced anything that had been published previously with maps and charts constructed in the Mercator projection as well as containing some of the first charts to show printed depths on the North American Atlantic Seaboard. His publication provided the groundwork for future mariners and inventors to continue to develop new and inventive ways to produce high quality charts and surveys of the world's lakes and oceans.

Comparison with hydrographic chart

A bathymetric chart differs from a hydrographic chart in that accurate presentation of the underwater features is the goal, while safe navigation is the requirement for the hydrographic chart.

A hydrographic chart will obscure the actual features to present a simplified version to help mariners avoid underwater hazards.

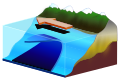
Joining a bathymetric chart and topographic map

In an ideal case, the joining of a bathymetric chart and topographic map of the same scale and projection of the same geographic area would be seamless. The only difference would be that the values begin increasing after crossing the zero at the designated sea level datum. Thus the topographic map's mountains have the greatest values while the bathymetric chart's greatest depths have the greatest values.

Simply put, the bathymetric chart is intended to show the land if overlying waters were removed in exactly the same manner as the topographic map.

Within hydrography

Bathymetric surveys are a subset of the science of hydrography. They differ slightly from the surveys required to create the product of hydrography in its more limited application and as conducted by the national and international agencies tasked with producing charts and publications for safe navigation. That chart product is more accurately termed a navigation or hydrographic chart with a strong bias toward the presentation of essential safety information.

Bathymetric surveys

First printed map of oceanic bathymetry, published by Matthew Fontaine Maury with data from USS Dolphin (1853) Rear map.jpg
First printed map of oceanic bathymetry, published by Matthew Fontaine Maury with data from USS Dolphin (1853)

Originally, bathymetry involved the measurement of ocean depth through depth sounding. Early techniques used pre-measured heavy rope or cable lowered over a ship's side. [6] This technique measures the depth only a singular point at a time, and is therefore inefficient. It is also subject to movements of the ship and currents moving the line out of true and therefore is not accurate.

The data used to make bathymetric maps today typically comes from an echosounder (sonar) mounted beneath or over the side of a boat, "pinging" a beam of sound downward at the seafloor or from remote sensing LIDAR or LADAR systems. [7] The amount of time it takes for the sound or light to travel through the water, bounce off the seafloor, and return to the sounder informs the equipment of the distance to the seafloor. LIDAR/LADAR surveys are usually conducted by airborne systems.

The seafloor topography near the Puerto Rico Trench Atlantic-trench.JPG
The seafloor topography near the Puerto Rico Trench
Present-day Earth bathymetry (and altimetry). Data from the National Centers for Environmental Information's TerrainBase Digital Terrain Model. AYool topography 15min.png
Present-day Earth bathymetry (and altimetry). Data from the National Centers for Environmental Information's TerrainBase Digital Terrain Model.

Starting in the early 1930s, single-beam sounders were used to make bathymetry maps. Today, multibeam echosounders (MBES) are typically used, which use hundreds of very narrow adjacent beams (typically 256) arranged in a fan-like swath of typically 90 to 170 degrees across. The tightly packed array of narrow individual beams provides very high angular resolution and accuracy. In general, a wide swath, which is depth dependent, allows a boat to map more seafloor in less time than a single-beam echosounder by making fewer passes. The beams update many times per second (typically 0.1–50 Hz depending on water depth), allowing faster boat speed while maintaining 100% coverage of the seafloor. Attitude sensors allow for the correction of the boat's roll and pitch on the ocean surface, and a gyrocompass provides accurate heading information to correct for vessel yaw. (Most modern MBES systems use an integrated motion-sensor and position system that measures yaw as well as the other dynamics and position.) A boat-mounted Global Positioning System (GPS) (or other Global Navigation Satellite System (GNSS)) positions the soundings with respect to the surface of the earth. Sound speed profiles (speed of sound in water as a function of depth) of the water column correct for refraction or "ray-bending" of the sound waves owing to non-uniform water column characteristics such as temperature, conductivity, and pressure. A computer system processes all the data, correcting for all of the above factors as well as for the angle of each individual beam. The resulting sounding measurements are then processed either manually, semi-automatically or automatically (in limited circumstances) to produce a map of the area. As of 2010 a number of different outputs are generated, including a sub-set of the original measurements that satisfy some conditions (e.g., most representative likely soundings, shallowest in a region, etc.) or integrated Digital Terrain Models (DTM) (e.g., a regular or irregular grid of points connected into a surface). Historically, selection of measurements was more common in hydrographic applications while DTM construction was used for engineering surveys, geology, flow modeling, etc. Since c.2003–2005, DTMs have become more accepted in hydrographic practice.

Satellites are also used to measure bathymetry. Satellite radar maps deep-sea topography by detecting the subtle variations in sea level caused by the gravitational pull of undersea mountains, ridges, and other masses. On average, sea level is higher over mountains and ridges than over abyssal plains and trenches. [8]

In the United States the United States Army Corps of Engineers performs or commissions most surveys of navigable inland waterways, while the National Oceanic and Atmospheric Administration (NOAA) performs the same role for ocean waterways. Coastal bathymetry data is available from NOAA's National Geophysical Data Center (NGDC), [9] which is now merged into National Centers for Environmental Information. Bathymetric data is usually referenced to tidal vertical datums. [10] For deep-water bathymetry, this is typically Mean Sea Level (MSL), but most data used for nautical charting is referenced to Mean Lower Low Water (MLLW) in American surveys, and Lowest Astronomical Tide (LAT) in other countries. Many other datums are used in practice, depending on the locality and tidal regime.

Occupations or careers related to bathymetry include the study of oceans and rocks and minerals on the ocean floor, and the study of underwater earthquakes or volcanoes. The taking and analysis of bathymetric measurements is one of the core areas of modern hydrography, and a fundamental component in ensuring the safe transport of goods worldwide. [6]

STL 3D model of Earth without liquid water with 20x elevation exaggeration Earth dry elevation.stl
STL 3D model of Earth without liquid water with 20× elevation exaggeration

See also

Related Research Articles

<span class="mw-page-title-main">Challenger Deep</span> Deepest-known point of Earths seabed

The Challenger Deep is the deepest known point of the seabed of Earth, located in the western Pacific Ocean at the southern end of the Mariana Trench, in the ocean territory of the Federated States of Micronesia. According to the GEBCO Gazetteer of Undersea Feature Names the depression's depth is 10,920 ± 10 m (35,827 ± 33 ft) at 11°22.4′N142°35.5′E, although its exact geodetic location remains inconclusive and its depth has been measured at 10,902–10,929 m (35,768–35,856 ft) by deep-diving submersibles, remotely operated underwater vehicles, benthic landers, and sonar bathymetry. The differences in depth estimates and their geodetic positions are scientifically explainable by the difficulty of researching such deep locations.

<span class="mw-page-title-main">Hydrography</span> Applied science of measurement and description of physical features of bodies of water

Hydrography is the branch of applied sciences which deals with the measurement and description of the physical features of oceans, seas, coastal areas, lakes and rivers, as well as with the prediction of their change over time, for the primary purpose of safety of navigation and in support of all other marine activities, including economic development, security and defense, scientific research, and environmental protection.

<span class="mw-page-title-main">Echo sounding</span> Measuring the depth of water by transmitting sound waves into water and timing the return

Echo sounding or depth sounding is the use of sonar for ranging, normally to determine the depth of water (bathymetry). It involves transmitting acoustic waves into water and recording the time interval between emission and return of a pulse; the resulting time of flight, along with knowledge of the speed of sound in water, allows determining the distance between sonar and target. This information is then typically used for navigation purposes or in order to obtain depths for charting purposes.

<span class="mw-page-title-main">Hydrographic survey</span> Science of measurement and description of features which affect maritime activities

Hydrographic survey is the science of measurement and description of features which affect maritime navigation, marine construction, dredging, offshore wind farms, offshore oil exploration and drilling and related activities. Surveys may also be conducted to determine the route of subsea cables such as telecommunications cables, cables associated with wind farms, and HVDC power cables. Strong emphasis is placed on soundings, shorelines, tides, currents, seabed and submerged obstructions that relate to the previously mentioned activities. The term hydrography is used synonymously to describe maritime cartography, which in the final stages of the hydrographic process uses the raw data collected through hydrographic survey into information usable by the end user.

<span class="mw-page-title-main">Nautical chart</span> Topographic map of a maritime area and adjacent coastal regions

A nautical chart or hydrographic chart is a graphic representation of a sea region or water body and adjacent coasts or banks. Depending on the scale of the chart, it may show depths of water (bathymetry) and heights of land (topography), natural features of the seabed, details of the coastline, navigational hazards, locations of natural and human-made aids to navigation, information on tides and currents, local details of the Earth's magnetic field, and human-made structures such as harbours, buildings, and bridges. Nautical charts are essential tools for marine navigation; many countries require vessels, especially commercial ships, to carry them. Nautical charting may take the form of charts printed on paper or computerized electronic navigational charts. Recent technologies have made available paper charts which are printed "on demand" with cartographic data that has been downloaded to the commercial printing company as recently as the night before printing. With each daily download, critical data such as Local Notices to Mariners are added to the on-demand chart files so that these charts are up to date at the time of printing.

Piloting or pilotage is the process of navigating on water or in the air using fixed points of reference on the sea or on land, usually with reference to a nautical chart or aeronautical chart to obtain a fix of the position of the vessel or aircraft with respect to a desired course or location. Horizontal fixes of position from known reference points may be obtained by sight or by radar. Vertical position may be obtained by depth sounder to determine depth of the water body below a vessel or by altimeter to determine an aircraft's altitude, from which its distance above the ground can be deduced. Piloting a vessel is usually practiced close to shore or on inland waterways. Pilotage of an aircraft is practiced under visual meteorological conditions for flight.

<span class="mw-page-title-main">Canadian Hydrographic Service</span> Part of the federal department of Fisheries and Oceans Canada

The Canadian Hydrographic Service (CHS) is part of the federal department of Fisheries and Oceans Canada and is Canada's authoritative hydrographic office. The CHS represents Canada in the International Hydrographic Organization (IHO).

<span class="mw-page-title-main">Bathymetry</span> Study of underwater depth of lake or ocean floors

Bathymetry is the study of underwater depth of ocean floors, lake floors, or river floors. In other words, bathymetry is the underwater equivalent to hypsometry or topography. The first recorded evidence of water depth measurements are from Ancient Egypt over 3000 years ago. Bathymetric charts, are typically produced to support safety of surface or sub-surface navigation, and usually show seafloor relief or terrain as contour lines and selected depths (soundings), and typically also provide surface navigational information. Bathymetric maps may also use a Digital Terrain Model and artificial illumination techniques to illustrate the depths being portrayed. The global bathymetry is sometimes combined with topography data to yield a global relief model. Paleobathymetry is the study of past underwater depths.

<span class="mw-page-title-main">Multibeam echosounder</span> Type of sonar used to map the seabed

A multibeam echosounder (MBES) is a type of sonar that is used to map the seabed. It emits acoustic waves in a fan shape beneath its transceiver. The time it takes for the sound waves to reflect off the seabed and return to the receiver is used to calculate the water depth. Unlike other sonars and echo sounders, MBES uses beamforming to extract directional information from the returning soundwaves, producing a swathe of depth soundings from a single ping.

NOAAS <i>Thomas Jefferson</i>

NOAAS Thomas Jefferson is a National Oceanic and Atmospheric Administration (NOAA) hydrographic survey vessel in service since 2003. The ship was built for the United States Navy as USNS Littlehales (T-AGS-52) serving as one of two new coastal hydrographic survey vessels from 1992 until transfer to NOAA in 2003 when it was named after Founding Father and third U.S. president, Thomas Jefferson.

Acoustic seabed classification is the partitioning of a seabed acoustic image into discrete physical entities or classes. This is a particularly active area of development in the field of seabed mapping, marine geophysics, underwater acoustics and benthic habitat mapping. Seabed classification is one route to characterizing the seabed and its habitats. Seabed characterization makes the link between the classified regions and the seabed physical, geological, chemical or biological properties. Acoustic seabed classification is possible using a wide range of acoustic imaging systems including multibeam echosounders, sidescan sonar, single-beam echosounders, interferometric systems and sub-bottom profilers. Seabed classification based on acoustic properties can be divided into two main categories; surficial seabed classification and sub-surface seabed classification. Sub-surface imaging technologies use lower frequency sound to provide higher penetration, whereas surficial imaging technologies provide higher resolution imagery by utilizing higher frequencies.

The General Bathymetric Chart of the Oceans (GEBCO) is a publicly available bathymetric chart of the world's oceans. The project was conceived with the aim of preparing a global series of charts showing the general shape of the seafloor. Over the years it has become a reference map of the bathymetry of the world's oceans for scientists and others.

<span class="mw-page-title-main">Fisheries acoustics</span>

Fisheries acoustics includes a range of research and practical application topics using acoustical devices as sensors in aquatic environments. Acoustical techniques can be applied to sensing aquatic animals, zooplankton, and physical and biological habitat characteristics.

USS <i>Mobjack</i> Tender of the United States Navy

USS Mobjack (AVP-27/AGP-7) was a motor torpedo boat tender in commission in the United States Navy from 1943 to 1946. She saw service in the Pacific theater during the latter portion of World War II.

NOAAS <i>Peirce</i>

NOAAS Peirce, was an American survey ship that was in commission in the National Oceanic and Atmospheric Administration (NOAA) from 1970 to 1992. Previously, she had been in commission in the United States Coast and Geodetic Survey from 1963 to 1970 as USC&GS Peirce.

<span class="mw-page-title-main">Global relief model</span> Model of Earths relief including elevation and depth underwater

A global relief model, sometimes also denoted as global topography model or composite model, combines digital elevation model (DEM) data over land with digital bathymetry model (DBM) data over water-covered areas to describe Earth's relief. A relief model thus shows how Earth's surface would look like in the absence of water or ice masses.

In hydrography, the Navigation Surface paradigm represents an alternative to traditional approaches to manage bathymetric data by creating bathymetric databases that can be used to generate high-resolution navigation aids and other applications.

<span class="mw-page-title-main">Underwater survey</span> Inspection or measurement in or of an underwater environment

An underwater survey is a survey performed in an underwater environment or conducted remotely on an underwater object or region. Survey can have several meanings. The word originates in Medieval Latin with meanings of looking over and detailed study of a subject. One meaning is the accurate measurement of a geographical region, usually with the intention of plotting the positions of features as a scale map of the region. This meaning is often used in scientific contexts, and also in civil engineering and mineral extraction. Another meaning, often used in a civil, structural, or marine engineering context, is the inspection of a structure or vessel to compare actual condition with the specified nominal condition, usually with the purpose of reporting on the actual condition and compliance with, or deviations from, the nominal condition, for quality control, damage assessment, valuation, insurance, maintenance, and similar purposes. In other contexts it can mean inspection of a region to establish presence and distribution of specified content, such as living organisms, either to establish a baseline, or to compare with a baseline.

<span class="mw-page-title-main">Underwater exploration</span> Investigating or traveling around underwater for the purpose of discovery

Underwater exploration is the exploration of any underwater environment, either by direct observation by the explorer, or by remote observation and measurement under the direction of the investigators. Systematic, targeted exploration is the most effective method to increase understanding of the ocean and other underwater regions, so they can be effectively managed, conserved, regulated, and their resources discovered, accessed, and used. Less than 10% of the ocean has been mapped in any detail, less has been visually observed, and the total diversity of life and distribution of populations is similarly obscure.

<span class="mw-page-title-main">International Bathymetric Chart of the Southern Ocean</span> Publicly available bathymetric chart of the Southern Ocean

The International Bathymetric Chart of the Southern Ocean (IBCSO) is a regional mapping initiative of the General Bathymetric Chart of the Oceans (GEBCO). IBSCO receives support from the Nippon Foundation – GEBCO Seabed 2030 Project.

References

  1. "Bathymetric map". Encyclopedia Britannica. Retrieved 2019-12-17.
  2. "bathymetry". National Geographic Society. 2011-03-24. Retrieved 2019-12-17.
  3. Hamden, Mohammad Hanif; Md Din, Ami Hassan (2018-07-31). "A review of advancement of hydrographic surveying towards ellipsoidal referenced surveying technique". IOP Conference Series: Earth and Environmental Science. 169 (1): 012019. doi: 10.1088/1755-1315/169/1/012019 . ISSN   1755-1315.
  4. "NOAA History - Tools of the Trade/Surveying and Mapping/Sounding Pole to Sea Beam". www.history.noaa.gov. Archived from the original on 2019-12-17. Retrieved 2019-12-17.
  5. "Acts 27". www.churchofjesuschrist.org. Retrieved 2019-12-17.
  6. 1 2 Audrey, Furlong (November 7, 2018). "NGA Explains: What is hydrography?". National Geospatial-Intelligence Agency via YouTube.
  7. Olsen, R. C. (2007), Remote Sensing from Air and Space (PDF), SPIE, ISBN   978-0-8194-6235-0
  8. Thurman, H. V. (1997), Introductory Oceanography, New Jersey, USA: Prentice Hall College, ISBN   0-13-262072-3
  9. "Bathymetry and Global Relief". www.ngdc.noaa.gov. NOAA National Centers for Environmental Information. Retrieved 8 July 2022.
  10. "Coastal Elevation Models". www.ngdc.noaa.gov. NOAA National Centers for Environmental Information. 15 September 2020. Retrieved 8 July 2022.