Tide gauge

Last updated
A tide gauge Tidal gauge dsc06189.jpg
A tide gauge
The tide gauge in Kronstadt, Russia Kronstadt tide gauge.JPG
The tide gauge in Kronstadt, Russia

A tide gauge is a device for measuring the change in sea level relative to a vertical datum.[ citation needed ] It is also known as a mareograph, [2] marigraph, [3] sea-level recorder [4] and limnimeter. [5] When applied to freshwater continental water bodies, the instrument may also be called a limnimeter. [6]

Contents

Operation

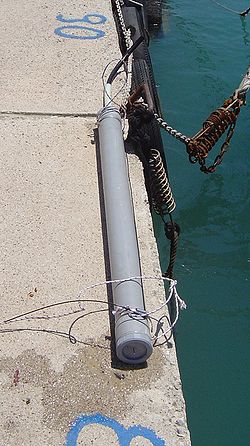
Sensors continuously record the height of the water level with respect to a height reference surface close to the geoid. Water enters the device by the bottom pipe (far end of the tube, see picture), and electronic sensors measure its height and send the data to a tiny computer.[ citation needed ]

Historical data are available for about 1,450 stations worldwide, of which about 950 have provided updates to the global data center since January 2010. [7] At some places records cover centuries, for example in Amsterdam where data dating back to 1700 is available. [8]

When it comes to estimating the greater ocean picture, new modern tide gauges can often be improved upon by using satellite data.[ citation needed ]

Tide gauges are used to measure tides and quantify the size of tsunamis. The measurements make it possible to derive the mean sea level. Using this method, sea level slopes up to several 0.1 m/1000 km and more have been detected.[ citation needed ]

A tsunami can be detected when the sea level begins to rise, although warnings from seismic activity can be more useful.[ citation needed ]

History

Sea-level measurements were made using simple measuring poles or "tide staffs" until around 1830, when self-recording gauges with mechanical floats and stilling wells were introduced. [9]

Tidal poles and float gauges were the primary means of sea-level measurement for over 150 years and continue to operate at some locations today. While still part of modern-day tide gauge instrumentation, these technologies have since been superseded by pressure gauges (similar to depth gauges), acoustic/ultrasonic gauges, and radar gauges.[ citation needed ]

The following types of tide gauges have been used historically: [10]

Common applications

Interior view of Cascais Tide Gauge showing data recording equipment CascaisTideGauge Interior.jpg
Interior view of Cascais Tide Gauge showing data recording equipment

Tide gauges have a practical application in the shipping and fishing industries where low or high tide levels can hinder or prohibit access to shallow bays or locations with bridges. An example is the Cascais tide gauge in Portugal, which was originally installed because of the sand bar in the River Tagus that causes difficulties for shipping entering Lisbon port. Because of similar problems many industries have installed private tide gauges in ports around the world, and also rely on government agencies (such as NOAA).

Data collected from tide gauges is also of interest to scientists measuring global weather patterns, the mean sea water level, and trends - notably those potentially associated with global warming.

Modern gauges

In recent years new technologies have developed allowing for real-time, remote tide information to be published online via a solar powered wireless connection to a tide sensor. Acoustic/ultrasonic sensors [11] have already been deployed to great effect and the data is regularly broadcast via Twitter and also displayed online. [12]

See also

Related Research Articles

<span class="mw-page-title-main">Anemometer</span> Instrument for measuring wind speed

In meteorology, an anemometer is a device that measures wind speed and direction. It is a common instrument used in weather stations. The earliest known description of an anemometer was by Italian architect and author Leon Battista Alberti (1404–1472) in 1450.

<span class="mw-page-title-main">Pressure measurement</span> Analysis of force applied by a fluid on a surface

Pressure measurement is the measurement of an applied force by a fluid on a surface. Pressure is typically measured in units of force per unit of surface area. Many techniques have been developed for the measurement of pressure and vacuum. Instruments used to measure and display pressure mechanically are called pressure gauges,vacuum gauges or compound gauges. The widely used Bourdon gauge is a mechanical device, which both measures and indicates and is probably the best known type of gauge.

<span class="mw-page-title-main">Tsunami</span> Series of water waves caused by the displacement of a large volume of a body of water

A tsunami is a series of waves in a water body caused by the displacement of a large volume of water, generally in an ocean or a large lake. Earthquakes, volcanic eruptions and other underwater explosions above or below water all have the potential to generate a tsunami. Unlike normal ocean waves, which are generated by wind, or tides, which are in turn generated by the gravitational pull of the Moon and the Sun, a tsunami is generated by the displacement of water from a large event.

<span class="mw-page-title-main">Sea level</span> Geographical reference point from which various heights are measured

Mean sea level is an average surface level of one or more among Earth's coastal bodies of water from which heights such as elevation may be measured. The global MSL is a type of vertical datum – a standardised geodetic datum – that is used, for example, as a chart datum in cartography and marine navigation, or, in aviation, as the standard sea level at which atmospheric pressure is measured to calibrate altitude and, consequently, aircraft flight levels. A common and relatively straightforward mean sea-level standard is instead the midpoint between a mean low and mean high tide at a particular location.

<span class="mw-page-title-main">Stream gauge</span> Location used to monitor surface water flow

A stream gauge, streamgage or stream gauging station is a location used by hydrologists or environmental scientists to monitor and test terrestrial bodies of water. Hydrometric measurements of water level surface elevation ("stage") and/or volumetric discharge (flow) are generally taken and observations of biota and water quality may also be made. The locations of gauging stations are often found on topographical maps. Some gauging stations are highly automated and may include telemetry capability transmitted to a central data logging facility.

<span class="mw-page-title-main">Storm surge</span> Rise of water associated with a low-pressure weather system

A storm surge, storm flood, tidal surge, or storm tide is a coastal flood or tsunami-like phenomenon of rising water commonly associated with low-pressure weather systems, such as cyclones. It is measured as the rise in water level above the normal tidal level, and does not include waves.

<span class="mw-page-title-main">Bathymetry</span> Study of underwater depth of lake or ocean floors

Bathymetry is the study of underwater depth of ocean floors, lake floors, or river floors. In other words, bathymetry is the underwater equivalent to hypsometry or topography. The first recorded evidence of water depth measurements are from Ancient Egypt over 3000 years ago. Bathymetric charts, are typically produced to support safety of surface or sub-surface navigation, and usually show seafloor relief or terrain as contour lines and selected depths (soundings), and typically also provide surface navigational information. Bathymetric maps may also use a Digital Terrain Model and artificial illumination techniques to illustrate the depths being portrayed. The global bathymetry is sometimes combined with topography data to yield a global relief model. Paleobathymetry is the study of past underwater depths.

<span class="mw-page-title-main">Tsunami warning system</span> System used to detect and warn the public about impending tsunamis

A tsunami warning system (TWS) is used to detect tsunamis in advance and issue the warnings to prevent loss of life and damage to property. It is made up of two equally important components: a network of sensors to detect tsunamis and a communications infrastructure to issue timely alarms to permit evacuation of the coastal areas. There are two distinct types of tsunami warning systems: international and regional. When operating, seismic alerts are used to instigate the watches and warnings; then, data from observed sea level height are used to verify the existence of a tsunami. Other systems have been proposed to augment the warning procedures; for example, it has been suggested that the duration and frequency content of t-wave energy is indicative of an earthquake's tsunami potential.

<span class="mw-page-title-main">Deep-ocean Assessment and Reporting of Tsunamis</span> Component of an enhanced tsunami warning system

Deep-ocean Assessment and Reporting of Tsunamis (DART) is a component of an enhanced tsunami warning system.

Established in 1985, The Global Sea Level Observing System (GLOSS) is an Intergovernmental Oceanographic Commission program whose purpose is to measure sea level globally for long-term climate change studies. The program's purpose has changed since the 2004 Indian Ocean earthquake and the program now collects real time measurements of sea level. The project is currently upgrading the over 290 stations it currently runs, so that they can send real time data via satellite to newly set up national tsunami centres. They are also fitting the stations with solar panels so they can continue to operate even if the mains power supply is interrupted by severe weather. The Global Sea Level Observing System does not compete with Deep-ocean Assessment and Reporting of Tsunamis as most GLOSS transducers are located close to land masses while DART's transducers are far out in the ocean.

Level sensors detect the level of liquids and other fluids and fluidized solids, including slurries, granular materials, and powders that exhibit an upper free surface. Substances that flow become essentially horizontal in their containers because of gravity whereas most bulk solids pile at an angle of repose to a peak. The substance to be measured can be inside a container or can be in its natural form. The level measurement can be either continuous or point values. Continuous level sensors measure level within a specified range and determine the exact amount of substance in a certain place, while point-level sensors only indicate whether the substance is above or below the sensing point. Generally the latter detect levels that are excessively high or low.

<span class="mw-page-title-main">Proudman Oceanographic Laboratory</span>

The former Proudman Oceanographic Laboratory (POL) is based in Brownlow Street, Liverpool, England. In April 2010, POL merged with the National Oceanography Centre, Southampton (NOCS) to form the National Oceanography Centre. The Liverpool laboratory's scientific research focuses on oceanography encompassing global sea-levels and geodesy, numerical modelling of continental shelf seas and coastal sediment processes. This research alongside activities of surveying, monitoring, data management and forecasting provides strategic support for the wider mission of the Natural Environment Research Council.

<span class="mw-page-title-main">Ultrasonic transducer</span> Acoustic sensor

Ultrasonic transducers and ultrasonic sensors are devices that generate or sense ultrasound energy. They can be divided into three broad categories: transmitters, receivers and transceivers. Transmitters convert electrical signals into ultrasound, receivers convert ultrasound into electrical signals, and transceivers can both transmit and receive ultrasound.

<span class="mw-page-title-main">Wave radar</span> Technology for measuring surface waves on water

Wave radar is a type of radar for measuring wind waves. Several instruments based on a variety of different concepts and techniques are available, and these are all often called. This article, gives a brief description of the most common ground-based radar remote sensing techniques.

Indian National Center for Ocean Information Services (INCOIS) is an autonomous organization of the Government of India, under the Ministry of Earth Sciences, located in Pragathi Nagar, Hyderabad. ESSO-INCOIS was established as an autonomous body in 1998 under the Ministry of Earth Sciences (MoES) and is a unit of the Earth System Science Organization (ESSO). ESSO- INCOIS is mandated to provide the best possible ocean information and advisory services to society, industry, government agencies and the scientific community through sustained ocean observations and constant improvements through systematic and focussed research.

<span class="mw-page-title-main">Drifter (oceanography)</span> Oceanographic instrument package floating freely on the surface, transported by currents

A drifter is an oceanographic device floating on the surface to investigate ocean currents by tracking location. They can also measure other parameters like sea surface temperature, salinity, barometric pressure, and wave height. Modern drifters are typically tracked by satellite, often GPS. They are sometimes called Lagrangian drifters since the location of the measurements they make moves with the flow. A major user of drifters is NOAA's Global Drifter Program.

<span class="mw-page-title-main">Vertical datum</span> Reference surface for vertical positions

In geodesy, surveying, hydrography and navigation, vertical datum or altimetric datum, is a reference coordinate surface used for vertical positions, such as the elevations of Earth-bound features and altitudes of satellite orbits and in aviation. In planetary science, vertical datums are also known as zero-elevation surface or zero-level reference.

In the field of industrial ultrasonic testing, ultrasonic thickness measurement (UTM) is a method of performing non-destructive measurement (gauging) of the local thickness of a solid element based on the time taken by the ultrasound wave to return to the surface. This type of measurement is typically performed with an ultrasonic thickness gauge.

<span class="mw-page-title-main">Cascais tide gauge</span> First tide gauge installed in Portugal, also used to establish the countrys mean sea level

The Cascais tide gauge was the first tide gauge installed in Portugal and dates back to 1882. It is situated in Cascais Municipality, Lisbon District. It was one of the first systems of sea-level data collection installed on the coast of Europe and is still in use.

<span class="mw-page-title-main">Newlyn Tidal Observatory</span> British tidal observatory

Newlyn Tidal Observatory is a grade II listed tide gauge hut on the South Pier in Newlyn, Cornwall. Measurements of sea level taken at the observatory between 1915 and 1921 were used to define the reference level, Ordnance Datum Newlyn, for height measurement on the British mainland. The tide gauge has collected over 100 years of observations which has significantly contributed to studies in sea level science.

References

  1. "The Kronstadt sea-gauge". Your Guide in St Petersburg. Retrieved 26 April 2019. With explanatory diagram showing Lea-type float gauge and stilling-well.
  2. Torge, W.; Müller, J. (2012). Geodesy. De Gruyter Textbook. De Gruyter. p. 80. ISBN   978-3-11-025000-8 . Retrieved 2021-12-08.
  3. International Tsunami Information Center. "4. Tide, Mareograph, Sea Level". UNESCO. Archived from the original on 2018-07-24. Retrieved 2014-06-16.
  4. Ian Shennan; Antony J. Long; Benjamin P. Horton, eds. (2015). Handbook of Sea-Level Research. Wiley. p. 557. ISBN   978-1-118-45257-8.
  5. "Definition of LIMNIMETER". www.merriam-webster.com. Retrieved 2021-08-14.
  6. "Definition of LIMNIMETER". Merriam-Webster. 2022-10-07. Retrieved 2022-10-07.
  7. "Obtaining Tide Gauge Data". Permanent Service for Mean Sea Level. PSMSL. Retrieved 2016-03-07.
  8. "Other Long Records not in the PSMSL Data Set". PSMSL. Retrieved 2015-05-11.
  9. Tide gauge history UK National Oceanographic Centre Archived 2015-08-24 at the Wayback Machine
  10. "History of tide gauges". Tide Observation. Geospatial Information Authority of Japan. Archived from the original on 2013-01-05. Retrieved 2014-04-19.
  11. "Remote Monitoring a MaxSonar®". Archived from the original on 2012-09-03. Retrieved 2012-09-28.
  12. "ioBridge Apps - Ockway Bay Tide Levels".

Further reading