Weather buoy

Last updated

Weather buoy operated by the National Data Buoy Center NOAA-NDBC-discus-buoy.jpg
Weather buoy operated by the National Data Buoy Center

Weather buoys are instruments which collect weather and ocean data within the world's oceans, as well as aid during emergency response to chemical spills, legal proceedings, and engineering design. Moored buoys have been in use since 1951, while drifting buoys have been used since 1979. Moored buoys are connected with the ocean bottom using either chains, nylon, or buoyant polypropylene. With the decline of the weather ship, they have taken a more primary role in measuring conditions over the open seas since the 1970s. During the 1980s and 1990s, a network of buoys in the central and eastern tropical Pacific Ocean helped study the El Niño-Southern Oscillation. Moored weather buoys range from 1.5–12 metres (5–40 ft) in diameter, while drifting buoys are smaller, with diameters of 30–40 centimetres (12–16 in). Drifting buoys are the dominant form of weather buoy in sheer number, with 1250 located worldwide. Wind data from buoys has smaller error than that from ships. There are differences in the values of sea surface temperature measurements between the two platforms as well, relating to the depth of the measurement and whether or not the water is heated by the ship which measures the quantity.

Contents

History

Weather Buoy / Data Buoy / Oceanographic Buoy operated by the Marine Data Service Weather Buoy MDS.jpg
Weather Buoy / Data Buoy / Oceanographic Buoy operated by the Marine Data Service

The first known proposal for surface weather observations at sea occurred in connection with aviation in August 1927, when Grover Loening stated that "weather stations along the ocean coupled with the development of the seaplane to have an equally long range, would result in regular ocean flights within ten years." [1] Starting in 1939, United States Coast Guard vessels were being used as weather ships to protect transatlantic air commerce. [2]

During World War II The German Navy deployed weather buoys (Wetterfunkgerät See — WFS) at fifteen fixed positions in the North Atlantic and Barents Sea. They were launched from U-boats into a maximum depth of ocean of 1000 fathoms (1,800 metres), limited by the length of the anchor cable. Overall height of the body was 10.5 metres (of which most was submerged), surmounted by a mast and extendible aerial of 9 metres. Data (air and water temperature, atmospheric pressure and relative humidity) were encoded and transmitted four times a day. When the batteries (high voltage dry-cells for the valves, and nickel-iron for other power and to raise and lower the aerial mast) were exhausted, after about eight to ten weeks, the unit self-destructed. [3] [4]

The Navy Oceanographic Meteorological Automatic Device (NOMAD) buoy's 6-metre (20 ft) hull was originally designed in the 1940s for the United States Navy’s offshore data collection program. The United States Navy tested marine automatic weather stations for hurricane conditions between 1956 and 1958, though radio transmission range and battery life was limited. [5] Between 1951 and 1970, a total of 21 NOMAD buoys were built and deployed at sea. [6] Since the 1970s, weather buoy use has superseded the role of weather ships, as they are cheaper to operate and maintain. [7] The earliest reported use of drifting buoys was to study the behavior of ocean currents within the Sargasso Sea in 1972 and 1973. [8] Drifting buoys have been used increasingly since 1979, and as of 2005, 1250 drifting buoys roamed the Earth's oceans. [9]

Between 1985 and 1994, an extensive array of moored and drifting buoys was deployed across the equatorial Pacific Ocean to monitor and help predict the El Niño phenomenon. [10] Hurricane Katrina capsized a 10 m (33 ft) buoy for the first time in the history of the National Data Buoy Center (NDBC) on August 28, 2005. [11] On June 13, 2006, drifting buoy 26028 ended its long-term data collection of sea surface temperature after transmitting for 10 years, 4 months, and 16 days, which is the longest known data collection time for any drifting buoy. [12] The first weather buoy in the Southern Ocean was deployed by the Integrated Marine Observing System (IMOS) on March 17, 2010. [13]

Instrumentation

Weather buoys, like other types of weather stations, measure parameters such as air temperature above the ocean surface, wind speed (steady and gusting), barometric pressure, and wind direction. Since they lie in oceans and lakes, they also measure water temperature, wave height, and dominant wave period. [14] Raw data is processed and can be logged on board the buoy and then transmitted via radio, cellular, or satellite communications to meteorological centers for use in weather forecasting and climate study. Both moored buoys and drifting buoys (drifting in the open ocean currents) are used. Fixed buoys measure the water temperature at a depth of 3 metres (9.8 ft). [15] Many different drifting buoys exist around the world that vary in design and the location of reliable temperature sensors varies. These measurements are beamed to satellites for automated and immediate data distribution. [15] Other than their use as a source of meteorological data, their data is used within research programs, emergency response to chemical spills, legal proceedings, and engineering design. [14] Moored weather buoys can also act as a navigational aid, like other types of buoys.

Types

Types of moored buoys used by the National Data Buoy Center Mooredbuoytypes.gif
Types of moored buoys used by the National Data Buoy Center

Weather buoys range in diameter from 1.5–12 metres (5–40 ft). Those that are placed in shallow waters are smaller in size and moored using only chains, while those in deeper waters use a combination of chains, nylon, and buoyant polypropylene. [14] Since they do not have direct navigational significance, moored weather buoys are classed as special marks under the IALA scheme, are coloured yellow, and display a yellow flashing light at night.

Discus buoys are round and moored in deep ocean locations, with a diameter of 10–12 metres (33–39 ft). [16] [17] The aluminum 3-metre (10 ft) buoy is a very rugged meteorological ocean platform that has long term survivability. The expected service life of the 3-metre (10 ft) platform is in excess of 20 years and properly maintained, these buoys have not been retired due to corrosion. The NOMAD is a unique moored aluminum environmental monitoring buoy designed for deployments in extreme conditions near the coast and across the Great Lakes. [16] NOMADs moored off the Atlantic Canadian coast commonly experience winter storms with maximum wave heights approaching 20 metres (66 ft) into the Gulf of Maine.

12-meter discus buoys 12-meter discus buoys.jpg
12-meter discus buoys
Drifting Buoy (DBi) SVP-B.jpg
Drifting Buoy (DBi)

Drifting buoys are smaller than their moored counterparts, measuring 30–40 centimetres (12–16 in) in diameter. They are made of plastic or fiberglass, and tend to be either bi-colored, with white on one half and another color on the other half of the float, or solidly black or blue. It measures a smaller subset of meteorological variables when compared to its moored counterpart, with a barometer measuring pressure in a tube on its top. They have a thermistor (metallic thermometer) on its base, and an underwater drogue, or sea anchor, located 15 metres (49 ft) below the ocean surface connected with the buoy by a long, thin tether. [18]

Deployment and maintenance

NOAA buoy in storage, Homer, Alaska Noaabouy.jpg
NOAA buoy in storage, Homer, Alaska

A large network of coastal buoys near the United States is maintained by the National Data Buoy Center, [19] with deployment and maintenance performed by the United States Coast Guard. [20] For South Africa, the South African Weather Service deploys and retrieves their own buoys, while the Meteorological Service of New Zealand performs the same task for their country. [21] Environment Canada operates and deploys buoys for their country. [22] The Met Office in Great Britain deploys drifting buoys across both the northern and southern Atlantic oceans. [23]

Comparison to data from ships

Wind reports from moored buoys have smaller error than those from ships. Complicating the comparison of the two measurements are that NOMAD buoys report winds at a height of 5 metres (16 ft), while ships report winds from a height of 20–40 metres (66–131 ft). [24] Sea surface temperature measured in the intake port of large ships have a warm bias of around 0.6 °C (1 °F) due to the heat of the engine room. [25] Since 2000 sea-surface temperatures have increasingly been measured by thermometers on buoys; the apparent cooler temperatures led to an underestimation of global warming since 2000. [26] Fixed buoys measure the water temperature at a depth of 3 metres (10 ft). [15]

Related Research Articles

<span class="mw-page-title-main">Buoy</span> Floating structure or device

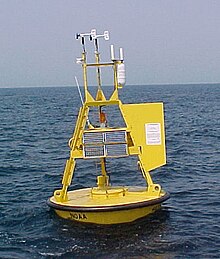
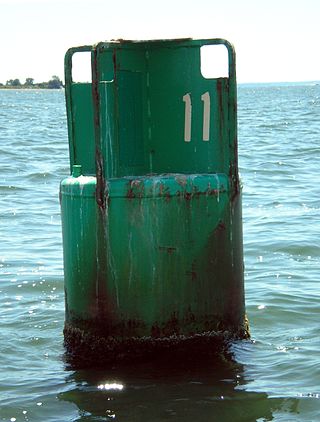
A buoy is a floating device that can have many purposes. It can be anchored (stationary) or allowed to drift with ocean currents.

<span class="mw-page-title-main">Weather station</span> Facility for atmospheric research and prediction

A weather station is a facility, either on land or sea, with instruments and equipment for measuring atmospheric conditions to provide information for weather forecasts and to study the weather and climate. The measurements taken include temperature, atmospheric pressure, humidity, wind speed, wind direction, and precipitation amounts. Wind measurements are taken with as few other obstructions as possible, while temperature and humidity measurements are kept free from direct solar radiation, or insolation. Manual observations are taken at least once daily, while automated measurements are taken at least once an hour. Weather conditions out at sea are taken by ships and buoys, which measure slightly different meteorological quantities such as sea surface temperature (SST), wave height, and wave period. Drifting weather buoys outnumber their moored versions by a significant amount.

<span class="mw-page-title-main">Sea surface temperature</span> Water temperature close to the oceans surface

Sea surface temperature (SST), or ocean surface temperature, is the ocean temperature close to the surface. The exact meaning of surface varies according to how we measure it. It is between 1 millimetre (0.04 in) and 20 metres (70 ft) below the sea surface. Sea surface temperatures greatly modify air masses in the Earth's atmosphere within a short distance of the shore. Local areas of heavy snow can form in bands downwind of warm water bodies within an otherwise cold air mass. Warm sea surface temperatures can develop and strengthen cyclones over the Ocean. Experts call this process tropical cyclogenesis. Tropical cyclones can also cause a cool wake. This is due to turbulent mixing of the upper 30 metres (100 ft) of the ocean. Sea surface temperature changes during the day. This is like the air above it, but to a lesser degree. There is less variation in sea surface temperature on breezy days than on calm days. Ocean currents, such as the Atlantic Multidecadal Oscillation, can affect sea surface temperatures over several decades. Thermohaline circulation has a major impact on average sea surface temperature throughout most of the world's oceans.

<span class="mw-page-title-main">Weather ship</span> Ship used to aid weather forecasting

A weather ship, or ocean station vessel, was a ship stationed in the ocean for surface and upper air meteorological observations for use in weather forecasting. They were primarily located in the north Atlantic and north Pacific oceans, reporting via radio. The vessels aided in search and rescue operations, supported transatlantic flights, acted as research platforms for oceanographers, monitored marine pollution, and aided weather forecasting by weather forecasters and in computerized atmospheric models. Research vessels remain heavily used in oceanography, including physical oceanography and the integration of meteorological and climatological data in Earth system science.

<span class="mw-page-title-main">Survey vessel</span> Type of research vessel

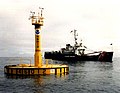
A survey vessel is any type of ship or boat that is used for underwater surveys, usually to collect data for mapping or planning underwater construction or mineral extraction. It is a type of research vessel, and may be designed for the purpose, modified for the purpose or temporarily put into the service as a vessel of opportunity, and may be crewed, remotely operated, or autonomous. The size and equipment vary to suit the task and availability.

<span class="mw-page-title-main">National Data Buoy Center</span>

The National Data Buoy Center (NDBC) is a part of the National Oceanic and Atmospheric Administration's (NOAA) National Weather Service (NWS). NDBC designs, develops, operates, and maintains a network of data collecting buoys and coastal stations. The NDBC is located in southern Mississippi as a tenant at the John C. Stennis Space Center, a National Aeronautics and Space Administration (NASA) facility.

The World Ocean Circulation Experiment (WOCE) was a component of the international World Climate Research Program, and aimed to establish the role of the World Ocean in the Earth's climate system. WOCE's field phase ran between 1990 and 1998, and was followed by an analysis and modeling phase that ran until 2002. When the WOCE was conceived, there were three main motivations for its creation. The first of these is the inadequate coverage of the World Ocean, specifically in the Southern Hemisphere. Data was also much more sparse during the winter months than the summer months, and there was—and still is to some extent—a critical need for data covering all seasons. Secondly, the data that did exist was not initially collected for studying ocean circulation and was not well suited for model comparison. Lastly, there were concerns involving the accuracy and reliability of some measurements. The WOCE was meant to address these problems by providing new data collected in ways designed to "meet the needs of global circulation models for climate prediction."

A mooring in oceanography is a collection of devices connected to a wire and anchored on the sea floor. It is the Eulerian way of measuring ocean currents, since a mooring is stationary at a fixed location. In contrast to that, the Lagrangian way measures the motion of an oceanographic drifter, the Lagrangian drifter.

<span class="mw-page-title-main">Surface weather observation</span> Fundamental data used for weather forecasts

Surface weather observations are the fundamental data used for safety as well as climatological reasons to forecast weather and issue warnings worldwide. They can be taken manually, by a weather observer, by computer through the use of automated weather stations, or in a hybrid scheme using weather observers to augment the otherwise automated weather station. The ICAO defines the International Standard Atmosphere (ISA), which is the model of the standard variation of pressure, temperature, density, and viscosity with altitude in the Earth's atmosphere, and is used to reduce a station pressure to sea level pressure. Airport observations can be transmitted worldwide through the use of the METAR observing code. Personal weather stations taking automated observations can transmit their data to the United States mesonet through the Citizen Weather Observer Program (CWOP), the UK Met Office through their Weather Observations Website (WOW), or internationally through the Weather Underground Internet site. A thirty-year average of a location's weather observations is traditionally used to determine the station's climate. In the US a network of Cooperative Observers make a daily record of summary weather and sometimes water level information.

<span class="mw-page-title-main">Ocean Prediction Center</span> One of the National Centers for Environmental Predictions service centers

The Ocean Prediction Center (OPC), established in 1995, is one of the National Centers for Environmental Prediction's (NCEP's) original six service centers. Until 2003, the name of the organization was the Marine Prediction Center. Its origins are traced back to the sinking of the RMS Titanic in 1912. The OPC issues forecasts up to five days in advance for ocean areas north of 31° north latitude and west of 35° west longitude in the Atlantic, and across the northeast Pacific north of 30° north latitude and east of 160° east longitude. Until recently, the OPC provided forecast points for tropical cyclones north of 20° north latitude and east of the 60° west longitude to the National Hurricane Center. OPC is composed of two branches: the Ocean Forecast Branch and the Ocean Applications Branch.

The following are considered ocean essential climate variables (ECVs) by the Ocean Observations Panel for Climate (OOPC) that are currently feasible with current observational systems.

<span class="mw-page-title-main">International Comprehensive Ocean-Atmosphere Data Set</span>

The International Comprehensive Ocean-Atmosphere Data Set (ICOADS) is a digital database of 261 million weather observations made by ships, weather ships, and weather buoys spanning the years 1662 to 2007. The database was initially constructed in 1985 and continues to be expanded upon and updated on a regular basis. From the original data, gridded datasets were created. ICOADS information has been useful in determining the reliability of ship and buoy wind measurements, helping to determine temperature trends in the sea surface temperature field, and updating the Atlantic hurricane database.

<span class="mw-page-title-main">Weather reconnaissance</span>

Weather reconnaissance is the acquisition of weather data used for research and planning. Typically the term reconnaissance refers to observing weather from the air, as opposed to the ground.

The Tropical Atmosphere Ocean (TAO) project is a major international effort that instrumented the entire tropical Pacific Ocean with approximately 70 deep ocean moorings. The development of the TAO array in 1985 was motivated by the 1982-1983 El Niño event and ultimately designed for the study of year-to-year climate variations related to El Niño and the Southern Oscillation (ENSO). Led by the TAO Project Office of the Pacific Marine Environmental Laboratory (PMEL), the full array of 70 moorings was completed in 1994.

The Research Moored Array for African-Asian-Australian Monsoon Analysis and Prediction (RAMA) is a system of moored observation buoys in the Indian Ocean that collects meteorological and oceanographic data. The data collected by RAMA will greatly enhance the ability of scientists to understand climatic events and predict monsoon events. Climatic and oceanic events in the Indian Ocean affect weather and climate throughout the rest of the world, so RAMA will support weather forecasting and climate research worldwide. Although widely supported internationally, the system has only been partially implemented due to pirate activity off the coast of Somalia.

<span class="mw-page-title-main">Marine weather forecasting</span> Forecasts of weather conditions at sea

Marine weather forecasting is the process by which mariners and meteorological organizations attempt to forecast future weather conditions over the Earth's oceans. Mariners have had rules of thumb regarding the navigation around tropical cyclones for many years, dividing a storm into halves and sailing through the normally weaker and more navigable half of their circulation. Marine weather forecasts by various weather organizations can be traced back to the sinking of the Royal Charter in 1859 and the RMS Titanic in 1912.

<span class="mw-page-title-main">Prediction and Research Moored Array in the Atlantic</span> System of moored observation buoys

The Prediction and Research Moored Array in the Atlantic (PIRATA) is a system of moored observation buoys in the tropical Atlantic Ocean which collect meteorological and oceanographic data. The data collected by the PIRATA array helps scientists to better understand climatic events in the Tropical Atlantic and to improve weather forecasting and climate research worldwide. Climatic and oceanic events in the tropical Atlantic, such as the Tropical Atlantic SST Dipole affect rainfall and climate in both West Africa and Northeast Brazil. The northern tropical Atlantic is also a major formation area for hurricanes affecting the West Indies and the United States. Alongside the RAMA array in the Indian Ocean and the TAO/TRITON network in the Pacific Ocean, PIRATA forms part of the worldwide system of tropical ocean observing buoys.

<span class="mw-page-title-main">Global Drifter Program</span> Program measuring ocean currents, temperatures and atmospheric pressure using drifters

The Global Drifter Program (GDP) was conceived by Prof. Peter Niiler, with the objective of collecting measurements of surface ocean currents, sea surface temperature and sea-level atmospheric pressure using drifters. It is the principal component of the Global Surface Drifting Buoy Array, a branch of NOAA's Global Ocean Observations and a scientific project of the Data Buoy Cooperation Panel (DBCP). The project originated in February 1979 as part of the TOGA/Equatorial Pacific Ocean Circulation Experiment (EPOCS) and the first large-scale deployment of drifters was in 1988 with the goal of mapping the tropical Pacific Ocean's surface circulation. The current goal of the project is to use 1250 satellite-tracked surface drifting buoys to make accurate and globally dense in-situ observations of mixed layer currents, sea surface temperature, atmospheric pressure, winds and salinity, and to create a system to process the data. Horizontal transports in the oceanic mixed layer measured by the GDP are relevant to biological and chemical processes as well as physical ones.

<span class="mw-page-title-main">Navy oceanographic meteorological automatic device</span>

The Navy oceanographic meteorological automatic device (NOMAD) is an anchored automated weather station developed shortly after World War II and still used today.

An ocean data acquisition system (ODAS) is a set of instruments deployed at sea to collect as much meteorological and oceanographic data as possible. With their sensors, these systems deliver data both on the state of the ocean itself and the surrounding lower atmosphere. The use of microelectronics and technologies with efficient energy consumption allows to increase the types and numbers of sensor deployed on a single device.

References

  1. George Lee Dowd Jr. (August 1927). "The First Plane to Germany". Popular Science. Popular Science Publishing Company, Inc. 111 (2): 121. Retrieved 2011-01-18.
  2. Malcolm Francis Willoughby (1980-06-01). The U.S. Coast Guard in World War II. pp. 127–130. ISBN   978-0-405-13081-6 . Retrieved 2011-01-18.
  3. Dege, Wilhelm (2003). War north of 80 : the last German Arctic weather station of World War II. Calgary, Alta.: Arctic Institute of North America. pp. 300–301. ISBN   9780870817687.
  4. Selinger, Franz (1985). "Deutsche automatische Wetterstationen in der Arktis 1942-1945". Polarforschung. Bremerhaven (55): 55–67.
  5. J. A. Shirley (May 1959). "Marine Automatic Weather Stations" (PDF). Weather Bureau Topics. 18 (5): 83. Archived from the original (PDF) on 2019-06-19. Retrieved 2017-08-10.
  6. G. L. Timpe & N. Van de Voorde (October 1995). "NOMAD buoys: An overview of forty years of use". 'Challenges of Our Changing Global Environment'. Conference Proceedings. OCEANS '95 MTS/IEEE. Vol. 1. pp. 309–315. doi:10.1109/OCEANS.1995.526788. ISBN   0-933957-14-9. S2CID   111274406.
  7. National Research Council (U.S.). Ocean Science Committee, National Research Council (U.S.). Study Panel on Ocean Atmosphere Interaction (1974). The role of the ocean in predicting climate: a report of workshops conducted by Study Panel on Ocean Atmosphere Interaction under the auspices of the Ocean Science Committee of the Ocean Affairs Board, Commission on Natural Resources, National Research Council. National Academies. p. 40. Retrieved 2011-01-18.
  8. Elwyn E. Wilson (July 1973). "Scientists Discover Western Atlantic Currents Are Highly Variable". Mariners Weather Log. National Oceanic and Atmospheric Administration. 17 (4).
  9. National Aeronautics and Space Administration (2009-04-15). "Ocean Motion and Surface Currents" . Retrieved 2011-01-28.
  10. K. A. Browning; Robert J. Gurney (1999). Global energy and water cycles. Cambridge University Press. p. 62. ISBN   978-0-521-56057-3 . Retrieved 2011-01-09.
  11. Hurricanes: Science and Society (2010). "Weather Buoys". University of Rhode Island . Retrieved 2011-01-28.
  12. Collecte Localisation Satellites (June 2010). "ARGOS Guinness Book" (PDF). p. 5. Archived from the original (PDF) on 2011-07-25. Retrieved 2011-01-28.
  13. Integrated Marine Observing System (May 2010). "IMOS deploys the world's first weather buoy in the remote Southern Ocean" (PDF). Marine Matters. Department of Innovation, Industry, Science and Research (8): 1. Archived from the original (PDF) on 2020-03-20. Retrieved 2016-08-20.
  14. 1 2 3 National Data Buoy Center (2008-02-04). "Moored Buoy Program". National Oceanic and Atmospheric Administration. Archived from the original on 2012-03-06. Retrieved 2011-01-29.
  15. 1 2 3 Vittorio Barale (2010). Oceanography from Space: Revisited. Springer. pp. 237–238. ISBN   978-90-481-8680-8 . Retrieved 2011-01-09.
  16. 1 2 Jeff Markell (2003). The Sailor's Weather Guide. Sheridan House, Inc. p. 13. ISBN   978-1-57409-158-8 . Retrieved 2011-01-27.
  17. "Watching the Oceans: A Report From General Dynamics". Naval Institute Proceedings. Annapolis, Maryland: United States Naval Institute. 93 (1): 28–29. January 1967. ISSN   0041-798X . Retrieved 16 June 2020.
  18. R. Lumpkin & M. Pazos (2010-06-08). "What's a Drifter?". The Global Drifter Program. Retrieved 2011-01-29.
  19. Lance F. Bosart, William A. Sprigg, National Research Council (1998). The meteorological buoy and coastal marine automated network for the United States. National Academies Press. p.  11. ISBN   978-0-309-06088-2.{{cite book}}: CS1 maint: multiple names: authors list (link)
  20. Department of Homeland Security (2009-06-02). "Department of Homeland Security Weather Programs" (PDF). Office of the Federal Coordinator for Meteorology. p. 2. Retrieved 2011-01-29.
  21. Data Buoy Cooperation Panel (2009). "Buoy Recover Techniques" (PDF). Joint WMO-IOC Technical Commission for Oceanography and Marine Meteorology in situ Observing Platform Support Centre. pp. 1–4. Retrieved 2011-01-29.
  22. Environment Canada (2010-12-30). "Marine Weather Observations". Government of Canada. Retrieved 2011-01-29.
  23. Met Office (2011). "Marine Observations" . Retrieved 2023-02-05.
  24. Bridget R. Thomas; Elizabeth C. Kent & Val R. Swail (2005). "Methods to Homogenize Wind Speeds From Ships and Buoys" (PDF). International Journal of Climatology . John Wiley & Sons, Ltd. 25 (7): 979–995. Bibcode:2005IJCli..25..979T. doi:10.1002/joc.1176. S2CID   128839496. Archived from the original (PDF) on 2018-04-17. Retrieved 2018-03-01.
  25. William J. Emery; Richard E. Thomson (2001). Data analysis methods in physical oceanography. Gulf Professional Publishing. pp. 24–25. ISBN   978-0-444-50757-0 . Retrieved 2011-01-09.
  26. Michael Marshall (2010-11-16). "Ships and buoys made global warming look slower". New Scientist. Retrieved 2011-01-29.