The distribution of active floats in the Argo array, colour coded by country that owns the float, as of February 2018.
Argo is an international programme for researching the ocean. It uses profiling floats to observe temperature, salinity and currents. Recently it has observed bio-optical properties in the Earth's oceans. It has been operating since the early 2000s. The real-time data it provides support climate and oceanographic research.[1][2] A special research interest is to quantify the ocean heat content (OHC). The Argo fleet consists of almost 4000 drifting "Argo floats" (as profiling floats used by the Argo program are often called) deployed worldwide. Each float weighs 20–30kg. In most cases probes drift at a depth of 1000metres. Experts call this the parking depth. Every 10 days, by changing their buoyancy, they dive to a depth of 2000metres and then move to the sea-surface. As they move they measure conductivity and temperature profiles as well as pressure. Scientists calculate salinity and density from these measurements. Seawater density is important in determining large-scale motions in the ocean.
Average current velocities at 1000metres are directly measured by the distance and direction a float drifts while parked at that depth, which is determined by GPS or Argos system positions at the surface. The data is transmitted to shore via satellite, and is freely available to everyone, without restrictions.
The Argo program is named after the Greek mythical ship Argo to emphasize the complementary relationship of Argo with the Jason satellite altimeters. Both the standard Argo floats and the 4 satellites launched so far to monitor changing sea-level all operate on a 10-day duty cycle.
International collaboration
The Argo program is a collaborative partnership of more than 30 nations from all continents (most shown on the graphic map in this article) that maintains a global array and provides a dataset anyone can use to explore the ocean environment. Argo is a component of the Global Ocean Observing System (GOOS),[3] and is coordinated by the Argo Steering Team, an international body of scientists and technical experts that meets once per year. The Argo data stream is managed by the Argo Data Management Team. Argo is also supported by the Group on Earth Observations, and has been endorsed since its beginnings by the World Climate Research Programme's CLIVAR Project (Variability and predictability of the ocean-atmosphere system), and by the Global Ocean Data Assimilation Experiment (GODAE OceanView).
History
The distribution of active floats in the Argo array, colour coded by country, that carry bio-geochemical sensors as of February 2018.
A program called Argo was first proposed at OceanObs 1999 which was a conference organised by international agencies with the aim of creating a coordinated approach to ocean observations. The original Argo prospectus was created by a small group of scientists, chaired by Dean Roemmich, who described a program that would have a global array of about 3000floats in place by sometime in 2007.[4] The 3000-float array was achieved in November 2007 and was global. The Argo Steering Team met for the first time in 1999 in Maryland (USA) and outlined the principles of global data sharing.
The Argo Steering Team made a 10-year report to OceanObs-2009 [5] and received suggestions on how the array might be improved. These suggestions included enhancing the array at high latitudes, in marginal seas (such as the Gulf of Mexico and the Mediterranean) and along the equator, improved observation of strong boundary currents (such as the Gulf Stream and Kuroshio), extension of observations into deep water and the addition of sensors for monitoring biological and chemical changes in the oceans. In November 2012 an Indian float in the Argo array gathered the one-millionth profile (twice the number collected by research vessels during all of the 20th century) an event that was reported in several press releases.[6][7] As can be seen in the plot opposite, by early 2018 the Bio-Argo program is expanding rapidly.[8]
Float design and operation
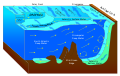
A schematic diagram showing the general structure of a profiling float as used in Argo
The critical capability of an Argo float is its ability to rise and descend in the ocean on a programmed schedule. The floats do this by changing their effective density. The density of any object is given by its mass divided by its volume. The Argo float keeps its mass constant, but by altering its volume, it changes its density. To do this, mineral oil is forced out of the float's pressure case and expands a rubber bladder at the bottom end of the float. As the bladder expands, the float becomes less dense than seawater and rises to the surface. Upon finishing its tasks at the surface, the float withdraws the oil and descends again.[9]
A handful of companies and organizations manufacture profiling floats used in the Argo program. APEX floats, made by Teledyne Webb Research, are the most common element of the current array. SOLO and SOLO-II floats (the latter use a reciprocating pump for buoyancy changes, unlike screw-driven pistons in other floats) were developed at Scripps Institution of Oceanography. Other types include the NINJA float, made by the Tsurumi Seiki Co. of Japan, and the ARVOR, DEEP-ARVOR & PROVOR floats developed by IFREMER in France, in industrial partnership with French Company nke instrumentation. Most floats use sensors made by Sea-Bird Scientific (https://www.seabird.com/) , which also makes a profiling float called Navis. A typical Argo float is a cylinder just over 1metre long and 14cm across with a hemispherical cap. Thus it has a minimum volume of about 16,600 cubic centimetres (cm3). At Ocean Station Papa in the Gulf of Alaska the temperature and salinity at the surface might be about 6°C and 32.55parts per thousand giving a density of sea-water of 1.0256g/cm3. At a depth of 2000metres (pressure of 2000decibars) the temperature might be 2°C and the salinity 34.58parts per thousand. Thus, including the effect of pressure (water is slightly compressible) the density of sea-water is about 1.0369g/cm3. The change in density divided by the deep density is 0.0109.
The float has to match these densities if it is to reach 2000metres depth and then rise to the surface. Since the density of the float is its mass divided by volume, it needs to change its volume by 0.0109 × 16,600 = 181cm3 to drive that excursion; a small amount of that volume change is provided by the compressibility of the float itself, and excess buoyancy is required at the surface in order to keep the antenna above water. All Argo floats carry sensors to measure the temperature and salinity of the ocean as they vary with depth, but an increasing number of floats also carry other sensors, such as for measuring dissolved oxygen and ultimately other variables of biological and chemical interest such as chlorophyll, nutrients and pH. An extension to the Argo project called BioArgo is being developed and, when implemented, will add a biological and chemical component to this method of sampling the oceans.[10]
The antenna for satellite data collection is mounted at the top of the float which extends clear of the sea surface after it completes its ascent. The ocean is saline, hence an electrical conductor, so that radio communications from under the sea surface are not possible. Early in the program Argo floats exclusively used slow mono-directional satellite communications but the majority of floats being deployed in mid-2013 use rapid bi-directional communications. The result of this is that Argo floats now transmit much more data than was previously possible and they spend only about 20minutes on the sea surface rather than 8–12hours, greatly reducing problems such as grounding and bio-fouling.
The average life span of Argo floats has increased greatly since the program began, first exceeding 4-year mean lifetime for floats deployed in 2005. Ongoing improvements should result in further extensions to 6years and longer.
As of June 2014,[11] new types of floats were being tested to collect measurements much deeper than can be reached by standard Argo floats. These "Deep Argo" floats are designed to reach depths of 4000 or 6000 metres, versus 2000 metres for standard floats. This will allow a much greater volume of the ocean to be sampled. Such measurements are important for developing a comprehensive understanding of the ocean, such as trends in heat content.[12][13]
Array design
Number of profiles gathered by Argo floats south of 30°S (upper curve) through 2012, compared with available profiles gathered by other means (lower) in that period. This shows the near elimination of seasonal bias.
The original plan advertised in the Argo prospectus called for a nearest-neighbour distance between floats, on average, of 3°latitude by 3°longitude.[4] This allowed for higher resolution (in kilometres) at high latitudes, both north and south, and was considered necessary because of the decrease in the Rossby radius of deformation which governs the scale of oceanographic features, such as eddies. By 2007 this was largely achieved, but the target resolution has never yet been completely achieved in the deep southern ocean.
Efforts are being made to complete the original plan in all parts of the world oceans but this is difficult in the deep Southern Ocean as deployment opportunities occur only very rarely.
As mentioned in the history section, enhancements are now planned in the equatorial regions of the oceans, in boundary currents and in marginal seas. This requires that the total number of floats be increased from the original plan of 3000floats to a 4000-float array.
One consequence of the use of profiling floats to sample the ocean is that seasonal bias can be removed. The diagram opposite shows the count of all float profiles acquired each month by Argo south of 30°S (upper curve) from the start of the program to November 2012 compared with the same diagram for all other data available. The lower curve shows a strong annual bias with four times as many profiles being collected in austral summer than in austral winter. For the upper (Argo) plot, there is no bias apparent.
Data access
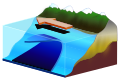
A section of salinity along the date line computed from Argo data using the Global Marine Atlas.
One of the critical features of the Argo model is that of global and unrestricted access to data in near real-time. When a float transmits a profile it is quickly converted to a format that can be inserted on the Global Telecommunications System (GTS). The GTS is operated by the World Meteorological Organisation, or WMO, specifically for the purpose of sharing data needed for weather forecasting. Thus all nations who are members of the WMO receive all Argo profiles within a few hours of the acquisition of the profile. Data are also made available through ftp and WWW access via two Argo Global Data Centres (or GDACs), one in France and one in the US.
About 90% of all profiles acquired are made available to global access within 24hours, with the remaining profiles becoming available soon thereafter.
For a researcher to use data acquired via the GTS or from the Argo Global Data Centres (GDACs) does require programming skills. The GDACs supply multi-profile files that are a native file format for Ocean DataView. For any day there are files with names like 20121106_prof.nc that are called multi-profile files. This example is a file specific to 6 November 2012 and contains all profiles in a single NetCDF file for one ocean basin. The GDACs identify three ocean basins, Atlantic, Indian and Pacific. Thus three multi-profile files will carry every Argo profile acquired on that specific day.
A user who wants to explore Argo data but lacks programming skills might like to download the Argo Global Marine Atlas [14] which is an easy-to-use utility that allows the creation of products based on Argo data such as the salinity section shown above, but also horizontal maps of ocean properties, time series at any location etc. This Atlas also carries an "update" button that allows data to be updated periodically. The Argo Global Marine Atlas is maintained at the Scripps Institution of Oceanography in La Jolla, California.
Argo data can also be displayed in Google Earth with a layer developed by the Argo Technical Coordinator.
The number of papers, by year, published in refereed journals and that are extensively or totally dependent on the availability of Argo data as of 26 March 2018.
Argo is now the dominant source of information about the climatic state of the oceans and is being widely used in many publications as seen in the diagram opposite. Topics addressed include air-sea interaction, ocean currents, interannual variability, El Niño, mesoscale eddies, water mass properties and transformation. Argo is also now permitting direct computations of the global ocean heat content.
They determine that areas of the world with high surface salinity are getting saltier and areas of the world with relatively low surface salinity are getting fresher. This has been described as 'the rich get richer and the poor get poorer'. Scientifically speaking, the distributions of salt are governed by the difference between precipitation and evaporation. Areas, such as the northern North Pacific Ocean, where precipitation dominates evaporation are fresher than average. The implication of their result is that the Earth is seeing an intensification of the global hydrological cycle. Argo data are also being used to drive computer models of the climate system leading to improvements in the ability of nations to forecast seasonal climate variations.[15]
Argo data were critical in the drafting of Chapter 3 (Working Group 1) of the IPCC Fifth Assessment Report (released September 2013) and an appendix was added to that chapter to emphasize the profound change that had taken place in the quality and volume of ocean data since the IPCC Fourth Assessment Report and the resulting improvement in confidence in the description of surface salinity changes and upper-ocean heat content.
Argo data were used along with sea level change data from satellite altimetry in a new approach to analyzing global warming, reported in Eos in 2017. David Morrison reports that "[b]oth of these data sets show clear signatures of heat deposition in the ocean, from the temperature changes in the top 2km of water and from the expansion of the ocean water due to heating. These two measures are less noisy than land and atmospheric temperatures."[16]
Argo and CERES data collected between 2005 and 2019 have been compared as independent measures of the global change in Earth's energy imbalance. Both data sets showed similar behavior at annualized resolution, as well as a doubling of the linear trend in planet's heating rate during that 14-year span.[17]
This page is based on this Wikipedia article Text is available under the CC BY-SA 4.0 license; additional terms may apply. Images, videos and audio are available under their respective licenses.