Ocean temperature

Last updated
Graph showing ocean temperature versus depth on the vertical axis. The graph shows several thermoclines (or thermal layers) based on seasons and latitude. The temperature at zero depth is the sea surface temperature. ThermoclineSeasonDepth.png
Graph showing ocean temperature versus depth on the vertical axis. The graph shows several thermoclines (or thermal layers) based on seasons and latitude. The temperature at zero depth is the sea surface temperature.

The ocean temperature plays a crucial role in the global climate system, ocean currents and for marine habitats. It varies depending on depth, geographical location and season. Not only the temperature differs in seawater but also the salinity. Warm surface water is generally saltier than the cooler deep or polar waters. [1] In polar regions, the upper layers of ocean water are cold and fresh. [2] Deep ocean water is cold, salty water found deep below the surface of Earth's oceans. This water has a uniform temperature of around 0-3 °C. [3] The ocean temperature also depends on the amount of solar radiation falling on its surface. In the tropics, with the Sun nearly overhead, the temperature of the surface layers can rise to over 30 °C (86 °F). Near the poles the temperature in equilibrium with the sea ice is about −2 °C (28 °F).

Contents

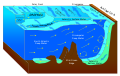
There is a continuous large-scale circulation of water in the oceans. One part of it is the thermohaline circulation (THC). It is driven by global density gradients created by surface heat and freshwater fluxes. [4] [5] Warm surface currents cool as they move away from the tropics. This happens as the water becomes denser and sinks. Changes in temperature and density move the cold water back towards the equator as a deep sea current. Then it eventually wells up again towards the surface.

Ocean temperature as a term applies to the temperature in the ocean at any depth. It can also apply specifically to the ocean temperatures that are not near the surface. In this case it is synonymous with deep ocean temperature).

It is clear that the oceans are warming as a result of climate change and this rate of warming is increasing. [6] :9 [7] The upper ocean (above 700 m) is warming fastest, but the warming trend extends throughout the ocean. In 2022, the global ocean was the hottest ever recorded by humans. [8]

Definition and types

Sea surface temperature

Sea surface temperature since 1979 in the extrapolar region (between 60 degrees south and 60 degrees north latitude) 1979- Daily sea surface temperatures 60S-60N latitudes.png
Sea surface temperature since 1979 in the extrapolar region (between 60 degrees south and 60 degrees north latitude)
Sea surface temperature (SST), or ocean surface temperature, is the ocean temperature close to the surface. The exact meaning of surface varies in the literature and in practice. It is usually between 1 millimetre (0.04 in) and 20 metres (70 ft) below the sea surface. Sea surface temperatures greatly modify air masses in the Earth's atmosphere within a short distance of the shore. Local areas of heavy snow can form in bands downwind of warm water bodies within an otherwise cold air mass. Warm sea surface temperatures can develop and strengthen cyclones over the Ocean. Experts call this process tropical cyclogenesis. Tropical cyclones can also cause a cool wake. This is due to turbulent mixing of the upper 30 metres (100 ft) of the ocean. Sea surface temperature changes during the day. This is like the air above it, but to a lesser degree. There is less variation in sea surface temperature on breezy days than on calm days. Ocean currents, such as the Atlantic Multidecadal Oscillation, can affect sea surface temperatures over several decades. [9] Thermohaline circulation has a major impact on average sea surface temperature throughout most of the world's oceans.

Deep ocean temperature

Experts refer to the temperature further below the surface as ocean temperature or deep ocean temperature. Ocean temperatures more than 20 metres below the surface vary by region and time. They contribute to variations in ocean heat content and ocean stratification. [10] The increase of both ocean surface temperature and deeper ocean temperature is an important effect of climate change on oceans. [10]

Deep ocean water is the name for cold, salty water found deep below the surface of Earth's oceans. Deep ocean water makes up about 90% of the volume of the oceans. Deep ocean water has a very uniform temperature of around 0-3 °C. Its salinity is about 3.5% or 35 ppt (parts per thousand). [3]

Relevance

Ocean temperature and dissolved oxygen concentrations have a big influence on many aspects of the ocean. These two key parameters affect the ocean's primary productivity, the oceanic carbon cycle, nutrient cycles, and marine ecosystems. [11] They work in conjunction with salinity and density to control a range of processes. These include mixing versus stratification, ocean currents and the thermohaline circulation.

Ocean heat content

Experts calculate ocean heat content by using ocean temperatures at different depths.

The ocean heat content (OHC) has been increasing for decades as the ocean has been absorbing most of the excess heat resulting from greenhouse gas emissions from human activities. The graph shows OHC calculated to a water depth of 700 and to 2000 meters. 1955- Ocean heat content - NOAA.svg
The ocean heat content (OHC) has been increasing for decades as the ocean has been absorbing most of the excess heat resulting from greenhouse gas emissions from human activities. The graph shows OHC calculated to a water depth of 700 and to 2000 meters.

Ocean heat content (OHC) is the energy absorbed and stored by oceans. To calculate the ocean heat content, it is necessary to measure ocean temperature at many different locations and depths. Integrating the areal density of ocean heat over an ocean basin or entire ocean gives the total ocean heat content. [13] Between 1971 and 2018, the rise in ocean heat content accounted for over 90% of Earth's excess thermal energy from global heating. [14] [15] The main driver of this increase was anthropogenic forcing via rising greenhouse gas emissions. [16] :1228 By 2020, about one third of the added energy had propagated to depths below 700 meters. [17] [18] In 2023, the world's oceans were again the hottest in the historical record and exceeded the previous 2022 record maximum. [19] The five highest ocean heat observations to a depth of 2000 meters occurred in the period 2019–2023. The North Pacific, North Atlantic, the Mediterranean, and the Southern Ocean all recorded their highest heat observations for more than sixty years of global measurements. [20] Ocean heat content and sea level rise are important indicators of climate change. [21]

Ocean water can absorb a lot of solar energy because water has far greater heat capacity than atmospheric gases. [17] As a result, the top few meters of the ocean contain more thermal energy than the entire Earth's atmosphere. [22] Since before 1960, research vessels and stations have sampled sea surface temperatures and temperatures at greater depth all over the world. Since 2000, an expanding network of nearly 4000 Argo robotic floats has measured temperature anomalies, or the change in ocean heat content. With improving observation in recent decades, the heat content of the upper ocean has been analyzed to have increased at an accelerating rate. [23] [24] [25] The net rate of change in the top 2000 meters from 2003 to 2018 was +0.58±0.08 W/m2 (or annual mean energy gain of 9.3  zettajoules). It is difficult to measure temperatures over long periods with sufficient accuracy and covering enough areas and depths. This explains the uncertainty in the figures. [21]

Measurements

There are various ways to measure ocean temperature. [26] Below the sea surface, it is important to refer to the specific depth of measurement as well as measuring the general temperature. The reason is there is a lot of variation with depths. This is especially the case during the day. At this time low wind speed and a lot of sunshine may lead to the formation of a warm layer at the ocean surface and big changes in temperature as you get deeper. Experts call these strong daytime vertical temperature gradients a diurnal thermocline. [27]

The basic technique involves lowering a device to measure temperature and other parameters electronically. This device is called CTD which stands for conductivity, temperature, and depth. [28] It continuously sends the data up to the ship via a conducting cable. This device is usually mounted on a frame that includes water sampling bottles. Since the 2010s autonomous vehicles such as gliders or mini-submersibles have been increasingly available. They carry the same CTD sensors, but operate independently of a research ship.

Scientists can deploy CTD systems from research ships on moorings gliders and even on seals. [29] With research ships they receive data through the conducting cable. For the other methods they use telemetry.

There are other ways of measuring sea surface temperature. [30] At this near-surface layer measurements are possible using thermometers or satellites with spectroscopy. Weather satellites have been available to determine this parameter since 1967. Scientists created the first global composites during 1970. [31]

The Advanced Very High Resolution Radiometer (AVHRR) is widely used to measure sea surface temperature from space. [26] :90

There are various devices to measure ocean temperatures at different depths. These include the Nansen bottle, bathythermograph, CTD, or ocean acoustic tomography. Moored and drifting buoys also measure sea surface temperatures. Examples are those deployed by the Global Drifter Program and the National Data Buoy Center. The World Ocean Database Project is the largest database for temperature profiles from all of the world’s oceans. [32]

A small test fleet of deep Argo floats aims to extend the measurement capability down to about 6000 meters. It will accurately sample temperature for a majority of the ocean volume once it is in full use. [33] [34]

Mercury thermometers

The most frequent measurement technique on ships and buoys is thermistors and mercury thermometers. [26] :88 Scientists often use mercury thermometers to measure the temperature of surface waters. They can put them in buckets dropped over the side of a ship. To measure deeper temperatures they put them on Nansen bottles. [26] :88

Argo program

Argo is an international programme for researching the ocean. It uses profiling floats to observe temperature, salinity and currents. Recently it has observed bio-optical properties in the Earth's oceans. It has been operating since the early 2000s. The real-time data it provides support climate and oceanographic research. [35] [36] A special research interest is to quantify the ocean heat content (OHC). The Argo fleet consists of almost 4000 drifting "Argo floats" (as profiling floats used by the Argo program are often called) deployed worldwide. Each float weighs 20–30 kg. In most cases probes drift at a depth of 1000 metres. Experts call this the parking depth. Every 10 days, by changing their buoyancy, they dive to a depth of 2000 metres and then move to the sea-surface. As they move they measure conductivity and temperature profiles as well as pressure. Scientists calculate salinity and density from these measurements. Seawater density is important in determining large-scale motions in the ocean.

Ocean warming

The illustration of temperature changes from 1960 to 2019 across each ocean starting at the Southern Ocean around Antarctica. Increased Trend in Sea Temperature.png
The illustration of temperature changes from 1960 to 2019 across each ocean starting at the Southern Ocean around Antarctica.

It is clear that the ocean is warming as a result of climate change, and this rate of warming is increasing. [38] :9 The global ocean was the warmest it had ever been recorded by humans in 2022. [39] This is determined by the ocean heat content, which exceeded the previous 2021 maximum in 2022. [39] The steady rise in ocean temperatures is an unavoidable result of the Earth's energy imbalance, which is primarily caused by rising levels of greenhouse gases. [39] Between pre-industrial times and the 2011–2020 decade, the ocean's surface has heated between 0.68 and 1.01 °C. [40] :1214

The majority of ocean heat gain occurs in the Southern Ocean. For example, between the 1950s and the 1980s, the temperature of the Antarctic Southern Ocean rose by 0.17 °C (0.31 °F), nearly twice the rate of the global ocean. [41]

The warming rate varies with depth. The upper ocean (above 700 m) is warming the fastest. At an ocean depth of a thousand metres the warming occurs at a rate of nearly 0.4 °C per century (data from 1981 to 2019). [42] :Figure 5.4 In deeper zones of the ocean (globally speaking), at 2000 metres depth, the warming has been around 0.1 °C per century. [42] :Figure 5.4 The warming pattern is different for the Antarctic Ocean (at 55°S), where the highest warming (0.3 °C per century) has been observed at a depth of 4500 m. [42] :Figure 5.4
Overall, scientists project that all regions of the oceans will warm by 2050, but models disagree for SST changes expected in the subpolar North Atlantic, the equatorial Pacific, and the Southern Ocean. [43] The future global mean SST increase for the period 1995-2014 to 2081-2100 is 0.86°C under the most modest greenhouse gas emissions scenarios, and up to 2.89°C under the most severe emissions scenarios. [43]

Causes

The cause of recent observed changes is the warming of the Earth due to human-caused emissions of greenhouse gases such as carbon dioxide and methane. [44] Growing concentrations of greenhouse gases increases Earth's energy imbalance, further warming surface temperatures. [8] The ocean takes up most of the added heat in the climate system, raising ocean temperatures. [7]

Main physical effects

Increased stratification and lower oxygen levels

Higher air temperatures warm the ocean surface. And this leads to greater ocean stratification. Reduced mixing of the ocean layers stabilises warm water near the surface. At the same time it reduces cold, deep water circulation. The reduced up and down mixing reduces the ability of the ocean to absorb heat. This directs a larger fraction of future warming toward the atmosphere and land. Energy available for tropical cyclones and other storms is likely to increase. Nutrients for fish in the upper ocean layers are set to decrease. This is also like to reduce the capacity of the oceans to store carbon.

Warmer water cannot contain as much oxygen as cold water. Increased thermal stratification may reduce the supply of oxygen from the surface waters to deeper waters. This would further decrease the water's oxygen content. [45] This process is called ocean deoxygenation. The ocean has already lost oxygen throughout the water column. Oxygen minimum zones are expanding worldwide. [46] :471

Changing ocean currents

Varying temperatures associated with sunlight and air temperatures at different latitudes cause ocean currents. Prevailing winds and the different densities of saline and fresh water are another cause of currents. Air tends to be warmed and thus rise near the equator, then cool and thus sink slightly further poleward. Near the poles, cool air sinks, but is warmed and rises as it then travels along the surface equatorward. The sinking and upwelling that occur in lower latitudes, and the driving force of the winds on surface water, mean the ocean currents circulate water throughout the entire sea. Global warming on top of these processes causes changes to currents, especially in the regions where deep water is formed. [47]

In the geologic past

Scientists believe the sea temperature was much hotter in the Precambrian period. Such temperature reconstructions derive from oxygen and silicon isotopes from rock samples. [48] [49] These reconstructdions suggest the ocean had a temperature of 55–85 °C 2,000 to 3,500 million years ago. It then cooled to milder temperatures of between 10 and 40 °C by 1,000  million years ago. Reconstructed proteins from Precambrian organisms also provide evidence that the ancient world was much warmer than today. [50] [51]

The Cambrian Explosion approximately 538.8 million years ago was a key event in the evolution of life on Earth. This event took place at a time when scientists believe sea surface temperatures reached about 60 °C. [52] Such high temperatures are above the upper thermal limit of 38 °C for modern marine invertebrates. They preclude a major biological revolution. [53]

During the later Cretaceous period, from 100 to 66 million years ago, average global temperatures reached their highest level in the last 200 million years or so. [54] This was probably the result of the configuration of the continents during this period. It allowed for improved circulation in the oceans. This discouraged the formation of large scale ice sheet.[ citation needed ]

Data from an oxygen isotope database indicate that there have been seven global warming events during the geologic past. These include the Late Cambrian, Early Triassic, Late Cretaceous, and Paleocene-Eocene transition. The surface of the sea was about 5-30º warmer than today in these warming period. [11]

See also

Related Research Articles

<span class="mw-page-title-main">Cryosphere</span> Those portions of Earths surface where water is in solid form

The cryosphere is an all-encompassing term for the portions of Earth's surface where water is in solid form, including sea ice, lake ice, river ice, snow cover, glaciers, ice caps, ice sheets, and frozen ground. Thus, there is a wide overlap with the hydrosphere. The cryosphere is an integral part of the global climate system. It also has important feedbacks on the climate system. These feedbacks come from the cryosphere's influence on surface energy and moisture fluxes, clouds, the water cycle, atmospheric and oceanic circulation.

<span class="mw-page-title-main">Water cycle</span> Continuous movement of water on, above and below the surface of the Earth

The water cycle, also known as the hydrologic cycle or the hydrological cycle, is a biogeochemical cycle that involves the continuous movement of water on, above and below the surface of the Earth. The mass of water on Earth remains fairly constant over time but the partitioning of the water into the major reservoirs of ice, fresh water, saline water and atmospheric water is variable depending on a wide range of climatic variables. The water moves from one reservoir to another, such as from river to ocean, or from the ocean to the atmosphere, by the physical processes of evaporation, sublimation, transpiration, condensation, precipitation, infiltration, surface runoff, and subsurface flow. In doing so, the water goes through different forms: liquid, solid (ice) and vapor. The ocean plays a key role in the water cycle as it is the source of 86% of global evaporation.

<span class="mw-page-title-main">Thermohaline circulation</span> Part of large-scale ocean circulation

Thermohaline circulation (THC) is a part of the large-scale ocean circulation that is driven by global density gradients created by surface heat and freshwater fluxes. The adjective thermohaline derives from thermo- referring to temperature and -haline referring to salt content, factors which together determine the density of sea water. Wind-driven surface currents travel polewards from the equatorial Atlantic Ocean, cooling en route, and eventually sinking at high latitudes. This dense water then flows into the ocean basins. While the bulk of it upwells in the Southern Ocean, the oldest waters upwell in the North Pacific. Extensive mixing therefore takes place between the ocean basins, reducing differences between them and making the Earth's oceans a global system. The water in these circuits transport both energy and mass around the globe. As such, the state of the circulation has a large impact on the climate of the Earth.

<span class="mw-page-title-main">Sea surface temperature</span> Water temperature close to the oceans surface

Sea surface temperature (SST), or ocean surface temperature, is the ocean temperature close to the surface. The exact meaning of surface varies in the literature and in practice. It is usually between 1 millimetre (0.04 in) and 20 metres (70 ft) below the sea surface. Sea surface temperatures greatly modify air masses in the Earth's atmosphere within a short distance of the shore. Local areas of heavy snow can form in bands downwind of warm water bodies within an otherwise cold air mass. Warm sea surface temperatures can develop and strengthen cyclones over the Ocean. Experts call this process tropical cyclogenesis. Tropical cyclones can also cause a cool wake. This is due to turbulent mixing of the upper 30 metres (100 ft) of the ocean. Sea surface temperature changes during the day. This is like the air above it, but to a lesser degree. There is less variation in sea surface temperature on breezy days than on calm days. Ocean currents, such as the Atlantic Multidecadal Oscillation, can affect sea surface temperatures over several decades. Thermohaline circulation has a major impact on average sea surface temperature throughout most of the world's oceans.

<span class="mw-page-title-main">Earth's energy budget</span> Accounting of the energy flows which determine Earths surface temperature and drive its climate

Earth's energy budget accounts for the balance between the energy that Earth receives from the Sun and the energy the Earth loses back into outer space. Smaller energy sources, such as Earth's internal heat, are taken into consideration, but make a tiny contribution compared to solar energy. The energy budget also accounts for how energy moves through the climate system. The Sun heats the equatorial tropics more than the polar regions. Therefore, the amount of solar irradiance received by a certain region is unevenly distributed. As the energy seeks equilibrium across the planet, it drives interactions in Earth's climate system, i.e., Earth's water, ice, atmosphere, rocky crust, and all living things. The result is Earth's climate.

<span class="mw-page-title-main">Argo (oceanography)</span> International oceanographic observation program

Argo is an international programme for researching the ocean. It uses profiling floats to observe temperature, salinity and currents. Recently it has observed bio-optical properties in the Earth's oceans. It has been operating since the early 2000s. The real-time data it provides support climate and oceanographic research. A special research interest is to quantify the ocean heat content (OHC). The Argo fleet consists of almost 4000 drifting "Argo floats" deployed worldwide. Each float weighs 20–30 kg. In most cases probes drift at a depth of 1000 metres. Experts call this the parking depth. Every 10 days, by changing their buoyancy, they dive to a depth of 2000 metres and then move to the sea-surface. As they move they measure conductivity and temperature profiles as well as pressure. Scientists calculate salinity and density from these measurements. Seawater density is important in determining large-scale motions in the ocean.

<span class="mw-page-title-main">Climate commitment</span> Unavoidable future climate change due to inertial effects

Climate commitment describes the fact that Earth's climate reacts with a delay to influencing factors such as the growth and the greater presence of greenhouse gases. Climate commitment studies attempt to assess the amount of future global warming that is "committed" under the assumption of some constant or some evolving level of forcing. The constant level often used for illustrative purposes is that due to CO2 doubling or quadrupling relative to the pre-industrial level; or the present level of forcing.

<span class="mw-page-title-main">Effects of climate change</span>

Effects of climate change are well documented and growing for Earth's natural environment and human societies. Changes to the climate system include an overall warming trend, changes to precipitation patterns, and more extreme weather. As the climate changes it impacts the natural environment with effects such as more intense forest fires, thawing permafrost, and desertification. These changes can profoundly impact ecosystems and societies, and can become irreversible once tipping points are crossed.

Ocean stratification is the natural separation of an ocean's water into horizontal layers by density, which is generally stable because warm water floats on top of cold water, and heating is mostly from the sun, which reinforces that arrangement. Stratification is reduced by wind-forced mechanical mixing, but reinforced by convection. Stratification occurs in all ocean basins and also in other water bodies. Stratified layers are a barrier to the mixing of water, which impacts the exchange of heat, carbon, oxygen and other nutrients. The surface mixed layer is the uppermost layer in the ocean and is well mixed by mechanical (wind) and thermal (convection) effects. Climate change is causing the upper ocean stratification to increase.

<span class="mw-page-title-main">Atlantic meridional overturning circulation</span> System of surface and deep currents in the Atlantic Ocean

The Atlantic meridional overturning circulation (AMOC) is the "main current system in the South and North Atlantic Oceans". As such, it is a component of Earth's oceanic circulation system and plays an important role in the climate system. The AMOC includes currents at the surface as well as at great depths in the Atlantic Ocean. These currents are driven by changes in the atmospheric weather as well as by changes in temperature and salinity. They collectively make up one half of the global thermohaline circulation that encompasses the flow of major ocean currents. The other half is the Southern Ocean overturning circulation.

<span class="mw-page-title-main">Ocean heat content</span> Thermal energy stored in ocean water

Ocean heat content (OHC) is the energy absorbed and stored by oceans. To calculate the ocean heat content, it is necessary to measure ocean temperature at many different locations and depths. Integrating the areal density of ocean heat over an ocean basin or entire ocean gives the total ocean heat content. Between 1971 and 2018, the rise in ocean heat content accounted for over 90% of Earth's excess thermal energy from global heating. The main driver of this increase was anthropogenic forcing via rising greenhouse gas emissions. By 2020, about one third of the added energy had propagated to depths below 700 meters. In 2023, the world's oceans were again the hottest in the historical record and exceeded the previous 2022 record maximum. The five highest ocean heat observations to a depth of 2000 meters occurred in the period 2019–2023. The North Pacific, North Atlantic, the Mediterranean, and the Southern Ocean all recorded their highest heat observations for more than sixty years of global measurements. Ocean heat content and sea level rise are important indicators of climate change.

<span class="mw-page-title-main">Ocean</span> Salt water covering most of Earth

The ocean is the body of salt water that covers ~70.8% of the Earth. In English, the term ocean also refers to any of the large bodies of water into which the world ocean is conventionally divided. Distinct names are used to identify five different areas of the ocean: Pacific, Atlantic, Indian, Antarctic/Southern, and Arctic. The ocean contains 97% of Earth's water and is the primary component of the Earth's hydrosphere, thus the ocean is essential to life on Earth. The ocean influences climate and weather patterns, the carbon cycle, and the water cycle by acting as a huge heat reservoir.

<span class="mw-page-title-main">Ocean deoxygenation</span> Reduction of the oxygen content of the oceans

Ocean deoxygenation is the reduction of the oxygen content in different parts of the ocean due to human activities. There are two areas where this occurs. Firstly, it occurs in coastal zones where eutrophication has driven some quite rapid declines in oxygen to very low levels. This type of ocean deoxygenation is also called dead zones. Secondly, ocean deoxygenation occurs also in the open ocean. In that part of the ocean, there is nowadays an ongoing reduction in oxygen levels. As a result, the naturally occurring low oxygen areas are now expanding slowly. This expansion is happening as a consequence of human caused climate change. The resulting decrease in oxygen content of the oceans poses a threat to marine life, as well as to people who depend on marine life for nutrition or livelihood. A decrease in ocean oxygen levels affects how productive the ocean is, how nutrients and carbon move around, and how marine habitats function.

<span class="mw-page-title-main">Climate change and fisheries</span>

Fisheries are affected by climate change in many ways: marine aquatic ecosystems are being affected by rising ocean temperatures, ocean acidification and ocean deoxygenation, while freshwater ecosystems are being impacted by changes in water temperature, water flow, and fish habitat loss. These effects vary in the context of each fishery. Climate change is modifying fish distributions and the productivity of marine and freshwater species. Climate change is expected to lead to significant changes in the availability and trade of fish products. The geopolitical and economic consequences will be significant, especially for the countries most dependent on the sector. The biggest decreases in maximum catch potential can be expected in the tropics, mostly in the South Pacific regions.

<span class="mw-page-title-main">Effects of climate change on oceans</span>

There are many effects of climate change on oceans. One of the main ones is an increase in ocean temperatures. More frequent marine heatwaves are linked to this. The rising temperature contributes to a rise in sea levels due to melting ice sheets. Other effects on oceans include sea ice decline, reducing pH values and oxygen levels, as well as increased ocean stratification. All this can lead to changes of ocean currents, for example a weakening of the Atlantic meridional overturning circulation (AMOC). The main root cause of these changes are the emissions of greenhouse gases from human activities, mainly burning of fossil fuels. Carbon dioxide and methane are examples of greenhouse gases. The additional greenhouse effect leads to ocean warming because the ocean takes up most of the additional heat in the climate system. The ocean also absorbs some of the extra carbon dioxide that is in the atmosphere. This causes the pH value of the seawater to drop. Scientists estimate that the ocean absorbs about 25% of all human-caused CO2 emissions.

<span class="mw-page-title-main">Global warming hiatus</span> Period of little Earth temperature change

A global warming hiatus, also sometimes referred to as a global warming pause or a global warming slowdown, is a period of relatively little change in globally averaged surface temperatures. In the current episode of global warming many such 15-year periods appear in the surface temperature record, along with robust evidence of the long-term warming trend. Such a "hiatus" is shorter than the 30-year periods that climate is classically averaged over.

<span class="mw-page-title-main">Climate inertia</span> Slow response of complex feedback systems

Climate inertia or climate change inertia is the phenomenon by which a planet's climate system shows a resistance or slowness to deviate away from a given dynamic state. It can accompany stability and other effects of feedback within complex systems, and includes the inertia exhibited by physical movements of matter and exchanges of energy. The term is a colloquialism used to encompass and loosely describe a set of interactions that extend the timescales around climate sensitivity. Inertia has been associated with the drivers of, and the responses to, climate change.

<span class="mw-page-title-main">Stratification (water)</span> Layering of a body of water due to density variations

Stratification in water is the formation in a body of water of relatively distinct and stable layers by density. It occurs in all water bodies where there is stable density variation with depth. Stratification is a barrier to the vertical mixing of water, which affects the exchange of heat, carbon, oxygen and nutrients. Wind-driven upwelling and downwelling of open water can induce mixing of different layers through the stratification, and force the rise of denser cold, nutrient-rich, or saline water and the sinking of lighter warm or fresher water, respectively. Layers are based on water density: denser water remains below less dense water in stable stratification in the absence of forced mixing.

<span class="mw-page-title-main">Effects of climate change on the water cycle</span>

The effects of climate change on the water cycle are profound and have been described as an intensification or a strengthening of the water cycle. This effect has been observed since at least 1980. One example is when heavy rain events become even stronger. The effects of climate change on the water cycle have important negative effects on the availability of freshwater resources, as well as other water reservoirs such as oceans, ice sheets, the atmosphere and soil moisture. The water cycle is essential to life on Earth and plays a large role in the global climate system and ocean circulation. The warming of our planet is expected to be accompanied by changes in the water cycle for various reasons. For example, a warmer atmosphere can contain more water vapor which has effects on evaporation and rainfall.

Oceanic freshwater fluxes are defined as the transport of non saline water between the oceans and the other components of the Earth's system. These fluxes have an impact on the local ocean properties, as well as on the large scale circulation patterns.

References

  1. "Ocean Stratification". The Climate System. Columbia Univ. Archived from the original on 29 March 2020. Retrieved 22 September 2015.
  2. "The Hidden Meltdown of Greenland". Nasa Science/Science News. NASA. Retrieved 23 September 2015.
  3. 1 2 "Temperature of Ocean Water". UCAR. Archived from the original on 2010-03-27. Retrieved 2012-09-05.
  4. Rahmstorf, S (2003). "The concept of the thermohaline circulation" (PDF). Nature. 421 (6924): 699. Bibcode:2003Natur.421..699R. doi: 10.1038/421699a . PMID   12610602. S2CID   4414604.
  5. Lappo, SS (1984). "On reason of the northward heat advection across the Equator in the South Pacific and Atlantic ocean". Study of Ocean and Atmosphere Interaction Processes. Moscow Department of Gidrometeoizdat (in Mandarin): 125–9.
  6. IPCC, 2019: Summary for Policymakers Archived 2022-10-18 at the Wayback Machine . In: IPCC Special Report on the Ocean and Cryosphere in a Changing Climate Archived 2021-07-12 at the Wayback Machine [H.-O. Pörtner, D.C. Roberts, V. Masson-Delmotte, P. Zhai, M. Tignor, E. Poloczanska, K. Mintenbeck, A. Alegría, M.  Nicolai, A. Okem, J. Petzold, B. Rama, N.M. Weyer (eds.)]. Cambridge University Press, Cambridge, UK and New York, NY, USA. https://doi.org/10.1017/9781009157964.001.
  7. 1 2 Cheng, Lijing; Abraham, John; Hausfather, Zeke; Trenberth, Kevin E. (2019). "How fast are the oceans warming?". Science. 363 (6423): 128–129. Bibcode:2019Sci...363..128C. doi:10.1126/science.aav7619. ISSN   0036-8075. PMID   30630919. S2CID   57825894.
  8. 1 2 Cheng, Lijing; Abraham, John; Trenberth, Kevin E.; Fasullo, John; Boyer, Tim; Mann, Michael E.; Zhu, Jiang; Wang, Fan; Locarnini, Ricardo; Li, Yuanlong; Zhang, Bin; Yu, Fujiang; Wan, Liying; Chen, Xingrong; Feng, Licheng (2023). "Another Year of Record Heat for the Oceans". Advances in Atmospheric Sciences. 40 (6): 963–974. doi: 10.1007/s00376-023-2385-2 . ISSN   0256-1530. PMC   9832248 . PMID   36643611. CC-BY icon.svg Text was copied from this source, which is available under a Creative Commons Attribution 4.0 International License
  9. McCarthy, Gerard D.; Haigh, Ivan D.; Hirschi, Joël J.-M.; Grist, Jeremy P.; Smeed, David A. (2015-05-28). "Ocean impact on decadal Atlantic climate variability revealed by sea-level observations" (PDF). Nature. 521 (7553): 508–510. Bibcode:2015Natur.521..508M. doi:10.1038/nature14491. ISSN   1476-4687. PMID   26017453. S2CID   4399436.
  10. 1 2 Fox-Kemper, B., H.T. Hewitt, C. Xiao, G. Aðalgeirsdóttir, S.S. Drijfhout, T.L. Edwards, N.R. Golledge, M. Hemer, R.E. Kopp, G.  Krinner, A. Mix, D. Notz, S. Nowicki, I.S. Nurhati, L. Ruiz, J.-B. Sallée, A.B.A. Slangen, and Y. Yu, 2021: Chapter 9: Ocean, Cryosphere and Sea Level Change Archived 2022-10-24 at the Wayback Machine . In Climate Change 2021: The Physical Science Basis. Contribution of Working Group I to the Sixth Assessment Report of the Intergovernmental Panel on Climate Change Archived 2021-08-09 at the Wayback Machine [Masson-Delmotte, V., P. Zhai, A. Pirani, S.L.  Connors, C. Péan, S. Berger, N. Caud, Y. Chen, L. Goldfarb, M.I. Gomis, M. Huang, K. Leitzell, E. Lonnoy, J.B.R. Matthews, T.K. Maycock, T. Waterfield, O. Yelekçi, R. Yu, and B. Zhou (eds.)]. Cambridge University Press, Cambridge, United Kingdom and New York, NY, USA, pp. 1211–1362, doi : 10.1017/9781009157896.011
  11. 1 2 Song, Haijun; Wignall, Paul B.; Song, Huyue; Dai, Xu; Chu, Daoliang (2019). "Seawater Temperature and Dissolved Oxygen over the Past 500 Million Years". Journal of Earth Science. 30 (2): 236–243. doi:10.1007/s12583-018-1002-2. ISSN   1674-487X. S2CID   146378272.
  12. Top 700 meters:Lindsey, Rebecca; Dahlman, Luann (6 September 2023). "Climate Change: Ocean Heat Content". climate.gov. National Oceanic and Atmospheric Administration (NOAA). Archived from the original on 29 October 2023.Top 2000 meters: "Ocean Warming / Latest Measurement: December 2022 / 345 (± 2) zettajoules since 1955". NASA.gov. National Aeronautics and Space Administration. Archived from the original on 20 October 2023.
  13. Dijkstra, Henk A. (2008). Dynamical oceanography ([Corr. 2nd print.] ed.). Berlin: Springer Verlag. p. 276. ISBN   9783540763758.
  14. von Schuckmann, K.; Cheng, L.; Palmer, M. D.; Hansen, J.; et al. (7 September 2020). "Heat stored in the Earth system: where does the energy go?". Earth System Science Data. 12 (3): 2013–2041. Bibcode:2020ESSD...12.2013V. doi: 10.5194/essd-12-2013-2020 . hdl: 20.500.11850/443809 . CC-BY icon.svg Text was copied from this source, which is available under a Creative Commons Attribution 4.0 International License
  15. Cheng, Lijing; Abraham, John; Trenberth, Kevin; Fasullo, John; Boyer, Tim; Locarnini, Ricardo; et al. (2021). "Upper Ocean Temperatures Hit Record High in 2020". Advances in Atmospheric Sciences. 38 (4): 523–530. Bibcode:2021AdAtS..38..523C. doi: 10.1007/s00376-021-0447-x . S2CID   231672261.
  16. Fox-Kemper, B., H.T. Hewitt, C. Xiao, G. Aðalgeirsdóttir, S.S. Drijfhout, T.L. Edwards, N.R. Golledge, M. Hemer, R.E. Kopp, G. Krinner, A. Mix, D. Notz, S. Nowicki, I.S. Nurhati, L. Ruiz, J.-B. Sallée, A.B.A. Slangen, and Y. Yu, 2021: Chapter 9: Ocean, Cryosphere and Sea Level Change Archived 2022-10-24 at the Wayback Machine . In Climate Change 2021: The Physical Science Basis. Contribution of Working Group I to the Sixth Assessment Report of the Intergovernmental Panel on Climate Change Archived 2021-08-09 at the Wayback Machine [Masson-Delmotte, V., P. Zhai, A. Pirani, S.L. Connors, C. Péan, S. Berger, N. Caud, Y. Chen, L. Goldfarb, M.I. Gomis, M. Huang, K. Leitzell, E. Lonnoy, J.B.R. Matthews, T.K. Maycock, T. Waterfield, O. Yelekçi, R. Yu, and B. Zhou (eds.)]. Cambridge University Press, Cambridge, United Kingdom and New York, NY, USA, pp. 1211–1362.
  17. 1 2 LuAnn Dahlman and Rebecca Lindsey (2020-08-17). "Climate Change: Ocean Heat Content". National Oceanic and Atmospheric Administration.
  18. "Study: Deep Ocean Waters Trapping Vast Store of Heat". Climate Central . 2016.
  19. Cheng, Lijing; Abraham, John; Trenberth, Kevin E.; Boyer, Tim; Mann, Michael E.; Zhu, Jiang; Wang, Fan; Yu, Fujiang; Locarnini, Ricardo; Fasullo, John; Zheng, Fei; Li, Yuanlong; et al. (2024). "New record ocean temperatures and related climate indicators in 2023". Advances in Atmospheric Sciences. doi: 10.1007/s00376-024-3378-5 . ISSN   0256-1530.
  20. NOAA National Centers for Environmental Information, Monthly Global Climate Report for Annual 2023, published online January 2024, Retrieved on February 4, 2024 from https://www.ncei.noaa.gov/access/monitoring/monthly-report/global/202313.
  21. 1 2 Cheng, Lijing; Foster, Grant; Hausfather, Zeke; Trenberth, Kevin E.; Abraham, John (2022). "Improved Quantification of the Rate of Ocean Warming". Journal of Climate. 35 (14): 4827–4840. Bibcode:2022JCli...35.4827C. doi: 10.1175/JCLI-D-21-0895.1 . Archived 2017-10-16 at the Wayback Machine
  22. "Vital Signs of the Plant: Ocean Heat Content". NASA. Retrieved 2021-11-15.
  23. Li, Zhi; England, Matthew H.; Groeskamp, Sjoerd (2023). "Recent acceleration in global ocean heat accumulation by mode and intermediate waters". Nature Communications. 14 (6888). doi: 10.1038/s41467-023-42468-z .
  24. Minière, Audrey; von Schuckmann, Karina; Sallée, Jean-baptiste; Vogt, Linus (2023). "Robust acceleration of Earth system heating observed over the past six decades". Scientific Reports. 13. doi: 10.1038/s41598-023-49353-1 .
  25. Storto, Andrea; Yang, Chunxue (2024). "Acceleration of the ocean warming from 1961 to 2022 unveiled by large-ensemble reanalyses". Nature Communications. 15 (545). doi: 10.1038/s41467-024-44749-7 .
  26. 1 2 3 4 "Introduction to Physical Oceanography". Open Textbook Library. 2008. Retrieved 2022-11-14.
  27. Vittorio Barale (2010). Oceanography from Space: Revisited. Springer. p. 263. ISBN   978-90-481-8680-8.
  28. "Conductivity, Temperature, Depth (CTD) Sensors - Woods Hole Oceanographic Institution". www.whoi.edu/. Retrieved 2023-03-06.
  29. Boyd, I.L; Hawker, E.J; Brandon, M.A; Staniland, I.J (2001). "Measurement of ocean temperatures using instruments carried by Antarctic fur seals". Journal of Marine Systems. 27 (4): 277–288. doi:10.1016/S0924-7963(00)00073-7.
  30. Alexander Soloviev; Roger Lukas (2006). The near-surface layer of the ocean: structure, dynamics and applications. シュプリンガー・ジャパン株式会社. p. xi. Bibcode:2006nslo.book.....S. ISBN   978-1-4020-4052-8.{{cite book}}: |journal= ignored (help)
  31. P. Krishna Rao; W. L. Smith; R. Koffler (January 1972). "Global Sea-Surface Temperature Distribution Determined From an Environmental Satellite". Monthly Weather Review . 100 (1): 10–14. Bibcode:1972MWRv..100...10K. doi: 10.1175/1520-0493(1972)100<0010:GSTDDF>2.3.CO;2 .
  32. "World Ocean Database Profiles the Ocean". National Centers for Environmental Information. 14 June 2017.
  33. Administration, US Department of Commerce, National Oceanic and Atmospheric. "Deep Argo". oceantoday.noaa.gov. Retrieved 24 December 2021.{{cite web}}: CS1 maint: multiple names: authors list (link)
  34. "Deep Argo: Diving for Answers in the Ocean's Abyss". www.climate.gov. 24 December 2021.
  35. Argo Begins Systematic Global Probing of the Upper Oceans Toni Feder, Phys. Today 53, 50 (2000), Archived 11 July 2007 at the Wayback Machine doi:10.1063/1.1292477
  36. Richard Stenger (19 September 2000). "Flotilla of sensors to monitor world's oceans". CNN. Archived from the original on 6 November 2007.
  37. Cheng, Lijing; Abraham, John; Zhu, Jiang; Trenberth, Kevin E.; Fasullo, John; Boyer, Tim; Locarnini, Ricardo; Zhang, Bin; Yu, Fujiang; Wan, Liying; Chen, Xingrong; Song, Xiangzhou; Liu, Yulong; Mann, Michael E. (2020). "Record-Setting Ocean Warmth Continued in 2019". Advances in Atmospheric Sciences. 37 (2): 137–142. Bibcode:2020AdAtS..37..137C. doi: 10.1007/s00376-020-9283-7 . ISSN   1861-9533. S2CID   210157933.
  38. "Summary for Policymakers". The Ocean and Cryosphere in a Changing Climate (PDF). 2019. pp. 3–36. doi:10.1017/9781009157964.001. ISBN   978-1-00-915796-4. Archived (PDF) from the original on 2023-03-29. Retrieved 2023-03-26.
  39. 1 2 3 Cheng, Lijing; Abraham, John; Trenberth, Kevin E.; Fasullo, John; Boyer, Tim; Mann, Michael E.; Zhu, Jiang; Wang, Fan; Locarnini, Ricardo; Li, Yuanlong; Zhang, Bin; Yu, Fujiang; Wan, Liying; Chen, Xingrong; Feng, Licheng (2023). "Another Year of Record Heat for the Oceans". Advances in Atmospheric Sciences. 40 (6): 963–974. doi: 10.1007/s00376-023-2385-2 . ISSN   0256-1530. PMC   9832248 . PMID   36643611. Text was copied from this source, which is available under a Creative Commons Attribution 4.0 International License
  40. Fox-Kemper, B., H.T. Hewitt, C. Xiao, G. Aðalgeirsdóttir, S.S. Drijfhout, T.L. Edwards, N.R. Golledge, M. Hemer, R.E. Kopp, G. Krinner, A. Mix, D. Notz, S. Nowicki, I.S. Nurhati, L. Ruiz, J.-B. Sallée, A.B.A. Slangen, and Y. Yu, 2021: Chapter 9: Ocean, Cryosphere and Sea Level Change Archived 2022-10-24 at the Wayback Machine . In Climate Change 2021: The Physical Science Basis. Contribution of Working Group I to the Sixth Assessment Report of the Intergovernmental Panel on Climate Change Archived 2021-08-09 at the Wayback Machine [Masson-Delmotte, V., P. Zhai, A. Pirani, S.L. Connors, C. Péan, S. Berger, N. Caud, Y. Chen, L. Goldfarb, M.I. Gomis, M. Huang, K. Leitzell, E. Lonnoy, J.B.R. Matthews, T.K. Maycock, T. Waterfield, O. Yelekçi, R. Yu, and B. Zhou (eds.)]. Cambridge University Press, Cambridge, United Kingdom and New York, NY, USA, pp. 1211–1362
  41. Gille, Sarah T. (2002-02-15). "Warming of the Southern Ocean Since the 1950s". Science . 295 (5558): 1275–1277. Bibcode:2002Sci...295.1275G. doi:10.1126/science.1065863. PMID   11847337. S2CID   31434936.
  42. 1 2 3 Bindoff, N.L., W.W.L. Cheung, J.G. Kairo, J. Arístegui, V.A. Guinder, R. Hallberg, N. Hilmi, N. Jiao, M.S. Karim, L. Levin, S. O'Donoghue, S.R. Purca Cuicapusa, B. Rinkevich, T. Suga, A. Tagliabue, and P. Williamson, 2019: Chapter 5: Changing Ocean, Marine Ecosystems, and Dependent Communities Archived 2019-12-20 at the Wayback Machine . In: IPCC Special Report on the Ocean and Cryosphere in a Changing Climate Archived 2021-07-12 at the Wayback Machine [H.-O. Pörtner, D.C. Roberts, V. Masson-Delmotte, P. Zhai, M. Tignor, E. Poloczanska, K. Mintenbeck, A. Alegría, M. Nicolai, A. Okem, J. Petzold, B. Rama, N.M. Weyer (eds.)]. In press.
  43. 1 2 Fox-Kemper, B., H.T. Hewitt, C. Xiao, G. Aðalgeirsdóttir, S.S. Drijfhout, T.L. Edwards, N.R. Golledge, M. Hemer, R.E. Kopp, G.  Krinner, A. Mix, D. Notz, S. Nowicki, I.S. Nurhati, L. Ruiz, J.-B. Sallée, A.B.A. Slangen, and Y. Yu, 2021: Chapter 9: Ocean, Cryosphere and Sea Level Change. In Climate Change 2021: The Physical Science Basis. Contribution of Working Group I to the Sixth Assessment Report of the Intergovernmental Panel on Climate Change [Masson-Delmotte, V., P. Zhai, A. Pirani, S.L. Connors, C. Péan, S. Berger, N. Caud, Y. Chen, L. Goldfarb, M.I. Gomis, M. Huang, K. Leitzell, E. Lonnoy, J.B.R. Matthews, T.K. Maycock, T. Waterfield, O. Yelekçi, R. Yu, and B. Zhou (eds.)]. Cambridge University Press, Cambridge, United Kingdom and New York, New York, USA, pages 1211–1362, doi:10.1017/9781009157896.011.
  44. Doney, Scott C.; Busch, D. Shallin; Cooley, Sarah R.; Kroeker, Kristy J. (2020-10-17). "The Impacts of Ocean Acidification on Marine Ecosystems and Reliant Human Communities". Annual Review of Environment and Resources. 45 (1): 83–112. doi: 10.1146/annurev-environ-012320-083019 . ISSN   1543-5938. (CC BY 4.0 International license)
  45. Chester, R.; Jickells, Tim (2012). "Chapter 9: Nutrients oxygen organic carbon and the carbon cycle in seawater". Marine geochemistry (3rd ed.). Chichester, West Sussex, UK: Wiley/Blackwell. ISBN   978-1-118-34909-0. OCLC   781078031.
  46. Bindoff, N.L., W.W.L. Cheung, J.G. Kairo, J. Arístegui, V.A. Guinder, R. Hallberg, N. Hilmi, N. Jiao, M.S. Karim, L. Levin, S. O'Donoghue, S.R. Purca Cuicapusa, B. Rinkevich, T. Suga, A. Tagliabue, and P. Williamson, 2019: Chapter 5: Changing Ocean, Marine Ecosystems, and Dependent Communities Archived 2019-12-20 at the Wayback Machine . In: IPCC Special Report on the Ocean and Cryosphere in a Changing Climate Archived 2021-07-12 at the Wayback Machine [H.-O. Pörtner, D.C. Roberts, V. Masson-Delmotte, P. Zhai, M. Tignor, E. Poloczanska, K. Mintenbeck, A. Alegría, M. Nicolai, A. Okem, J. Petzold, B. Rama, N.M. Weyer (eds.)]. In press.
  47. Trenberth, K; Caron, J (2001). "Estimates of Meridional Atmosphere and Ocean Heat Transports". Journal of Climate. 14 (16): 3433–43. Bibcode:2001JCli...14.3433T. doi: 10.1175/1520-0442(2001)014<3433:EOMAAO>2.0.CO;2 .
  48. Knauth, L. Paul (2005). "Temperature and salinity history of the Precambrian ocean: implications for the course of microbial evolution". Palaeogeography, Palaeoclimatology, Palaeoecology. 219 (1–2): 53–69. Bibcode:2005PPP...219...53K. doi:10.1016/j.palaeo.2004.10.014.
  49. Shields, Graham A.; Kasting, James F. (2006). "A palaeotemperature curve for the Precambrian oceans based on silicon isotopes in cherts". Nature. 443 (7114): 969–972. Bibcode:2006Natur.443..969R. doi:10.1038/nature05239. PMID   17066030. S2CID   4417157.
  50. Gaucher, EA; Govindarajan, S; Ganesh, OK (2008). "Palaeotemperature trend for Precambrian life inferred from resurrected proteins". Nature. 451 (7179): 704–707. Bibcode:2008Natur.451..704G. doi:10.1038/nature06510. PMID   18256669. S2CID   4311053.
  51. Risso, VA; Gavira, JA; Mejia-Carmona, DF (2013). "Hyperstability and substrate promiscuity in laboratory resurrections of Precambrian b-lactamases". J Am Chem Soc. 135 (8): 2899–2902. doi:10.1021/ja311630a. hdl: 11336/22624 . PMID   23394108.
  52. Wotte, Thomas; Skovsted, Christian B.; Whitehouse, Martin J.; Kouchinsky, Artem (2019). "Isotopic evidence for temperate oceans during the Cambrian Explosion". Scientific Reports. 9 (1): 6330. Bibcode:2019NatSR...9.6330W. doi: 10.1038/s41598-019-42719-4 . ISSN   2045-2322. PMC   6474879 . PMID   31004083. CC-BY icon.svg Text was copied from this source, which is available under a Creative Commons Attribution 4.0 International License Archived 2017-10-16 at the Wayback Machine
  53. Wotte, Thomas; Skovsted, Christian B.; Whitehouse, Martin J.; Kouchinsky, Artem (2019). "Isotopic evidence for temperate oceans during the Cambrian Explosion". Scientific Reports. 9 (1): 6330. Bibcode:2019NatSR...9.6330W. doi:10.1038/s41598-019-42719-4. ISSN   2045-2322. PMC   6474879 . PMID   31004083.
  54. Renne, Paul R.; Deino, Alan L.; Hilgen, Frederik J.; Kuiper, Klaudia F.; Mark, Darren F.; Mitchell, William S.; Morgan, Leah E.; Mundil, Roland; Smit, Jan (7 February 2013). "Time Scales of Critical Events Around the Cretaceous-Paleogene Boundary". Science. 339 (6120): 684–687. Bibcode:2013Sci...339..684R. doi:10.1126/science.1230492. PMID   23393261. S2CID   6112274.