Global oceanic and terrestrial photoautotroph abundance, from September 1997 to August 2000. As an estimate of autotroph biomass, it is only a rough indicator of primary-production potential, and not an actual estimate of it. Provided by the SeaWiFS Project, NASA/Goddard Space Flight Center and GeoEye.
In ecology, primary production is the synthesis of organic compounds from atmospheric or aqueous carbon dioxide. It principally occurs through the process of photosynthesis, which uses light as its source of energy, but it also occurs through chemosynthesis, which uses the oxidation or reduction of inorganic chemical compounds as its source of energy. Almost all life on Earth relies directly or indirectly on primary production. The organisms responsible for primary production are known as primary producers or autotrophs, and form the base of the food chain. In terrestrial ecoregions, these are mainly plants, while in aquatic ecoregionsalgae predominate in this role. Ecologists distinguish primary production as either net or gross, the former accounting for losses to processes such as cellular respiration, the latter not.
Primary production is the production of chemical energy, in organic compounds by living organisms. The main source of such energy is sunlight, but a minute fraction of primary production is driven by lithotrophic organisms, using the chemical energy of inorganic molecules.
Regardless of its source, this energy is used to synthesize complex organic molecules from simpler, inorganic, compounds; carbon dioxide (CO2) and water (H2O) are both typical and fundamental examples[citation needed]. The following two equations are simplified representations of photosynthesis (top) and (one form of) chemosynthesis (bottom):
Gross primary production and net primary production
Gross primary production (GPP) is the amount of chemical energy, typically expressed as carbon biomass, that primary producers create in a given length of time. Some fraction of this fixed energy is used by primary producers for cellular respiration and maintenance of existing tissues (i.e., "growth respiration" and "maintenance respiration").[1][2] The remaining fixed energy (i.e., mass of photosynthate) is referred to as net primary production (NPP).
NPP = GPP - respiration [by plants]
Net primary production is the rate at which all the autotrophs in an ecosystem produce net useful chemical energy. Net primary production is available to be directed toward growth and reproduction of primary producers. As such it is available for consumption by herbivores.[citation needed]
Both gross and net primary production are typically expressed in units of mass per unit area per unit time interval. In terrestrial ecosystems, mass of carbon per unit area per year (g C m−2 yr−1) is most often used as the unit of measurement. Note that a distinction is sometimes drawn between "production" and "productivity", with the former the quantity of material produced (g C m−2), the latter the rate at which it is produced (g C m−2 yr−1), but these terms are more typically used interchangeably.[citation needed]
Terrestrial production
This animation shows Earth's monthly terrestrial net primary productivity from 2000 to 2013. Values range from near 0 grams of carbon per square meter per day (tan) to 6.5 grams per square meter per day (dark green). A negative value means decomposition or respiration overpowered carbon absorption; more carbon was released to the atmosphere than the plants took in. In mid-latitudes, productivity obviously interacts with seasonal change, with productivity peaking in each hemisphere's summer. The data come from the Moderate Resolution Imaging Spectroradiometer (MODIS) on NASA's Terra satellite.[3]
On the land, almost all primary production is now performed by vascular plants, with a small fraction coming from algae and non-vascular plants such as mosses and liverworts. Before the evolution of vascular plants, non-vascular plants likely played a more significant role. Primary production on land is a function of many factors, but principally local hydrology and temperature (the latter covaries to an extent with light, specifically photosynthetically active radiation (PAR), the source of energy for photosynthesis). While plants cover much of the Earth's surface, they are strongly curtailed wherever temperatures are too extreme or where necessary plant resources (principally water and PAR) are limiting, such as deserts or polar regions.[citation needed]
Water is "consumed" in plants by the processes of photosynthesis (see above) and transpiration. The latter process (which is responsible for about 90% of water use) is driven by the evaporation of water from the leaves of plants. Transpiration allows plants to transport water and mineralnutrients from the soil to growth regions, and also cools the plant. Diffusion of water vapour out of a leaf, the force that drives transpiration, is regulated by structures known as stomata. These structures also regulate the diffusion of carbon dioxide from the atmosphere into the leaf, such that decreasing water loss (by partially closing stomata) also decreases carbon dioxide gain. Certain plants use alternative forms of photosynthesis, called Crassulacean acid metabolism (CAM) and C4. These employ physiological and anatomical adaptations to increase water-use efficiency and allow increased primary production to take place under conditions that would normally limit carbon fixation by C3 plants (the majority of plant species).[citation needed]
As shown in the animation, the boreal forests of Canada and Russia experience high productivity in June and July and then a slow decline through fall and winter. Year-round, tropical forests in South America, Africa, Southeast Asia, and Indonesia have high productivity, not surprising with the abundant sunlight, warmth, and rainfall. However, even in the tropics, there are variations in productivity over the course of the year. For example, the Amazon basin exhibits especially high productivity from roughly August through October - the period of the area's dry season. Because the trees have access to a plentiful supply of ground water that builds up in the rainy season, they grow better when the rainy skies clear and allow more sunlight to reach the forest.[3]
In a reversal of the pattern on land, in the oceans, almost all photosynthesis is performed by algae, with a small fraction contributed by vascular plants and other groups. Algae encompass a diverse range of organisms, ranging from single floating cells to attached seaweeds. They include photoautotrophs from a variety of groups. Eubacteria are important photosynthetizers in both oceanic and terrestrial ecosystems, and while some archaea are phototrophic, none are known to utilise oxygen-evolving photosynthesis.[4] A number of eukaryotes are significant contributors to primary production in the ocean, including green algae, brown algae and red algae, and a diverse group of unicellular groups. Vascular plants are also represented in the ocean by groups such as the seagrasses.[citation needed]
Unlike terrestrial ecosystems, the majority of primary production in the ocean is performed by free-living microscopic organisms called phytoplankton. Larger autotrophs, such as the seagrasses and macroalgae (seaweeds) are generally confined to the littoral zone and adjacent shallow waters, where they can attach to the underlying substrate but still be within the photic zone. There are exceptions, such as Sargassum, but the vast majority of free-floating production takes place within microscopic organisms.
Differences in relative photosynthesis between plankton species under different irradiance
The factors limiting primary production in the ocean are also very different from those on land. The availability of water, obviously, is not an issue (though its salinity can be). Similarly, temperature, while affecting metabolic rates (see Q10), ranges less widely in the ocean than on land because the heat capacity of seawater buffers temperature changes, and the formation of sea iceinsulates it at lower temperatures. However, the availability of light, the source of energy for photosynthesis, and mineral nutrients, the building blocks for new growth, play crucial roles in regulating primary production in the ocean.[5] Available Earth System Models suggest that ongoing ocean bio-geochemical changes could trigger reductions in ocean NPP between 3% and 10% of current values depending on the emissions scenario.[6]
The sunlit zone of the ocean is called the photic zone (or euphotic zone). This is a relatively thin layer (10–100 m) near the ocean's surface where there is sufficient light for photosynthesis to occur. For practical purposes, the thickness of the photic zone is typically defined by the depth at which light reaches 1% of its surface value. Light is attenuated down the water column by its absorption or scattering by the water itself, and by dissolved or particulate material within it (including phytoplankton).[citation needed]
Net photosynthesis in the water column is determined by the interaction between the photic zone and the mixed layer. Turbulent mixing by wind energy at the ocean's surface homogenises the water column vertically until the turbulence dissipates (creating the aforementioned mixed layer). The deeper the mixed layer, the lower the average amount of light intercepted by phytoplankton within it. The mixed layer can vary from being shallower than the photic zone, to being much deeper than the photic zone. When it is much deeper than the photic zone, this results in phytoplankton spending too much time in the dark for net growth to occur. The maximum depth of the mixed layer in which net growth can occur is called the critical depth. As long as there are adequate nutrients available, net primary production occurs whenever the mixed layer is shallower than the critical depth.
Both the magnitude of wind mixing and the availability of light at the ocean's surface are affected across a range of space- and time-scales. The most characteristic of these is the seasonal cycle (caused by the consequences of the Earth's axial tilt), although wind magnitudes additionally have strong spatial components. Consequently, primary production in temperate regions such as the North Atlantic is highly seasonal, varying with both incident light at the water's surface (reduced in winter) and the degree of mixing (increased in winter). In tropical regions, such as the gyres in the middle of the major basins, light may only vary slightly across the year, and mixing may only occur episodically, such as during large storms or hurricanes.
Mixing also plays an important role in the limitation of primary production by nutrients. Inorganic nutrients, such as nitrate, phosphate and silicic acid are necessary for phytoplankton to synthesise their cells and cellular machinery. Because of gravitational sinking of particulate material (such as plankton, dead or fecal material), nutrients are constantly lost from the photic zone, and are only replenished by mixing or upwelling of deeper water. This is exacerbated where summertime solar heating and reduced winds increases vertical stratification and leads to a strong thermocline, since this makes it more difficult for wind mixing to entrain deeper water. Consequently, between mixing events, primary production (and the resulting processes that leads to sinking particulate material) constantly acts to consume nutrients in the mixed layer, and in many regions this leads to nutrient exhaustion and decreased mixed layer production in the summer (even in the presence of abundant light). However, as long as the photic zone is deep enough, primary production may continue below the mixed layer where light-limited growth rates mean that nutrients are often more abundant.
Iron
Another factor relatively recently discovered to play a significant role in oceanic primary production is the micronutrientiron.[7] This is used as a cofactor in enzymes involved in processes such as nitrate reduction and nitrogen fixation. A major source of iron to the oceans is dust from the Earth's deserts, picked up and delivered by the wind as aeolian dust.
In regions of the ocean that are distant from deserts or that are not reached by dust-carrying winds (for example, the Southern and North Pacific oceans), the lack of iron can severely limit the amount of primary production that can occur. These areas are sometimes known as HNLC (High-Nutrient, Low-Chlorophyll) regions, because the scarcity of iron both limits phytoplankton growth and leaves a surplus of other nutrients. Some scientists have suggested introducing iron to these areas as a means of increasing primary productivity and sequestering carbon dioxide from the atmosphere.[8]
Measurement
The methods for measurement of primary production vary depending on whether gross vs net production is the desired measure, and whether terrestrial or aquatic systems are the focus. Gross production is almost always harder to measure than net, because of respiration, which is a continuous and ongoing process that consumes some of the products of primary production (i.e. sugars) before they can be accurately measured. Also, terrestrial ecosystems are generally more difficult because a substantial proportion of total productivity is shunted to below-ground organs and tissues, where it is logistically difficult to measure. Shallow water aquatic systems can also face this problem.
Scale also greatly affects measurement techniques. The rate of carbon assimilation in plant tissues, organs, whole plants, or plankton samples can be quantified by biochemically based techniques, but these techniques are decidedly inappropriate for large scale terrestrial field situations. There, net primary production is almost always the desired variable, and estimation techniques involve various methods of estimating dry-weight biomass changes over time. Biomass estimates are often converted to an energy measure, such as kilocalories, by an empirically determined conversion factor.
Terrestrial
An oak tree; a typical modern, terrestrial autotroph
In terrestrial ecosystems, researchers generally measure net primary production (NPP). Although its definition is straightforward, field measurements used to estimate productivity vary according to investigator and biome. Field estimates rarely account for below ground productivity, herbivory, turnover, litterfall, volatile organic compounds, root exudates, and allocation to symbiotic microorganisms. Biomass based NPP estimates result in underestimation of NPP due to incomplete accounting of these components.[9][10] However, many field measurements correlate well to NPP. There are a number of comprehensive reviews of the field methods used to estimate NPP.[9][10][11] Estimates of ecosystem respiration, the total carbon dioxide produced by the ecosystem, can also be made with gas flux measurements.
The major unaccounted pool is belowground productivity, especially production and turnover of roots. Belowground components of NPP are difficult to measure. BNPP (below-ground NPP) is often estimated based on a ratio of ANPP:BNPP (above-ground NPP:below-ground NPP) rather than direct measurements.
Gross primary production can be estimated from measurements of net ecosystem exchange (NEE) of carbon dioxide made by the eddy covariance technique. During night, this technique measures all components of ecosystem respiration. This respiration is scaled to day-time values and further subtracted from NEE.[12]
Most frequently, peak standing biomass is assumed to measure NPP. In systems with persistent standing litter, live biomass is commonly reported. Measures of peak biomass are more reliable if the system is predominantly annuals. However, perennial measurements could be reliable if there were a synchronous phenology driven by a strong seasonal climate. These methods may underestimate ANPP in grasslands by as much as 2 (temperate) to 4 (tropical) fold.[10] Repeated measures of standing live and dead biomass provide more accurate estimates of all grasslands, particularly those with large turnover, rapid decomposition, and interspecific variation in timing of peak biomass. Wetland productivity (marshes and fens) is similarly measured. In Europe, annual mowing makes the annual biomass increment of wetlands evident.
Forests
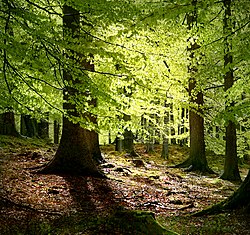
Forest
Methods used to measure forest productivity are more diverse than those of grasslands. Biomass increment based on stand specific allometry plus litterfall is considered a suitable although incomplete accounting of above-ground net primary production (ANPP).[9] Field measurements used as a proxy for ANPP include annual litterfall, diameter or basal area increment (DBH or BAI), and volume increment.
The technique developed by Gaarder and Gran uses variations in the concentration of oxygen under different experimental conditions to infer gross primary production. Typically, three identical transparent vessels are filled with sample water and stoppered. The first is analysed immediately and used to determine the initial oxygen concentration; usually this is done by performing a Winkler titration. The other two vessels are incubated, one each in under light and darkened. After a fixed period of time, the experiment ends, and the oxygen concentration in both vessels is measured. As photosynthesis has not taken place in the dark vessel, it provides a measure of ecosystem respiration. The light vessel permits both photosynthesis and respiration, so provides a measure of net photosynthesis (i.e. oxygen production via photosynthesis subtract oxygen consumption by respiration). Gross primary production is then obtained by adding oxygen consumption in the dark vessel to net oxygen production in the light vessel.
The technique of using 14C incorporation (added as labelled Na2CO3) to infer primary production is most commonly used today because it is sensitive, and can be used in all ocean environments. As 14C is radioactive (via beta decay), it is relatively straightforward to measure its incorporation in organic material using devices such as scintillation counters.
Depending upon the incubation time chosen, net or gross primary production can be estimated. Gross primary production is best estimated using relatively short incubation times (1 hour or less), since the loss of incorporated 14C (by respiration and organic material excretion / exudation) will be more limited. Net primary production is the fraction of gross production remaining after these loss processes have consumed some of the fixed carbon.
Loss processes can range between 10 and 60% of incorporated 14C according to the incubation period, ambient environmental conditions (especially temperature) and the experimental species used. Aside from those caused by the physiology of the experimental subject itself, potential losses due to the activity of consumers also need to be considered. This is particularly true in experiments making use of natural assemblages of microscopic autotrophs, where it is not possible to isolate them from their consumers.
The methods based on stable isotopes and O2/Ar ratios have the advantage of providing estimates of respiration rates in the light without the need of incubations in the dark. Among them, the method of the triple oxygen isotopes and O2/Ar have the additional advantage of not needing incubations in closed containers and O2/Ar can even be measured continuously at sea using equilibrator inlet mass spectrometry (EIMS)[20] or a membrane inlet mass spectrometry (MIMS).[21] However, if results relevant to the carbon cycle are desired, it is probably better to rely on methods based on carbon (and not oxygen) isotopes. It is important to notice that the method based on carbon stable isotopes is not simply an adaptation of the classic 14C method, but an entirely different approach that does not suffer from the problem of lack of account of carbon recycling during photosynthesis.
Global
As primary production in the biosphere is an important part of the carbon cycle, estimating it at the global scale is important in Earth system science. However, quantifying primary production at this scale is difficult because of the range of habitats on Earth, and because of the impact of weather events (availability of sunlight, water) on its variability. Using satellite-derived estimates of the Normalized Difference Vegetation Index (NDVI) for terrestrial habitats and sea-surface chlorophyll for the oceans, it is estimated that the total (photoautotrophic) primary production for the Earth was 104.9 petagrams of carbon per year (Pg C yr−1; equivalent to the non-SI Gt C yr−1).[22] Of this, 56.4 Pg C yr−1 (53.8%), was the product of terrestrial organisms, while the remaining 48.5 Pg C yr−1, was accounted for by oceanic production.
Scaling ecosystem-level GPP estimations based on eddy covariance measurements of net ecosystem exchange (see above) to regional and global values using spatial details of different predictor variables, such as climate variables and remotely sensed fAPAR or LAI led to a terrestrial gross primary production of 123±8 Gt carbon (NOT carbon dioxide) per year during 1998-2005 [23]
In areal terms, it was estimated that land production was approximately 426 g C m−2 yr−1 (excluding areas with permanent ice cover), while that for the oceans was 140 g C m−2 yr−1.[22] Another significant difference between the land and the oceans lies in their standing stocks - while accounting for almost half of total production, oceanic autotrophs only account for about 0.2% of the total biomass.
Present and Past Estimates
Present day primary productivity can be estimated through a variety of methodologies including ship-board measurements, satellites and terrestrial observatories. Historical estimates have relied on biogeochemical models and geochemical proxies. One example is using barium, where barite concentrations in marine sediments rise in line with carbon export production at the surface.[24][25][26] Another example is using the triple oxygen isotopes of sulfate.[27][28][29] Together these records suggest large shifts in primary production throughout Earth's past with notable rises associated with Earth's Great Oxidation Event (approximately 2.4 to 2.0 billion years ago) and the Neoproterozoic (approximately 1.0 to 0.54 billion years ago).[29]
Human impact and appropriation
Human societies are part of the Earth's NPP cycle but disproportionately influence it.[30] In 1996, Josep Garí designed a new indicator of sustainable development based precisely on the estimation of the human appropriation of NPP: he coined it "HANPP" (Human Appropriation of Net Primary Production) and introduced it at the inaugural conference of the European Society for Ecological Economics.[31] HANPP has since been further developed and widely applied in research on ecological economics and in policy analysis for sustainability. HANPP represents a proxy of the human impact on nature and can be applied to different geographical and global scales.
The extensive degree of human use of the Planet's resources, mostly via land use, results in various levels of impact on actual NPP (NPPact). Although in some regions, such as the Nile valley, irrigation has resulted in a considerable increase in primary production, in most of the Planet, there is a notable trend of NPP reduction due to land changes (ΔNPPLC) of 9.6% across global land-mass.[32] In addition to this, end consumption by people raises the total HANPP [30] to 23.8% of potential vegetation (NPP0).[32] It is estimated that, in 2000, 34% of the Earth's ice-free land area (12% cropland; 22% pasture) was devoted to human agriculture.[33] This disproportionate amount reduces the energy available to other species, having a marked impact on biodiversity, flows of carbon, water, and energy, and ecosystem services,.[32] Scientists have questioned how large this fraction can be before these services break down.[34] Reductions in NPP are also expected in the ocean as a result of ongoing climate change, potentially impacting marine ecosystems (~10% of global biodiversity) and goods and services (1-5% of global total) that the oceans provide.[6]
↑Amthor, J.S. and Baldocchi, D.D. (2001). Terrestrial Higher Plant Respiration and Net Primary Production. In Terrestrial Global Productivity, Academic Press, 33-59
↑Sigman, D.M.; Hain, M.P. (2012). "The Biological Productivity of the Ocean"(PDF). Nature Education Knowledge. 3 (6): 1–16. Retrieved 2015-06-01. "Gross primary production" (GPP) refers to the total rate of organic carbon production by autotrophs, while "respiration" refers to the energy-yielding oxidation of organic carbon back to carbon dioxide. "Net primary production"(NPP) is GPP minus the autotrophs' own rate of respiration; it is thus the rate at which the full metabolism of phytoplankton produces biomass. "Secondary production" (SP) typically refers to the growth rate of heterotrophic biomass.
↑Sigman, D.M.; Hain, M.P. (2012). "The Biological Productivity of the Ocean"(PDF). Nature Education Knowledge. 3 (6): 1–16. Retrieved 2015-06-01. The deep chlorophyll maximum (DCM) occurs at the contact where there is adequate light for photosynthesis and yet significant nutrient supply from below.
↑Cooper, D.J.; Watson, A.J.; Nightingale, P.D. (1996). "Large decrease in ocean—surface CO2 fugacity in response to in situ iron fertilization". Nature. 383 (6600): 511–513. Bibcode:1996Natur.383..511C. doi:10.1038/383511a0. S2CID4325717.
↑Reichstein, Markus; Falge, Eva; Baldocchi, Dennis; Papale, Dario; Aubinet, Marc; Berbigier, Paul; etal. (2005). "On the separation of net ecosystem exchange into assimilation and ecosystem respiration: review and improved algorithm". Global Change Biology. 11 (9): 1424–1439. Bibcode:2005GCBio..11.1424R. doi:10.1111/j.1365-2486.2005.001002.x. ISSN1354-1013. S2CID55932276.
↑Marra, J. (2002), pp. 78-108. In: Williams, P. J. leB., Thomas, D. N., Reynolds, C. S. (Eds.), Phytoplankton Productivity:Carbon Assimilation in Marine and Freshwater Ecosystems. Blackwell, Oxford, UK
↑Steeman-Nielsen, E. (1952). "The use of radioactive carbon (C14) for measuring organic production in the sea". J. Cons. Int. Explor. Mer. 18 (2): 117–140. doi:10.1093/icesjms/18.2.117.
↑Carvalho and Eyre (2012). "Measurement of planktonic CO2 respiration in the light". Limnology and Oceanography: Methods. 10 (3): 167–178. doi:10.4319/lom.2012.10.167. S2CID93847401.
↑Prakash Babua, C.; Brumsack, H.-J.; Schnetger, B.; Böttcher, M.E. (2002). "Barium as a productivity proxy in continental margin sediments: a study from the eastern Arabian Sea". Marine Geology. 184 (3–4): 189–206. Bibcode:2002MGeol.184..189P. doi:10.1016/S0025-3227(01)00286-9.
↑E.D. Goldberg, G.O.S. Arrhenius Chemistry of pelagic sediments Geochim. Cosmochim. Acta, 13 (1958), pp. 153-212
↑Garí, J.A. (1996). "HANPP calculated from land cover as indicator of ecological sustainability". Proceedings of the International Conference: Ecology, Society, Economy: 1–18. hdl:10419/183215.
This page is based on this Wikipedia article Text is available under the CC BY-SA 4.0 license; additional terms may apply. Images, videos and audio are available under their respective licenses.