The eddy covariance (also known as eddy correlation and eddy flux) is a key atmospheric measurement technique to measure and calculate vertical turbulent fluxes within atmospheric boundary layers. The method analyses high-frequency wind and scalar atmospheric data series, gas, energy, and momentum,[1] which yields values of fluxes of these properties. It is a statistical method used in meteorology and other applications (micrometeorology, oceanography, hydrology, agricultural sciences, industrial and regulatory applications, etc.) to determine exchange rates of trace gases over natural ecosystems and agricultural fields, and to quantify gas emissions rates from other land and water areas. It is frequently used to estimate momentum, heat, water vapour, carbon dioxide and methane fluxes.[2][3][4][5][6][7]
The technique is also used extensively for verification and tuning of global climate models, mesoscale and weather models, complex biogeochemical and ecological models, and remote sensing estimates from satellites and aircraft. The technique is mathematically complex, and requires significant care in setting up and processing data. To date,[when?] there is no uniform terminology or a single methodology for the eddy covariance technique, but much effort is being made by flux measurement networks (e.g., FluxNet, Ameriflux, ICOS, CarboEurope, Fluxnet Canada, OzFlux, NEON, and iLEAPS) to unify the various approaches.
An eddy correlation instrument measuring oxygen fluxes in benthic environments.
The technique has additionally proven applicable under water to the benthic zone for measuring oxygen fluxes between the sea floor and overlying water.[8] In these environments, the technique is generally known as the eddy correlation technique, or just eddy correlation. Oxygen fluxes are extracted from raw measurements largely following the same principles as used in the atmosphere, and they are typically used as a proxy for carbon exchange, which is important for local and global carbon budgets. For most benthic ecosystems, eddy correlation is the most accurate technique for measuring in-situ fluxes. The technique's development and its applications under water remains a fruitful area of research.[9][10][11][12][13]
General principles
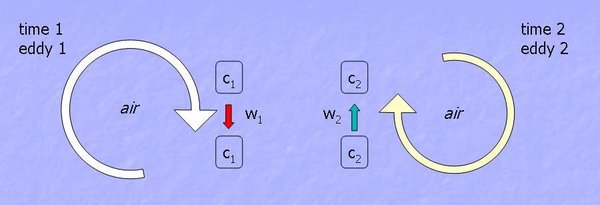
Representation of the air flow in the atmospheric boundary layer
Air flow can be imagined as a horizontal flow of numerous rotating eddies, that is, turbulent vortices of various sizes, with each eddy having horizontal and vertical components. Vertical movement of the components can be measured from the tower.
At one physical point on the tower, at time 1, eddy 1 moves parcel of air c1 down at speed . Then, at time 2, eddy 2 moves parcel c2 up at speed . Each parcel has gas concentration, pressure, temperature, and humidity. If these factors, along with the speed are known, we can determine the flux. For example, if one knew how many molecules of water went down with eddies at time 1, and how many molecules went up with eddies at time 2, at the same point, one could calculate the vertical flux of water at this point over this time. So, vertical flux can be presented as a covariance of the vertical wind velocity and the concentration of the entity of interest.
The 3D wind and another variable (usually gas concentration, temperature or momentum) are decomposed into mean and fluctuating components. The covariance is calculated between the fluctuating component of the vertical wind and the fluctuating component of gas concentration. The measured flux is proportional to the covariance.
The area from which the detected eddies originate is described probabilistically and called a flux footprint.[14] The flux footprint area is dynamic in size and shape, changing with wind direction, thermal stability and measurements height, and has a gradual border.
The effect of sensor separation, finite sampling length, sonic path averaging, as well as other instrumental limitations, affect frequency response of the measurement system and may need a co-spectral correction, especially noticeable with closed-path instruments and at low heights below 1to1.5m.
Mathematical foundation
In mathematical terms, "eddy flux" is computed as a covariance between instantaneous deviation in vertical wind speed () from the mean value () and instantaneous deviation in gas concentration, mixing ratio (), from its mean value (), multiplied by mean air density (). Several mathematical operations and assumptions, including Reynolds decomposition, are involved in getting from physically complete equations of the turbulent flow to practical equations for computing "eddy flux," as shown below.
Measurements at a point can represent an upwind area
Measurements are done inside the boundary layer of interest
Fetch/flux footprint is adequate – fluxes are measured only at area of interest
Flux is fully turbulent – most of the net vertical transfer is done by eddies
Terrain is horizontal and uniform: average of fluctuations is zero; density fluctuations negligible; flow convergence & divergence negligible
Instruments can detect very small changes at high frequency, ranging from minimum of 5Hz and to 40Hz for tower-based measurements
Software
As of 2011 there were many software programs[15] to process eddy covariance data and derive quantities such as heat, momentum, and gas fluxes. The programs range significantly in complexity, flexibility, number of allowed instruments and variables, help system and user support. Some programs are open-source software, while others are closed-source or proprietary.
Carbon sequestration and capture monitoring, with research by scientists like Ram Ray integrating eddy covariance data with satellite remote sensing to quantify carbon fluxes over large areas.[17]
Remote sensing is an approach to modeling evapotranspiration using an energy balance and the latent heat flux to find evapotranspiration rates. Evapotranspiration (ET) is a part of the water cycle, and accurate ET readings are important to local and global models to manage water resources. ET rates are an important part of research in hydrology related fields, as well as for farming practices. MOD16 is an example of a program which measures ET best for temperate climates.[1][18]
Micrometeorology
Micrometeorology focuses climate study on the specific vegetation canopy scale, again with applications to hydrological and ecologic research. In this context, eddy covariance can be used to measure heat mass flux in the boundary surface layer, or in the boundary layer surrounding the vegetation canopy. The effects of turbulence may for example be of specific interest to climate modelers or those studying the local ecosystem. Wind speed, turbulence, and mass (heat) concentration are values that could be recorded in a flux tower. Through measurements related to eddy covariance properties such as roughness coefficients may be empirically calculated, with applications to modeling.[19]
Wetland ecosystems
Wetland vegetation varies widely and varies from plant to plant ecologically. Primary plant existence in wetlands can be monitored by using eddy covariance technology in conjunction with nutrient supply information by monitoring net CO2 and H2O fluxes. Readings can be taken from flux towers over a number of years to determine water use efficiency among others.[20]
Greenhouse gasses and their warming effect
Fluxes of greenhouse gasses from vegetation and agricultural fields can be measured by eddy covariance as referenced in micrometeorology section above. By measuring vertical turbulent flux of gas states of H2O, CO2, heat, and CH4 among other volatile organic compounds monitoring equipment can be used to infer canopy interaction. Landscape wide interpretations can be then inferred using the above data. High operational cost, weather limitations (some equipment is better suited for certain climates), and their resulting technical limitations may limit measurement accuracy.[21]
Vegetation production in terrestrial ecosystems
Vegetation production models require accurate ground observations, in this context from eddy covariant flux measurement. Eddy covariance is used to measure the net primary production, and gross primary productions of plant populations. Advancements in technology have allowed for minor fluctuations resulting in a scale of 100-2000 meter measurements of air mass and energy readings. Study of the carbon cycle on vegetated growth and production is vitally important to both growers and scientists. Using such information carbon flux between ecosystems and the atmosphere can be observed, with applications ranging from climate change to weather models.[1]
Related methods
Eddy accumulation
True eddy accumulation
The true eddy accumulation technique can be used to measure fluxes of trace gases for which there are no fast enough analysers available, thus where the eddy covariance technique is unsuitable. The basic idea is that upwards moving air parcels (updrafts) and downwards moving air parcels (downdrafts) are sampled proportionally to their velocity into separate reservoirs. A slow response gas analyser can then be used to quantify the average gas concentrations in both updraft and downdraft reservoirs.[22][23]
Relaxed eddy accumulation
The main difference between the true and the relaxed eddy accumulation technique is that the latter samples air with a constant flow rate that is not proportional to the vertical wind speed.[24][25][26]
↑ Baldocchi, D., B. Hicks, and T. Meyers. 1988. Measuring biosphere-atmosphere exchanges of biologically related gases with micrometeorological methods. Ecology 69, 1331-1340
↑ Verma, S.B.: 1990, Micrometeorological methods for measuring surface fluxes of mass and energy, Remote Sensing Reviews 5(1): 99-115
↑ Lee, X., W. Massman, and B. Law. 2004. Handbook of Micrometeorology. Kluwer Academic Publishers, The Netherlands, 250 pp.
1 2 3 4 Burba, G., 2013. Eddy Covariance Method for Scientific, Industrial, Agricultural and Regulatory Applications: a Field Book on Measuring Ecosystem Gas Exchange and Areal Emission Rates. LI-COR Biosciences, Lincoln, USA, 331 pp.
↑ Aubinet, M., T. Vesala, D. Papale (Eds.), 2012. Eddy Covariance: A Practical Guide to Measurement and Data Analysis. Springer Atmospheric Sciences, Springer Verlag, 438 pp.
↑ Berg, P., H. Røy, F. Janssen, V. Meyer, B. B. Jørgensen, M. Hüttel, and D. de Beer. 2003. Oxygen uptake by aquatic sediments measured with a novel non-invasive eddy correlation technique. Marine Ecology Progress Series. 261:75-83.
↑ Kljun, N., P. Calanca, M.W. Rotach, and H.P. Schmid. 2015. A simple two-dimensional parameterisation for Flux Footprint Prediction (FFP). Geosci. Model Dev., 8, 3695–3713, doi: 10.5194/gmd-8-3695-2015
↑ M. Mauder, T. Foken, R. Clement, J. A. Elbers, W. Eugster, T. Grunwald, B. Heusinkveld, and O. Kolle. 2007. Quality control of CarboEurope flux data – Part II: Inter-comparison of eddy-covariance software, Biogeosciences Discuss., 4, 4067–4099
↑ Striednig, M., M. Graus, T.D. Maerk, and T. Karl. 2020. InnFLUX - an open-source code for conventional and disjunct eddy covariance analysis of trace gas measurements: an urban test case. AMT 13, 1447-1465, doi: 10.5194/amt-13-1447-2020
↑ R. E. Speer, K. A. Peterson, T. G. Ellestad, J. L. Durham (1985). "Test of a prototype eddy accumulator for measuring atmospheric vertical fluxes of water vapor and particulate sulfate". Journal of Geophysical Research. 90 (D1): 2119–2122. Bibcode:1985JGR....90.2119S. doi:10.1029/JD090iD01p02119.{{cite journal}}: CS1 maint: multiple names: authors list (link)
↑ Siebicke, Lukas (2017). "True eddy accumulation and eddy covariance methods and instruments intercomparison for fluxes of CO2, CH4 and H2O above the Hainich Forest". 19th EGU General Assembly, EGU2017. 19: 18076. Bibcode:2017EGUGA..1918076S.
This page is based on this Wikipedia article Text is available under the CC BY-SA 4.0 license; additional terms may apply. Images, videos and audio are available under their respective licenses.