Evapotranspiration (ET) refers to the combined processes which move water from the Earth's surface into the atmosphere. It covers both water evaporation and transpiration. Evapotranspiration is an important part of the local water cycle and climate, and measurement of it plays a key role in agricultural irrigation and water resource management.
In common usage, wind gradient, more specifically wind speed gradient or wind velocity gradient, or alternatively shear wind, is the vertical component of the gradient of the mean horizontal wind speed in the lower atmosphere. It is the rate of increase of wind strength with unit increase in height above ground level. In metric units, it is often measured in units of meters per second of speed, per kilometer of height (m/s/km), which reduces inverse milliseconds (ms−1), a unit also used for shear rate.
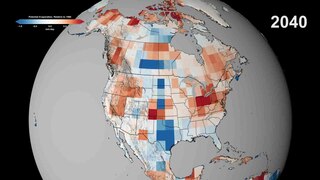
Potential evapotranspiration (PET) or potential evaporation (PE) is the amount of water that would be evaporated and transpired by a specific crop, soil or ecosystem if there was sufficient water available. It is a reflection of the energy available to evaporate or transpire water, and of the wind available to transport the water vapor from the ground up into the lower atmosphere and away from the initial location. Potential evapotranspiration is expressed in terms of a depth of water or soil moisture percentage.

The surface layer is the layer of a turbulent fluid most affected by interaction with a solid surface or the surface separating a gas and a liquid where the characteristics of the turbulence depend on distance from the interface. Surface layers are characterized by large normal gradients of tangential velocity and large concentration gradients of any substances transported to or from the interface.

In meteorology, the planetary boundary layer (PBL), also known as the atmospheric boundary layer (ABL) or peplosphere, is the lowest part of the atmosphere and its behaviour is directly influenced by its contact with a planetary surface. On Earth it usually responds to changes in surface radiative forcing in an hour or less. In this layer physical quantities such as flow velocity, temperature, and moisture display rapid fluctuations (turbulence) and vertical mixing is strong. Above the PBL is the "free atmosphere", where the wind is approximately geostrophic, while within the PBL the wind is affected by surface drag and turns across the isobars.

Roughness length is a parameter of some vertical wind profile equations that model the horizontal mean wind speed near the ground. In the log wind profile, it is equivalent to the height at which the wind speed theoretically becomes zero in the absence of wind-slowing obstacles and under neutral conditions. In reality, the wind at this height no longer follows a mathematical logarithm. It is so named because it is typically related to the height of terrain roughness elements. For instance, forests tend to have much larger roughness lengths than tundra. The roughness length does not exactly correspond to any physical length. However, it can be considered as a length-scale representation of the roughness of the surface.

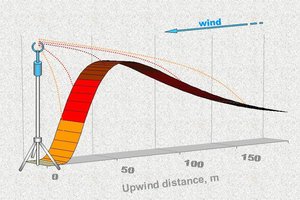
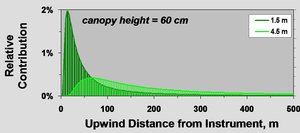
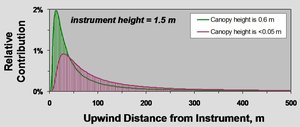
The eddy covariance is a key atmospheric measurement technique to measure and calculate vertical turbulent fluxes within atmospheric boundary layers. The method analyses high-frequency wind and scalar atmospheric data series, gas, energy, and momentum, which yields values of fluxes of these properties. It is a statistical method used in meteorology and other applications to determine exchange rates of trace gases over natural ecosystems and agricultural fields, and to quantify gas emissions rates from other land and water areas. It is frequently used to estimate momentum, heat, water vapour, carbon dioxide and methane fluxes.

An urban canyon is a place where the street is flanked by buildings on both sides creating a canyon-like environment, evolved etymologically from the Canyon of Heroes in Manhattan. Such human-built canyons are made when streets separate dense blocks of structures, especially skyscrapers. Other examples include the Magnificent Mile in Chicago, Los Angeles' Wilshire Boulevard corridor, Toronto's Financial District, and Hong Kong's Kowloon and Central districts.
The wind profile power law is a relationship between the wind speeds at one height, and those at another.
The log wind profile is a semi-empirical relationship commonly used to describe the vertical distribution of horizontal mean wind speeds within the lowest portion of the planetary boundary layer. The relationship is well described in the literature.
The following outline is provided as an overview of and topical guide to air pollution dispersion: In environmental science, air pollution dispersion is the distribution of air pollution into the atmosphere. Air pollution is the introduction of particulates, biological molecules, or other harmful materials into Earth's atmosphere, causing disease, death to humans, damage to other living organisms such as food crops, and the natural or built environment. Air pollution may come from anthropogenic or natural sources. Dispersion refers to what happens to the pollution during and after its introduction; understanding this may help in identifying and controlling it.
In fluid dynamics, the von Kármán constant, named for Theodore von Kármán, is a dimensionless constant involved in the logarithmic law describing the distribution of the longitudinal velocity in the wall-normal direction of a turbulent fluid flow near a boundary with a no-slip condition. The equation for such boundary layer flow profiles is:
The MEMO model is a Eulerian non-hydrostatic prognostic mesoscale model for wind-flow simulation. It was developed by the Aristotle University of Thessaloniki in collaboration with the Universität Karlsruhe. The MEMO Model together with the photochemical dispersion model MARS are the two core models of the European zooming model (EZM). This model belongs to the family of models designed for describing atmospheric transport phenomena in the local-to-regional scale, frequently referred to as mesoscale air pollution models.
Polar meteorology is the study of the atmosphere of Earth's polar regions. Surface temperature inversion is typical of polar environments and leads to the katabatic wind phenomenon. The vertical temperature structure of polar environments tends to be more complex than in mid-latitude or tropical climates.
The Penman–Monteith equation approximates net evapotranspiration (ET) from meteorological data, as a replacement for direct measurement of evapotranspiration. The equation is widely used, and was derived by the United Nations Food and Agriculture Organization for modeling reference evapotranspiration ET0.
Sverdrup Gold Medal Award – is the American Meteorological Society's award granted to researchers who make outstanding contributions to the scientific knowledge of interactions between the oceans and the atmosphere.
Monin–Obukhov (M–O) similarity theory describes the non-dimensionalized mean flow and mean temperature in the surface layer under non-neutral conditions as a function of the dimensionless height parameter, named after Russian scientists A. S. Monin and A. M. Obukhov. Similarity theory is an empirical method that describes universal relationships between non-dimensionalized variables of fluids based on the Buckingham π theorem. Similarity theory is extensively used in boundary layer meteorology since relations in turbulent processes are not always resolvable from first principles.
The convective planetary boundary layer (CPBL), also known as the daytime planetary boundary layer, is the part of the lower troposphere most directly affected by solar heating of the Earth's surface.

George Burba is an American bio-atmospheric scientist, author, and inventor.
BAITSSS is biophysical Evapotranspiration (ET) computer model that determines water use, primarily in agriculture landscape, using remote sensing-based information. It was developed and refined by Ramesh Dhungel and the water resources group at University of Idaho's Kimberly Research and Extension Center since 2010. It has been used in different areas in the United States including Southern Idaho, Northern California, northwest Kansas, Texas, and Arizona.