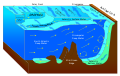
Layering of ocean water due to density differences
Ocean stratification is the natural separation of an ocean's water into horizontal layers by density. This is generally stable stratification, because warm water floats on top of cold water, and heating is mostly from the sun, which reinforces that arrangement. Stratification is reduced by wind-forced mechanical mixing, but reinforced by convection (warm water rising, cold water sinking). Stratification occurs in all ocean basins and also in other water bodies. Stratified layers are a barrier to the mixing of water, which impacts the exchange of heat, carbon, oxygen and other nutrients.[1] The surface mixed layer is the uppermost layer in the ocean and is well mixed by mechanical (wind) and thermal (convection) effects. Climate change is causing the upper ocean stratification to increase.[1][clarification needed]
Due to upwelling and downwelling, which are both wind-driven, mixing of different layers can occur through the rise of cold nutrient-rich and sinking of warm water, respectively. Generally, layers are based on water density: heavier, and hence denser, water is below the lighter water, representing a stable stratification. For example, the pycnocline is the layer in the ocean where the change in density is largest compared to that of other layers in the ocean. The thickness of the thermocline is not constant everywhere and depends on a variety of variables.[clarification needed]
Between 1960 and 2018, upper ocean stratification increased between 0.7 and 1.2% per decade due to climate change.[1] This means that the differences in density of the layers in the oceans increase, leading to larger mixing barriers and other effects.[clarification needed] In the last few decades,[when?] stratification in all ocean basins has increased due to effects of climate change on oceans. Global upper-ocean stratification has continued its increasing trend in 2022.[2] The southern oceans (south of 30°S) experienced the strongest rate of stratification since 1960, followed by the Pacific, Atlantic, and the Indian Oceans.[1] Increasing stratification is predominantly affected by changes in ocean temperature; salinity only plays a role locally.[1]
Density of water in the oceans
The density of water in the ocean, which is defined as mass per unit of volume, has a complicated dependence on temperature (), salinity () and pressure (), which in turn is a function of the density and depth of the overlying water, and is denoted as . The dependence on pressure is not significant, since seawater is almost perfectly incompressible.[3] A change in the temperature of the water impacts on the distance between water parcels directly.[clarification needed] When the temperature of the water increases, the distance between water parcels will increase and hence the density will decrease. Salinity is a measure of the mass of dissolved solids, which consist mainly of salt. Increasing the salinity will increase the density. Just like the pycnocline defines the layer with a fast change in density, similar layers can be defined for a fast change in temperature and salinity: the thermocline and the halocline. Since the density depends on both the temperature and the salinity, the pycno-, thermo-, and haloclines have similar shapes. The difference is that the density increases with depth, whereas the salinity and temperature decrease with depth.
The halo-, thermo-, and pycnocline at 10E, 30S. For this image the annual means of the year 2000 from the GODAS Data has been used.
In the ocean, a specific range of temperature and salinity occurs. Using the GODAS Data,[4] a temperature-salinity plot can show the possibilities and occurrences of the different combinations of salinity and potential temperature.
Potential temperature - salinity plot. This plot was generated using the GODAS Data of 2020.
Occurrences of combinations of potential temperature and salinity in the ocean. This plot was generated using the GODAS Data of 2020.
The density of ocean water is described by the UNESCO formula as:[5]The terms in this formula, density when the pressure is zero, , and a term involving the compressibility of water, , are both heavily dependent on the temperature and less dependent on the salinity:
The surface temperature, surface salinity and surface potential density calculated and plotted using the annual mean over the year 2000 of the GODAS Data.
with:andIn these formulas, all of the small letters, and are constants that are defined in Appendix A of a book on Internal Gravity Waves, published in 2015.[5][clarification needed]
The density depends more on the temperature than on the salinity, as can be deduced from the exact formula and can be shown in plots using the GODAS Data.[4] In the plots regarding surface temperature, salinity and density, it can be seen that locations with the coldest water, at the poles, are also the locations with the highest densities. The regions with the highest salinity, on the other hand, are not the regions with the highest density, meaning that temperature contributes mostly to the density in the oceans. A specific example is the Arabian Sea.
Quantification
Ocean stratification can be defined and quantified by the change in density with depth. The Buoyancy frequency, also called the Brunt-Väisälä frequency, can be used as direct representation of stratification in combination with observations on temperature and salinity.
The Buoyancy frequency, , represents the intrinsic frequency of internal gravity waves.[1] This means that water that is vertically displaced tends to bounce up and down with that frequency.
The Buoyancy frequency is defined as follows:Here, is the gravitational constant, is a reference density and is the potential density depending on temperature and salinity as discussed earlier. Water is considered to have a stable stratification for , leading to a real value of . The ocean is typically stable and the corresponding -values in the ocean lie between approximately in the abyssal ocean and in the upper parts of the ocean. The Buoyancy period is defined as . Corresponding to the previous values, this period typically takes values between approximately 10 and 100 minutes.[6] In some parts of the ocean unstable stratification appears, leading to convection.
If the stratification in a water column increases, implying an increase of the value , turbulent mixing and hence the eddy viscosity will decrease.[7] Furthermore, an increase of , implies an increase of , meaning that the difference in densities in this water column increase as well. Throughout the year, the oceanic stratification is not constant, since the stratification depends on density, and therefore on temperature and salinity. The interannual fluctuations in tropical Pacific Ocean stratification are dominated by El Niño, which can be linked with the strong variations in the thermocline depth in the eastern equatorial Pacific.[1]
Furthermore, tropical storms are sensitive to the conditions on the stratification and hence on its change.[8] On the other hand, mixing from tropical storms also tends to reduce stratification differences among layers.
Temperature and salinity changes due to global warming and climate change alter the ocean density and lead to changes in vertical stratification.[2] The stratified configuration of the ocean can act as a barrier to water mixing, which impacts the efficiency of vertical exchanges of heat, carbon, oxygen, and other constituents. Thus, stratification is a central element of Earth's climate system. Global upper-ocean stratification continued its increasing trend in 2022 and was among the top seven on record.[2]
In the last few decades, the stratification in all of the ocean basins has increased. Furthermore, the southern oceans (south of 30°S) experienced the strongest rate of stratification since 1960, followed by the Pacific Ocean, the Atlantic Ocean, and the Indian Ocean.[1] When the upper ocean becomes more stratified, the mixed layer of surface water with homogeneous temperature may get shallower, but projected changes to mixed-layer depth by the end of the 21st century remain contested.[9] The regions with the currently deepest mixed layers are associated with the greatest mixed layer shoaling, particularly the North Atlantic and Southern Ocean basin.[9]
By looking at the GODAS Data[4] provided by the NOAA/OAR/ESRL PSL, the Buoyancy frequencies can be found from January 1980 up to and including March 2021. Since a change in stratification is mostly visible in the upper 500 meters of the ocean, very specific data is necessary in order to see this in a plot. The resulting plots from the GODAS Data might indicate that there is also a decrease in stratification looking at the differences of the stratification between the years 1980, 2000 and 2020. It is possible to see that the change in stratification is indeed the biggest in the first 500 meters of the ocean. From approximately 1000 meters into the ocean, the stratification converges toward a stable value and the change in stratification becomes almost non-existent.
Annual and latitudinal means of for different ocean basins. This plot was generated using the GODAS Data of 1980, 2000 and 2020.
Change in annual and latitudinal means of for different ocean basins. This plot was generated using the GODAS Data of 1980, 2000 and 2020.
In many scientific articles, magazines and blogs, it is claimed that the stratification has increased in all of the ocean basins (e.g. in Ecomagazine.com[10] and NCAR & UCAR News[11]). In the figure below, the trends of the change in stratification in all of the ocean basins have been plotted.[1] This data shows that over the years the stratification has drastically increased. The changes in stratification are greatest in the Southern Ocean, followed by the Pacific Ocean. In the Pacific Ocean, the increase of stratification in the eastern equatorial has found to be greater than in the western equatorial.[1] This is likely to be linked to the weakening of the trade winds and reduced upwelling in the eastern Pacific, which can be explained by the weakening of the Walker circulation.[1]
This figure shows the global change in stratification since the year 1960 until 2018 from 0 to 2000 meters. (a) Global, (b) Pacific Ocean, (c) Atlantic Ocean, (d) Indian Ocean and (e) Southern oceans. The thin grey lines indicate the interannual variations. The small plot in (a) shows the rates of for the global case and for the basins. This is calculated by centered differences of the smooth time series (Glb: Global, Pac: Pacific, Atl: Atlantic, So: Southern, Ind: Indian). The trends have been plotted for various datasets, indicated by the different lines.
The change in temperature dominates the increasing stratification, while salinity only plays a role locally.[1] The ocean has an extraordinary ability of storing and transporting large amounts of heat, carbon and fresh water.[12] Even though approximately 70% of the Earth's surface consists of water, more than 75% of the water exchange between the Earth's surface and the atmosphere occurs over the oceans. The ocean absorbs part of the energy from sunlight as heat and is initially absorbed by the surface.[13] Eventually a part of this heat also spreads to deeper water. Greenhouse gases absorb extra energy from the sun, which is again absorbed by the oceans, leading to an increase in the amount of heat stored by the oceans. The increase of temperature of the oceans goes rather slow, compared to the atmosphere.
However, the ocean heat uptake has doubled since 1993 and oceans have absorbed over 90% of the extra heat of the Earth since 1955.[13] The temperature in the ocean, up to approximately 700 meters deep into the ocean, has been rising almost all over the globe.[12] The increased warming in the upper ocean reduces the density of the upper ≈500 m of water, while deeper water does not experience as much warming and as great a decrease in density. Thus, the stratification in the upper layers will change more than in the lower layers, and these strengthening vertical density gradients act as barriers limiting mixing between the upper layers and deep-water.
There is limited evidence that seasonal differences in stratification have grown larger over the years.[9]
Salinity
The salinity is associated with the difference between evaporation and precipitation.[1] Ocean currents are important in moving fresh and saline waters around and in keeping a balance.
Evaporation causes the water to become more saline, and hence denser. Precipitation has the opposite effect, since it decreases the density of the surface water. Hence, it can be stated that salinity plays a more local role in the increase of stratification, even though it is less present compared to the influence of the temperature. For example, salinity plays an important role in the subtropical gyre, North (-East) Pacific, North Atlantic and Arctic regions.[1][14]
In the Arctic, the decrease of salinity, and hence density, can be explained by the input of freshwater from melting glaciers and ice sheets. This process and the increase of stratification in the Arctic will continue with the current carbon emissions.[1]
A decline in dissolved oxygen, and hence in the oxygen supply to the ocean interior, is a likely effect of the increase in stratification in the upper ocean.[15] Since oxygen plays a direct and important role in the cycles of carbon, nitrogen and many other elements such as phosphorus, iron and magnesium, de-oxygenation will have large consequences. It plays a vital role for many organisms and the variety of ocean animals of all kinds.
The de-oxygenation in subsurface waters is due to the decrease in ocean mixing, which is caused by the increase of stratification in the upper ocean.[1] To illustrate, in the period between 1970 and 1990, approximately 15% of the de-oxygenation can be explained by an increase of temperature and the rest by reduced transport due to stratification.[12] In the period between 1967 and 2000 the decrease in oxygen concentration in the shallow waters, between 0 and 300 meters, was 10 times faster in the coastal ocean compared to the open ocean.[12] This has led to an increase of hypoxic zones, which can lead to a change in behaviour of the aquatic flora and fauna. The increase of stratification in the upper ocean during the second half of the 21st century can lead to a decoupling between the surface and the deeper oceans.[14] This decoupling can cause de-oxygenation in the deeper ocean as well, since the decoupling makes it less likely for the oxygen to reach the deeper oceans.
Nevertheless, the change in oxygen concentration can also be influenced by changes in circulation and winds. And even though oxygen has decreased in many areas of the oceans, it can also increase locally, due to a variety of influences on the oxygen. For example, between 1990 and 2000, the oxygen in the thermocline of the Indian Ocean and South Pacific Ocean has increased.[12]
Increasing stratification impacts life in the oceans. In some cases, the expanded surface warm layer supports life moving to greater depths,[16] while in others the differing densities of stratified waters act to separate species from one another.[17] Stratification of water limits the distribution of nutrients required for life, resulting in oligotrophic regions spreading as the surface thermocline strengthens.[18] In many already stratified waters, such as subtropical gyres or equatorial waters, winter storms degrade the stratification and introduce much needed nutrients from the deep ocean.[19] In a warming ocean, the energy required to breach the pycnocline will be greater requiring stronger mixing events to have the same effect. Similarly where cooler water upwells from deep currents, in a more strongly stratified ocean this upwelling will also require more energy and nutrients will be limited in reaching the surface in places.[20]
The microbial pump is likely to play a larger role in nutrient cycling in the stratified surface ocean with less biological activity occurring to move dissolved organic carbon to the deep ocean.[18] As water stratification increases, the amount of dissolved oxygen made available to organisms further from the surface decreases.[21] This is due partly to decreased mixing and partly to warmer water holding less oxygen.[21]
The surface mixed layer is the uppermost layer in the ocean and is well mixed by mechanical (wind) and thermal (convection) effects. Turbulence in this layer occurs through surface processes, for example wind stirring, surface heat fluxes and evaporation, The mixed layer is inherently the layer most connected to the atmosphere and affects and is affected by all weather systems, especially those with strong winds such as hurricanes.[22] Heat stored in the mixed layer in the tropical western Pacific plays a vital role in El Nino development.
The depth of the mixed layer is associated with physical, chemical and biological systems and is one of the most important quantities in the upper ocean.[22] Throughout the year, the depth of the mixed layer varies. The thickness of the layer increases in wintertime and decreases in the summer. If the mixed layer is really deep, less light can reach the phytoplankton. Phytoplankton have been shown to be important in the global carbon cycle.[23] Furthermore, since phytoplankton are at the bottom of the food chain, a decrease in phytoplankton can have consequences on a very large scale.
An exact relation between an increase in stratification and a change in the mixed layer depth has not yet been determined and remains uncertain. Although some studies suggest that a thinner mixed layer should accompany a more stratified upper ocean,[24][25][26] other work reports seasonal deepening of the mixed layer since 1970.[27] There is literature substantiating the statement that in the years from 1970 to 2018, the stratification in the basis of the mixed layer as well as the depth of the mixed layer have increased. Contradicting this result, other literature states a decrease of the depth of the mixed layer partly as a result of the increase of upper-ocean stratification.[28] It has been found that the mixed layer in the extension of the Kuroshio Current, at the west side of the North Pacific, has decreased more than 30 meters. This shoaling is caused by weakening of wind and a reduction of seasonal vertical mixing. Furthermore, there exists research stating that heating of the surface of the ocean, and hence an increase in stratification, does not necessarily mean an increase nor decrease in the mixed layer depth.[29] Using the GODAS Data[4] it can be seen that the depth of the mixed layer has increased as well as decreased over time.
Between 1970 and 2018, the summertime mixed-layer depth (MLD) deepened by 2.9 ± 0.5% per decade (or 5 to 10 m per decade, depending on the region), and the Southern Ocean experienced the greatest deepening.[27][29] However, there is limited observational evidence that the mixed layer is globally deepening, and only under strong greenhouse gas emissions scenarios do global mixed-layer depths shoal in the 21st century.[9] Although it is virtually certain that upper ocean stratification will increase through the 21st century, scientists express low confidence in how the mixed-layer depth will evolve.[9]
Annual means and change in annual means of the mixed layer depth of 1980, 2000 and 2020. This plot was generated using the GODAS Data.
Identification of regions with increase and decrease of annual means of the mixed layer depth of 1980, 2000 and 2020. This plot was generated using the GODAS Data.
1 2 3 4 5 Fox-Kemper, B.; Hewitt, H.T.; Xiao, C.; Aðalgeirsdóttir, G.; Drijfhout, S.S.; Edwards, T.L.; Golledge, N.R.; Hemer, M.; Kopp, R.E.; Krinner, G.; Mix, A. (2021). Masson-Delmotte, V.; Zhai, P.; Pirani, A.; Connors, S.L.; Péan, C.; Berger, S.; Caud, N.; Chen, Y.; Goldfarb, L. (eds.). "Ocean, Cryosphere and Sea Level Change". Climate Change 2021: The Physical Science Basis. Contribution of Working Group I to the Sixth Assessment Report of the Intergovernmental Panel on Climate Change. 2021. Cambridge University Press, Cambridge, UK and New York, NY, USA: 1211–1362. doi:10.1017/9781009157896.011. ISBN978-1-009-15789-6.
1 2 3 4 5 Rhein, M.; Rintoul, S.R.; Aoki, S.; Campos, E.; Chambers, D.; Feely, R.A.; Gulev, S.; Johnson, G.C.; Josey, S.A.; Konstianoy, A.; Mauritzen, C.; Roemmich, D.; Talley, L.D.; Wang, F. (2013). Stocker, T.F.; Qin, D.; Plattner, G.K.; Tignor, M.; Allen, S.K.; Boschung, J.; Nauels, A.; Xia, Y.; Bex, V.; Midgley, P.M. (eds.). Climate Change 2013: The Physical Science Basis. Contribution of Working Group I to the Fifth Assessment Report of the Intergovernmental Panel on Climate Change. Cambridge, United Kingdom and New York, USA: Cambridge University Press.
This page is based on this Wikipedia article Text is available under the CC BY-SA 4.0 license; additional terms may apply. Images, videos and audio are available under their respective licenses.