Cryosphere

Last updated
Overview of the cryosphere and its larger components Cryosphere Fuller Projection.png
Overview of the cryosphere and its larger components

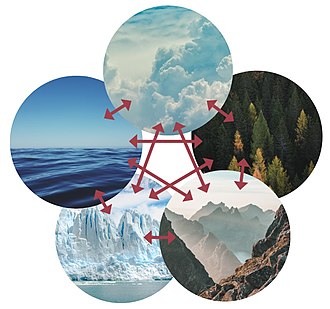
The cryosphere is an umbrella term for those portions of Earth's surface where water is in solid form. This includes sea ice, ice on lakes or rivers, snow, glaciers, ice caps, ice sheets, and frozen ground (which includes permafrost). Thus, there is a overlap with the hydrosphere. The cryosphere is an integral part of the global climate system. It also has important feedbacks on the climate system. These feedbacks come from the cryosphere's influence on surface energy and moisture fluxes, clouds, the water cycle, atmospheric and oceanic circulation.

Contents

Through these feedback processes, the cryosphere plays a significant role in the global climate and in climate model response to global changes. Approximately 10% of the Earth's surface is covered by ice, but this is rapidly decreasing. [2] Current reductions in the cryosphere (caused by climate change) are measurable in ice sheet melt, glaciers decline, sea ice decline, permafrost thaw and snow cover decrease.

Definition and terminology

The cryosphere describes those portions of Earth's surface where water is in solid form. Frozen water is found on the Earth's surface primarily as snow cover, freshwater ice in lakes and rivers, sea ice, glaciers, ice sheets, and frozen ground and permafrost (permanently frozen ground).

The cryosphere is one of five components of the climate system. The others are the atmosphere, the hydrosphere, the lithosphere and the biosphere. [3] :1451

The term cryosphere comes from the Greek word kryos, meaning cold, frost or ice and the Greek word sphaira, meaning globe or ball. [4]

Cryospheric sciences is an umbrella term for the study of the cryosphere. As an interdisciplinary Earth science, many disciplines contribute to it, most notably geology, hydrology, and meteorology and climatology; in this sense, it is comparable to glaciology.

The term deglaciation describes the retreat of cryospheric features.

Properties and interactions

The cryosphere (bottom left) is one of five components of the climate system. The others are the atmosphere, the hydrosphere, the lithosphere and the biosphere. Climate-system.jpg
The cryosphere (bottom left) is one of five components of the climate system. The others are the atmosphere, the hydrosphere, the lithosphere and the biosphere.

There are several fundamental physical properties of snow and ice that modulate energy exchanges between the surface and the atmosphere. The most important properties are the surface reflectance (albedo), the ability to transfer heat (thermal diffusivity), and the ability to change state (latent heat). These physical properties, together with surface roughness, emissivity, and dielectric characteristics, have important implications for observing snow and ice from space. For example, surface roughness is often the dominant factor determining the strength of radar backscatter. [5] Physical properties such as crystal structure, density, length, and liquid water content are important factors affecting the transfers of heat and water and the scattering of microwave energy.

Residence time and extent

The residence time of water in each of the cryospheric sub-systems varies widely. Snow cover and freshwater ice are essentially seasonal, and most sea ice, except for ice in the central Arctic, lasts only a few years if it is not seasonal. A given water particle in glaciers, ice sheets, or ground ice, however, may remain frozen for 10–100,000 years or longer, and deep ice in parts of East Antarctica may have an age approaching 1 million years.[ citation needed ]

Most of the world's ice volume is in Antarctica, principally in the East Antarctic Ice Sheet. In terms of areal extent, however, Northern Hemisphere winter snow and ice extent comprise the largest area, amounting to an average 23% of hemispheric surface area in January. The large areal extent and the important climatic roles of snow and ice is related to their unique physical properties. This also indicates that the ability to observe and model snow and ice-cover extent, thickness, and physical properties (radiative and thermal properties) is of particular significance for climate research.[ citation needed ]

Surface reflectance

The surface reflectance of incoming solar radiation is important for the surface energy balance (SEB). It is the ratio of reflected to incident solar radiation, commonly referred to as albedo. Climatologists are primarily interested in albedo integrated over the shortwave portion of the electromagnetic spectrum (~300 to 3500 nm), which coincides with the main solar energy input. Typically, albedo values for non-melting snow-covered surfaces are high (~80–90%) except in the case of forests.[ citation needed ]

The higher albedos for snow and ice cause rapid shifts in surface reflectivity in autumn and spring in high latitudes, but the overall climatic significance of this increase is spatially and temporally modulated by cloud cover. (Planetary albedo is determined principally by cloud cover, and by the small amount of total solar radiation received in high latitudes during winter months.) Summer and autumn are times of high-average cloudiness over the Arctic Ocean so the albedo feedback associated with the large seasonal changes in sea-ice extent is greatly reduced. It was found that snow cover exhibited the greatest influence on Earth's radiative balance in the spring (April to May) period when incoming solar radiation was greatest over snow-covered areas. [6]

Thermal properties of cryospheric elements

The thermal properties of cryospheric elements also have important climatic consequences.[ citation needed ] Snow and ice have much lower thermal diffusivities than air. Thermal diffusivity is a measure of the speed at which temperature waves can penetrate a substance. Snow and ice are many orders of magnitude less efficient at diffusing heat than air. Snow cover insulates the ground surface, and sea ice insulates the underlying ocean, decoupling the surface-atmosphere interface with respect to both heat and moisture fluxes. The flux of moisture from a water surface is eliminated by even a thin skin of ice, whereas the flux of heat through thin ice continues to be substantial until it attains a thickness in excess of 30 to 40 cm. However, even a small amount of snow on top of the ice will dramatically reduce the heat flux and slow down the rate of ice growth. The insulating effect of snow also has major implications for the hydrological cycle. In non-permafrost regions, the insulating effect of snow is such that only near-surface ground freezes and deep-water drainage is uninterrupted. [7]

While snow and ice act to insulate the surface from large energy losses in winter, they also act to retard warming in the spring and summer because of the large amount of energy required to melt ice (the latent heat of fusion, 3.34 x 10⁵ J/kg at 0 °C). However, the strong static stability of the atmosphere over areas of extensive snow or ice tends to confine the immediate cooling effect to a relatively shallow layer, so that associated atmospheric anomalies are usually short-lived and local to regional in scale. [8] In some areas of the world such as Eurasia, however, the cooling associated with a heavy snowpack and moist spring soils is known to play a role in modulating the summer monsoon circulation. [9]

Climate change feedback mechanisms

There are numerous cryosphere-climate feedbacks in the global climate system. These operate over a wide range of spatial and temporal scales from local seasonal cooling of air temperatures to hemispheric-scale variations in ice sheets over time scales of thousands of years. The feedback mechanisms involved are often complex and incompletely understood. For example, Curry et al. (1995) showed that the so-called "simple" sea ice-albedo feedback involved complex interactions with lead fraction, melt ponds, ice thickness, snow cover, and sea-ice extent.[ citation needed ]

The role of snow cover in modulating the monsoon is just one example of a short-term cryosphere-climate feedback involving the land surface and the atmosphere. [9] [ citation needed ]

Components

Glaciers and ice sheets

Representation of glaciers on a topographic map 1249 Finsteraarhorn.jpg
Representation of glaciers on a topographic map
The Taschachferner glacier in the Otztal Alps in Austria. The mountain to the left is the Wildspitze (3.768 m), second highest in Austria. To the right is an area with open crevasses where the glacier flows over a kind of large cliff. Wildspitze seen from Hinterer Brunnkogel, with visible ascent track of ski mountaineer.jpg
The Taschachferner glacier in the Ötztal Alps in Austria. The mountain to the left is the Wildspitze (3.768 m), second highest in Austria. To the right is an area with open crevasses where the glacier flows over a kind of large cliff.

Ice sheets and glaciers are flowing ice masses that rest on solid land. They are controlled by snow accumulation, surface and basal melt, calving into surrounding oceans or lakes and internal dynamics. The latter results from gravity-driven creep flow ("glacial flow") within the ice body and sliding on the underlying land, which leads to thinning and horizontal spreading. [11] Any imbalance of this dynamic equilibrium between mass gain, loss and transport due to flow results in either growing or shrinking ice bodies.

Aerial view of the ice sheet on Greenland's east coast Greenland-ice sheet hg.jpg
Aerial view of the ice sheet on Greenland's east coast

Relationships between global climate and changes in ice extent are complex. The mass balance of land-based glaciers and ice sheets is determined by the accumulation of snow, mostly in winter, and warm-season ablation due primarily to net radiation and turbulent heat fluxes to melting ice and snow from warm-air advection [12] [13] Where ice masses terminate in the ocean, iceberg calving is the major contributor to mass loss. In this situation, the ice margin may extend out into deep water as a floating ice shelf, such as that in the Ross Sea.

A glacier ( US: /ˈɡlʃər/ ; UK: /ˈɡlæsiər,ˈɡlsiər/ ) is a persistent body of dense ice that is constantly moving downhill under its own weight. A glacier forms where the accumulation of snow exceeds its ablation over many years, often centuries. It acquires distinguishing features, such as crevasses and seracs, as it slowly flows and deforms under stresses induced by its weight. As it moves, it abrades rock and debris from its substrate to create landforms such as cirques, moraines, or fjords. Although a glacier may flow into a body of water, it forms only on land and is distinct from the much thinner sea ice and lake ice that form on the surface of bodies of water.

On Earth, 99% of glacial ice is contained within vast ice sheets (also known as "continental glaciers") in the polar regions, but glaciers may be found in mountain ranges on every continent other than the Australian mainland, including Oceania's high-latitude oceanic island countries such as New Zealand. Between latitudes 35°N and 35°S, glaciers occur only in the Himalayas, Andes, and a few high mountains in East Africa, Mexico, New Guinea and on Zard-Kuh in Iran. [14] With more than 7,000 known glaciers, Pakistan has more glacial ice than any other country outside the polar regions. [15] [16] Glaciers cover about 10% of Earth's land surface. Continental glaciers cover nearly 13 million km2 (5 million sq mi) or about 98% of Antarctica's 13.2 million km2 (5.1 million sq mi), with an average thickness of ice 2,100 m (7,000 ft). Greenland and Patagonia also have huge expanses of continental glaciers. [17] The volume of glaciers, not including the ice sheets of Antarctica and Greenland, has been estimated at 170,000 km3. [18]

Glacial ice is the largest reservoir of fresh water on Earth, holding with ice sheets about 69 percent of the world's freshwater. [19] [20] Many glaciers from temperate, alpine and seasonal polar climates store water as ice during the colder seasons and release it later in the form of meltwater as warmer summer temperatures cause the glacier to melt, creating a water source that is especially important for plants, animals and human uses when other sources may be scant. However, within high-altitude and Antarctic environments, the seasonal temperature difference is often not sufficient to release meltwater.

In glaciology, an ice sheet, also known as a continental glacier, [21] is a mass of glacial ice that covers surrounding terrain and is greater than 50,000 km2 (19,000 sq mi). [22] The only current ice sheets are the Antarctic ice sheet and the Greenland ice sheet. Ice sheets are bigger than ice shelves or alpine glaciers. Masses of ice covering less than 50,000 km2 are termed an ice cap. An ice cap will typically feed a series of glaciers around its periphery.

Although the surface is cold, the base of an ice sheet is generally warmer due to geothermal heat. In places, melting occurs and the melt-water lubricates the ice sheet so that it flows more rapidly. This process produces fast-flowing channels in the ice sheet — these are ice streams.

Even stable ice sheets are continually in motion as the ice gradually flows outward from the central plateau, which is the tallest point of the ice sheet, and towards the margins. The ice sheet slope is low around the plateau but increases steeply at the margins. [23]

Increasing global air temperatures due to climate change take around 10,000 years to directly propagate through the ice before they influence bed temperatures, but may have an effect through increased surface melting, producing more supraglacial lakes. These lakes may feed warm water to glacial bases and facilitate glacial motion. [24]

In previous geologic time spans (glacial periods) there were other ice sheets. During the Last Glacial Period at Last Glacial Maximum, the Laurentide Ice Sheet covered much of North America. In the same period, the Weichselian ice sheet covered Northern Europe and the Patagonian Ice Sheet covered southern South America.

Sea ice

Broken pieces of Arctic sea ice with a snow cover Arctic ice.jpg
Broken pieces of Arctic sea ice with a snow cover
Satellite image of sea ice forming near St. Matthew Island in the Bering Sea Seaice.jpg
Satellite image of sea ice forming near St. Matthew Island in the Bering Sea

Sea ice covers much of the polar oceans and forms by freezing of sea water. Satellite data since the early 1970s reveal considerable seasonal, regional, and interannual variability in the sea ice covers of both hemispheres. Seasonally, sea-ice extent in the Southern Hemisphere varies by a factor of 5, from a minimum of 3–4 million km2 in February to a maximum of 17–20 million km2 in September. [25] [26] The seasonal variation is much less in the Northern Hemisphere where the confined nature and high latitudes of the Arctic Ocean result in a much larger perennial ice cover, and the surrounding land limits the equatorward extent of wintertime ice. Thus, the seasonal variability in Northern Hemisphere ice extent varies by only a factor of 2, from a minimum of 7–9 million km2 in September to a maximum of 14–16 million km2 in March. [26] [27]

The ice cover exhibits much greater regional-scale interannual variability than it does hemispherical. For instance, in the region of the Sea of Okhotsk and Japan, maximum ice extent decreased from 1.3 million km2 in 1983 to 0.85 million km2 in 1984, a decrease of 35%, before rebounding the following year to 1.2 million km2. [26] The regional fluctuations in both hemispheres are such that for any several-year period of the satellite record some regions exhibit decreasing ice coverage while others exhibit increasing ice cover. [28]

Frozen ground and permafrost

Extent and types of permafrost in the Northern Hemisphere Circum-Arctic Map of Permafrost and Ground Ice Conditions.png
Extent and types of permafrost in the Northern Hemisphere

Permafrost (from perma-  'permanent',and frost ) is soil or underwater sediment which continuously remains below 0 °C (32 °F) for two years or more: the oldest permafrost had been continuously frozen for around 700,000 years. [29] Whilst the shallowest permafrost has a vertical extent of below a meter (3 ft), the deepest is greater than 1,500 m (4,900 ft). [30] Similarly, the area of individual permafrost zones may be limited to narrow mountain summits or extend across vast Arctic regions. [31] The ground beneath glaciers and ice sheets is not usually defined as permafrost, so on land, permafrost is generally located beneath a so-called active layer of soil which freezes and thaws depending on the season. [32]

Around 15% of the Northern Hemisphere or 11% of the global surface is underlain by permafrost, [33] covering a total area of around 18 million km2 (6.9 million sq mi). [34] This includes large areas of Alaska, Canada, Greenland, and Siberia. It is also located in high mountain regions, with the Tibetan Plateau being a prominent example. Only a minority of permafrost exists in the Southern Hemisphere, where it is consigned to mountain slopes like in the Andes of Patagonia, the Southern Alps of New Zealand, or the highest mountains of Antarctica. [31] [29]

Permafrost contains large amounts of dead biomass that have accumulated throughout millennia without having had the chance to fully decompose and release their carbon, making tundra soil a carbon sink. [31] As global warming heats the ecosystem, frozen soil thaws and becomes warm enough for decomposition to start anew, accelerating the permafrost carbon cycle. Depending on conditions at the time of thaw, decomposition can release either carbon dioxide or methane, and these greenhouse gas emissions act as a climate change feedback. [35] [36] [37] The emissions from thawing permafrost will have a sufficient impact on the climate to impact global carbon budgets. It is difficult to accurately predict how much greenhouse gases the permafrost releases because of the different thaw processes are still uncertain. There is widespread agreement that the emissions will be smaller than human-caused emissions and not large enough to result in runaway warming. [38] Instead, the annual permafrost emissions are likely comparable with global emissions from deforestation, or to annual emissions of large countries such as Russia, the United States or China. [39]

Snow cover

Snow-covered trees in Kuusamo, Finland Snow-covered fir trees.jpg
Snow-covered trees in Kuusamo, Finland
Snow drifts forming around downwind obstructions Long Mynd snowdrift.jpeg
Snow drifts forming around downwind obstructions

Most of the Earth's snow-covered area is located in the Northern Hemisphere, and varies seasonally from 46.5 million km2 in January to 3.8 million km2 in August. [40]

Snow cover is an extremely important storage component in the water balance, especially seasonal snowpacks in mountainous areas of the world. Though limited in extent, seasonal snowpacks in the Earth's mountain ranges account for the major source of the runoff for stream flow and groundwater recharge over wide areas of the midlatitudes. For example, over 85% of the annual runoff from the Colorado River basin originates as snowmelt. Snowmelt runoff from the Earth's mountains fills the rivers and recharges the aquifers that over a billion people depend on for their water resources.[ citation needed ]

Furthermore, over 40% of the world's protected areas are in mountains, attesting to their value both as unique ecosystems needing protection and as recreation areas for humans.[ citation needed ]

Ice on lakes and rivers

Ice forms on rivers and lakes in response to seasonal cooling. The sizes of the ice bodies involved are too small to exert anything other than localized climatic effects. However, the freeze-up/break-up processes respond to large-scale and local weather factors, such that considerable interannual variability exists in the dates of appearance and disappearance of the ice. Long series of lake-ice observations can serve as a proxy climate record, and the monitoring of freeze-up and break-up trends may provide a convenient integrated and seasonally-specific index of climatic perturbations. Information on river-ice conditions is less useful as a climatic proxy because ice formation is strongly dependent on river-flow regime, which is affected by precipitation, snow melt, and watershed runoff as well as being subject to human interference that directly modifies channel flow, or that indirectly affects the runoff via land-use practices.[ citation needed ]

Lake freeze-up depends on the heat storage in the lake and therefore on its depth, the rate and temperature of any inflow, and water-air energy fluxes. Information on lake depth is often unavailable, although some indication of the depth of shallow lakes in the Arctic can be obtained from airborne radar imagery during late winter (Sellman et al. 1975) and spaceborne optical imagery during summer (Duguay and Lafleur 1997). The timing of breakup is modified by snow depth on the ice as well as by ice thickness and freshwater inflow.[ citation needed ]

Changes caused by climate change

The cryosphere, the area of the Earth covered by snow or ice, is extremely sensitive to changes in global climate. [41] There has been an extensive loss of snow on land since 1981. Some of the largest declines have been observed in the spring. [42] During the 21st century, snow cover is projected to continue its retreat in almost all regions. [43] :39–69

Ice sheet melt

2023 projections of how much the Greenland ice sheet may shrink from its present extent by the year 2300 under the worst possible climate change scenario (upper half) and of how much faster its remaining ice will be flowing in that case (lower half) Beckmann 2023 Greenland 2300 RCP85 extent.png
2023 projections of how much the Greenland ice sheet may shrink from its present extent by the year 2300 under the worst possible climate change scenario (upper half) and of how much faster its remaining ice will be flowing in that case (lower half)

The Greenland ice sheet is an ice sheet which forms the second largest body of ice in the world. It is an average of 1.67 km (1.0 mi) thick, and over 3 km (1.9 mi) thick at its maximum. [45] It is almost 2,900 kilometres (1,800 mi) long in a north–south direction, with a maximum width of 1,100 kilometres (680 mi) at a latitude of 77°N, near its northern edge. [46] The ice sheet covers 1,710,000 square kilometres (660,000 sq mi), around 80% of the surface of Greenland, or about 12% of the area of the Antarctic ice sheet. [45] The term 'Greenland ice sheet' is often shortened to GIS or GrIS in scientific literature. [47] [48] [49] [50]

If all 2,900,000 cubic kilometres (696,000 cu mi) of the ice sheet were to melt, it would increase global sea levels by ~7.4 m (24 ft). [45] Global warming between 1.7 °C (3.1 °F) and 2.3 °C (4.1 °F) would likely make this melting inevitable. [50] However, 1.5 °C (2.7 °F) would still cause ice loss equivalent to 1.4 m (4+12 ft) of sea level rise, [51] and more ice will be lost if the temperatures exceed that level before declining. [50] If global temperatures continue to rise, the ice sheet will likely disappear within 10,000 years. [52] [53] At very high warming, its future lifetime goes down to around 1,000 years. [54]
The West Antarctic ice sheet is likely to melt completely, [55] [56] [57] unless temperatures are reduced by 2 °C (3.6 °F) below the levels of the year 2020. [58] The loss of this ice sheet would take between 2,000 and 13,000 years, [59] [60] although several centuries of high emissions could shorten this timeframe to 500 years. [61] A sea-level rise of 3.3 m (10 ft 10 in) would occur if the ice sheet collapses leaving ice caps on the mountains and 4.3 m (14 ft 1 in) if those ice caps also melt. [62] Isostatic rebound may contribute an additional 1 m (3 ft 3 in) to global sea levels over another 1,000 years. [61] In contrast, the East Antarctic ice sheet is far more stable and may only cause a sea-level rise of 0.5 m (1 ft 8 in) - 0.9 m (2 ft 11 in) from the current level of warming, a small fraction of the 53.3 m (175 ft) contained in the full ice sheet. [63] With a global warming of around 3 °C (5.4 °F), vulnerable areas like the Wilkes Basin and Aurora Basin may collapse over a period of around 2,000 years, [59] [60] potentially adding up to 6.4 m (21 ft 0 in) to sea levels. [61] The complete melting and disappearance of the East Antarctic ice sheet would require at least 10,000 years, and it would only occur if global warming reaches 5 °C (9.0 °F) to 10 °C (18 °F). [59] [60]

Decline of glaciers

Example of a mountain glacier retreat: White Chuck Glacier, Washington
Whitechuck glacier 1973.jpg
White Chuck Glacier in the United States in 1973
Whitechuck glacier 2006.jpg
Same vantage point in 2006, at the same time of the year. The glacier retreated 1.9 kilometres (1.2 mi) in 33 years.

The retreat of glaciers since 1850 is well documented and is one of the effects of climate change. The retreat of mountain glaciers provide evidence for the rise in global temperatures since the late 19th century. Examples include mountain glaciers in western North America, Asia, the Alps in central Europe and tropical and subtropical regions of South America and Africa. Since glacial mass is affected by long-term climatic changes, e.g., precipitation, mean temperature, and cloud cover, glacial mass changes are one of the most sensitive indicators of climate change. Retreat of glaciers is also a major reason for sea level rise. Excluding peripheral glaciers of ice sheets, the total cumulated global glacial losses over the 26-year period from 1993 to 2018 were likely 5500 gigatons, or 210 gigatons per yr. [64] :1275

On Earth, 99% of glacial ice is contained within vast ice sheets (also known as "continental glaciers") in the polar regions. Glaciers also exist in mountain ranges on every continent other than the Australian mainland, including Oceania's high-latitude oceanic island countries such as New Zealand. Glacial bodies larger than 50,000 km2 (19,000 sq mi) are called ice sheets. [65] They are several kilometers deep and obscure the underlying topography.

Sea ice decline

Reporting the reduction in Antarctic sea ice extent in mid 2023, researchers concluded that a "regime shift" may be taking place "in which previously important relationships no longer dominate sea ice variability". 1978- Antarctic sea ice extent - Purich and Doddridge.png
Reporting the reduction in Antarctic sea ice extent in mid 2023, researchers concluded that a "regime shift" may be taking place "in which previously important relationships no longer dominate sea ice variability".

Sea ice reflects 50% to 70% of the incoming solar radiation back into space. Only 6% of incoming solar energy is reflected by the ocean. [67] As the climate warms, the area covered by snow or sea ice decreases. After sea ice melts, more energy is absorbed by the ocean, so it warms up. This ice-albedo feedback is a self-reinforcing feedback of climate change. [68] Large-scale measurements of sea ice have only been possible since satellites came into use. [69]

Sea ice in the Arctic has declined in recent decades in area and volume due to climate change. It has been melting more in summer than it refreezes in winter. The decline of sea ice in the Arctic has been accelerating during the early twenty-first century. It has a rate of decline of 4.7% per decade. It has declined over 50% since the first satellite records. [70] [71] [72] Ice-free summers are expected to be rare at 1.5 °C (2.7 °F) degrees of warming. They are set to occur at least once every decade with a warming level of 2 °C (3.6 °F). [73] :8 The Arctic will likely become ice-free at the end of some summers before 2050. [74] :9

Sea ice extent in Antarctica varies a lot year by year. This makes it difficult to determine a trend, and record highs and record lows have been observed between 2013 and 2023. The general trend since 1979, the start of the satellite measurements, has been roughly flat. Between 2015 and 2023, there has been a decline in sea ice, but due to the high variability, this does not correspond to a significant trend. [75]

Permafrost thaw

Recently thawed Arctic permafrost and coastal erosion on the Beaufort Sea, Arctic Ocean, near Point Lonely, Alaska in 2013. Beaufort Permafrost2.JPG
Recently thawed Arctic permafrost and coastal erosion on the Beaufort Sea, Arctic Ocean, near Point Lonely, Alaska in 2013.

Globally, permafrost warmed by about 0.3 °C (0.54 °F) between 2007 and 2016, with stronger warming observed in the continuous permafrost zone relative to the discontinuous zone. Observed warming was up to 3 °C (5.4 °F) in parts of Northern Alaska (early 1980s to mid-2000s) and up to 2 °C (3.6 °F) in parts of the Russian European North (1970–2020). This warming inevitably causes permafrost to thaw: active layer thickness has increased in the European and Russian Arctic across the 21st century and at high elevation areas in Europe and Asia since the 1990s. [76] :1237 Between 2000 and 2018, the average active layer thickness had increased from ~127 centimetres (4.17 ft) to ~145 centimetres (4.76 ft), at an average annual rate of ~0.65 centimetres (0.26 in). [77] In Yukon, the zone of continuous permafrost might have moved 100 kilometres (62 mi) poleward since 1899, but accurate records only go back 30 years. The extent of subsea permafrost is decreasing as well; as of 2019, ~97% of permafrost under Arctic ice shelves is becoming warmer and thinner. [78] [38] :1281 Based on high agreement across model projections, fundamental process understanding, and paleoclimate evidence, it is virtually certain that permafrost extent and volume will continue to shrink as the global climate warms, with the extent of the losses determined by the magnitude of warming. [76] :1283

Permafrost thaw is associated with a wide range of issues, and International Permafrost Association (IPA) exists to help address them. It convenes International Permafrost Conferences and maintains Global Terrestrial Network for Permafrost, which undertakes special projects such as preparing databases, maps, bibliographies, and glossaries, and coordinates international field programmes and networks. [79]

Snow cover decrease

Shrinkage of snow cover duration in the Alps, starting ca. end of the 19th century, highlighting climate change adaptation needs Duration of the yearly snow cover ring-width reconstruction together with modelled record for the Alps.webp
Shrinkage of snow cover duration in the Alps, starting ca. end of the 19th century, highlighting climate change adaptation needs

Studies in 2021 found that Northern Hemisphere snow cover has been decreasing since 1978, along with snow depth. [81] Paleoclimate observations show that such changes are unprecedented over the last millennia in Western North America. [82] [83] [81]

North American winter snow cover increased during the 20th century, [84] [85] largely in response to an increase in precipitation. [86]

Because of its close relationship with hemispheric air temperature, snow cover is an important indicator of climate change.[ citation needed ]

Global warming is expected to result in major changes to the partitioning of snow and rainfall, and to the timing of snowmelt, which will have important implications for water use and management.[ citation needed ] These changes also involve potentially important decadal and longer time-scale feedbacks to the climate system through temporal and spatial changes in soil moisture and runoff to the oceans.(Walsh 1995). Freshwater fluxes from the snow cover into the marine environment may be important, as the total flux is probably of the same magnitude as desalinated ridging and rubble areas of sea ice. [87] In addition, there is an associated pulse of precipitated pollutants which accumulate over the Arctic winter in snowfall and are released into the ocean upon ablation of the sea ice.[ citation needed ]

See also

Related Research Articles

<span class="mw-page-title-main">Antarctic</span> Polar region around Earths South Pole

The Antarctic is a polar region around Earth's South Pole, opposite the Arctic region around the North Pole.

<span class="mw-page-title-main">Glacier</span> Persistent body of ice that is moving downhill under its own weight

A glacier is a persistent body of dense ice that is constantly moving downhill under its own weight. A glacier forms where the accumulation of snow exceeds its ablation over many years, often centuries. It acquires distinguishing features, such as crevasses and seracs, as it slowly flows and deforms under stresses induced by its weight. As it moves, it abrades rock and debris from its substrate to create landforms such as cirques, moraines, or fjords. Although a glacier may flow into a body of water, it forms only on land and is distinct from the much thinner sea ice and lake ice that form on the surface of bodies of water.

<span class="mw-page-title-main">Permafrost</span> Soil frozen for a duration of at least two years

Permafrost is soil or underwater sediment which continuously remains below 0 °C (32 °F) for two years or more: the oldest permafrost had been continuously frozen for around 700,000 years. Whilst the shallowest permafrost has a vertical extent of below a meter (3 ft), the deepest is greater than 1,500 m (4,900 ft). Similarly, the area of individual permafrost zones may be limited to narrow mountain summits or extend across vast Arctic regions. The ground beneath glaciers and ice sheets is not usually defined as permafrost, so on land, permafrost is generally located beneath a so-called active layer of soil which freezes and thaws depending on the season.

<span class="mw-page-title-main">Ice shelf</span> Antarctic ice shelf in the Amundsen Sea

An ice shelf is a large platform of glacial ice floating on the ocean, fed by one or multiple tributary glaciers. Ice shelves form along coastlines where the ice thickness is insufficient to displace the more dense surrounding ocean water. The boundary between the ice shelf (floating) and grounded ice is referred to as the grounding line; the boundary between the ice shelf and the open ocean is the ice front or calving front.

<span class="mw-page-title-main">Ice sheet</span> Large mass of glacial ice

In glaciology, an ice sheet, also known as a continental glacier, is a mass of glacial ice that covers surrounding terrain and is greater than 50,000 km2 (19,000 sq mi). The only current ice sheets are the Antarctic ice sheet and the Greenland ice sheet. Ice sheets are bigger than ice shelves or alpine glaciers. Masses of ice covering less than 50,000 km2 are termed an ice cap. An ice cap will typically feed a series of glaciers around its periphery.

<span class="mw-page-title-main">Last Glacial Period</span> Period of major glaciations of the Northern Hemisphere (115,000–12,000 years ago)

The Last Glacial Period (LGP), also known as the Last glacial cycle, occurred from the end of the Last Interglacial to the beginning of the Holocene, c. 115,000 – c. 11,700 years ago, and thus corresponds to most of the timespan of the Late Pleistocene.

<span class="mw-page-title-main">Ice cap</span> Ice mass that covers less than 50,000 km² of land area

In glaciology, an ice cap is a mass of ice that covers less than 50,000 km2 (19,000 sq mi) of land area. Larger ice masses covering more than 50,000 km2 (19,000 sq mi) are termed ice sheets.

<span class="mw-page-title-main">Antarctic ice sheet</span> Earths southern polar ice cap

The Antarctic ice sheet is a continental glacier covering 98% of the Antarctic continent, with an area of 14 million square kilometres and an average thickness of over 2 kilometres (1.2 mi). It is the largest of Earth's two current ice sheets, containing 26.5 million cubic kilometres of ice, which is equivalent to 61% of all fresh water on Earth. Its surface is nearly continuous, and the only ice-free areas on the continent are the dry valleys, nunataks of the Antarctic mountain ranges, and sparse coastal bedrock. However, it is often subdivided into East Antarctic ice sheet (EAIS), West Antarctic ice sheet (WAIS), and Antarctic Peninsula (AP), due to the large differences in topography, ice flow, and glacier mass balance between the three regions.

<span class="mw-page-title-main">Greenland ice sheet</span> Vast body of ice in Greenland, Northern Hemisphere

The Greenland ice sheet is an ice sheet which forms the second largest body of ice in the world. It is an average of 1.67 km (1.0 mi) thick, and over 3 km (1.9 mi) thick at its maximum. It is almost 2,900 kilometres (1,800 mi) long in a north–south direction, with a maximum width of 1,100 kilometres (680 mi) at a latitude of 77°N, near its northern edge. The ice sheet covers 1,710,000 square kilometres (660,000 sq mi), around 80% of the surface of Greenland, or about 12% of the area of the Antarctic ice sheet. The term 'Greenland ice sheet' is often shortened to GIS or GrIS in scientific literature.

Ice algae are any of the various types of algal communities found in annual and multi-year sea, and terrestrial lake ice or glacier ice.

<span class="mw-page-title-main">Retreat of glaciers since 1850</span> Shortening of glaciers by melting

The retreat of glaciers since 1850 is well documented and is one of the effects of climate change. The retreat of mountain glaciers provide evidence for the rise in global temperatures since the late 19th century. Examples include mountain glaciers in western North America, Asia, the Alps in central Europe and tropical and subtropical regions of South America and Africa. Since glacial mass is affected by long-term climatic changes, e.g., precipitation, mean temperature, and cloud cover, glacial mass changes are one of the most sensitive indicators of climate change. Retreat of glaciers is also a major reason for sea level rise. Excluding peripheral glaciers of ice sheets, the total cumulated global glacial losses over the 26-year period from 1993 to 2018 were likely 5500 gigatons, or 210 gigatons per yr.

<span class="mw-page-title-main">Climate change in the Arctic</span> Impacts of climate change on the Arctic

Due to climate change in the Arctic, this polar region is expected to become "profoundly different" by 2050. The speed of change is "among the highest in the world", with the rate of warming being 3-4 times faster than the global average. This warming has already resulted in the profound Arctic sea ice decline, the accelerating melting of the Greenland ice sheet and the thawing of the permafrost landscape. These ongoing transformations are expected to be irreversible for centuries or even millennia.

<span class="mw-page-title-main">East Antarctic Ice Sheet</span> Segment of the continental ice sheet that covers East Antarctica

The East Antarctic Ice Sheet (EAIS) lies between 45° west and 168° east longitudinally. It was first formed around 34 million years ago, and it is the largest ice sheet on the entire planet, with far greater volume than the Greenland ice sheet or the West Antarctic Ice Sheet (WAIS), from which it is separated by the Transantarctic Mountains. The ice sheet is around 2.2 km (1.4 mi) thick on average and is 4,897 m (16,066 ft) at its thickest point. It is also home to the geographic South Pole, South Magnetic Pole and the Amundsen–Scott South Pole Station.

<span class="mw-page-title-main">Tipping points in the climate system</span> Large and possibly irreversible changes in the climate system

In climate science, a tipping point is a critical threshold that, when crossed, leads to large, accelerating and often irreversible changes in the climate system. If tipping points are crossed, they are likely to have severe impacts on human society and may accelerate global warming. Tipping behavior is found across the climate system, for example in ice sheets, mountain glaciers, circulation patterns in the ocean, in ecosystems, and the atmosphere. Examples of tipping points include thawing permafrost, which will release methane, a powerful greenhouse gas, or melting ice sheets and glaciers reducing Earth's albedo, which would warm the planet faster. Thawing permafrost is a threat multiplier because it holds roughly twice as much carbon as the amount currently circulating in the atmosphere.

<span class="mw-page-title-main">Ice–albedo feedback</span> Positive feedback climate process

Ice–albedo feedback is a climate change feedback, where a change in the area of ice caps, glaciers, and sea ice alters the albedo and surface temperature of a planet. Because ice is very reflective, it reflects far more solar energy back to space than open water or any other land cover. It occurs on Earth, and can also occur on exoplanets.

<span class="mw-page-title-main">Climate change feedbacks</span> Feedback related to climate change

Climate change feedbacks are natural processes which impact how much global temperatures will increase for a given amount of greenhouse gas emissions. Positive feedbacks amplify global warming while negative feedbacks diminish it. Feedbacks influence both the amount of greenhouse gases in the atmosphere and the amount of temperature change that happens in response. While emissions are the forcing that causes climate change, feedbacks combine to control climate sensitivity to that forcing.

Deglaciation is the transition from full glacial conditions during ice ages, to warm interglacials, characterized by global warming and sea level rise due to change in continental ice volume. Thus, it refers to the retreat of a glacier, an ice sheet or frozen surface layer, and the resulting exposure of the Earth's surface. The decline of the cryosphere due to ablation can occur on any scale from global to localized to a particular glacier. After the Last Glacial Maximum, the last deglaciation begun, which lasted until the early Holocene. Around much of Earth, deglaciation during the last 100 years has been accelerating as a result of climate change, partly brought on by anthropogenic changes to greenhouse gases.

<span class="mw-page-title-main">Climate change in Antarctica</span> Impacts of climate change on Antarctica

Climate change caused by greenhouse gas emissions from human activities occurs everywhere on Earth, and while Antarctica is less vulnerable to it than any other continent, climate change in Antarctica has already been observed. There has been an average temperature increase of >0.05 °C/decade since 1957 across the continent, although it had been uneven. While West Antarctica warmed by over 0.1 °C/decade from the 1950s to the 2000s and the exposed Antarctic Peninsula has warmed by 3 °C (5.4 °F) since the mid-20th century, the colder and more stable East Antarctica had been experiencing cooling until the 2000s. Around Antarctica, the Southern Ocean has absorbed more heat than any other ocean, with particularly strong warming at depths below 2,000 m (6,600 ft) and around the West Antarctic, which has warmed by 1 °C (1.8 °F) since 1955.

<span class="mw-page-title-main">Special Report on the Ocean and Cryosphere in a Changing Climate</span> IPCC 2019 report

The United Nations' Intergovernmental Panel on Climate Change's (IPCC) Special Report on the Ocean and Cryosphere in a Changing Climate (SROCC) is a report about the effects of climate change on the world's seas, sea ice, icecaps and glaciers. It was approved at the IPCC's 51st Session (IPCC-51) in September 2019 in Monaco. The SROCC's approved Summary for Policymakers (SPM) was released on 25 September 2019. The 1,300-page report by 104 authors and editors representing 36 countries referred to 6,981 publications. The report is the third in the series of three Special Reports in the current Sixth Assessment Report (AR6) cycle, which began in 2015 and will be completed in 2022. The first was the Special Report on Global Warming of 1.5 °C, while the second was the Special Report on Climate Change and Land (SRCCL), also known as the "Special Report on climate change, desertification, land degradation, sustainable land management, food security, and greenhouse gas fluxes in terrestrial ecosystems", which was released on 7 August 2019.

Jacob Sebastian Haugaard Mernild is a Danish professor in climate change, glaciology and hydrology, who is the pro-vice-chancellor of the University of Southern Denmark. Mernild has been an Intergovernmental Panel on Climate Change (IPCC) author for the United Nations since 2010. Initially a contributing author on the IPCC Fifth Assessment Report, he was lead author on the IPCC Sixth Assessment Report.

References

  1. "Cryosphere - Maps and Graphics at UNEP/GRID-Arendal". 2007-08-26. Archived from the original on 2007-08-26. Retrieved 2023-09-25.
  2. "Global Ice Viewer – Climate Change: Vital Signs of the Planet". climate.nasa.gov. Retrieved 27 November 2021.
  3. 1 2 Planton, S. (2013). "Annex III: Glossary" (PDF). In Stocker, T.F.; Qin, D.; Plattner, G.-K.; Tignor, M.; Allen, S.K.; Boschung, J.; Nauels, A.; Xia, Y.; Bex, V.; Midgley, P.M. (eds.). Climate Change 2013: The Physical Science Basis. Contribution of Working Group I to the Fifth Assessment Report of the Intergovernmental Panel on Climate Change. Cambridge University Press, Cambridge, United Kingdom and New York, NY, USA.
  4. σφαῖρα Archived 2017-05-10 at the Wayback Machine , Henry George Liddell, Robert Scott, A Greek-English Lexicon, on Perseus
  5. Hall, Dorothy K. (1985). Remote Sensing of Ice and Snow. Dordrecht: Springer Netherlands. ISBN   978-94-009-4842-6.
  6. Groisman, Pavel Ya.; Karl, Thomas R.; Knight, Richard W. (14 January 1994). "Observed Impact of Snow Cover on the Heat Balance and the Rise of Continental Spring Temperatures". Science. 263 (5144): 198–200. Bibcode:1994Sci...263..198G. doi:10.1126/science.263.5144.198. PMID   17839175. S2CID   9932394 . Retrieved 25 February 2022.
  7. Lynch-Stieglitz, M., 1994: The development and validation of a simple snow model for the GISS GCM. J. Climate, 7, 1842–1855.
  8. Cohen, J., and D. Rind, 1991: The effect of snow cover on the climate. J. Climate, 4, 689–706.
  9. 1 2 Vernekar, A. D., J. Zhou, and J. Shukla, 1995: The effect of Eurasian snow cover on the Indian monsoon. J. Climate, 8, 248–266.
  10. Google Maps: Distance between Wildspitze and Hinterer Brochkogel, cf. image scale at lower edge of screen
  11. Greve, R.; Blatter, H. (2009). Dynamics of Ice Sheets and Glaciers. Springer. doi:10.1007/978-3-642-03415-2. ISBN   978-3-642-03414-5.
  12. Paterson, W. S. B., 1993: World sea level and the present mass balance of the Antarctic ice sheet. In: W.R. Peltier (ed.), Ice in the Climate System, NATO ASI Series, I12, Springer-Verlag, Berlin, 131–140.
  13. Van den Broeke, M. R., 1996: The atmospheric boundary layer over ice sheets and glaciers. Utrecht, Universitiet Utrecht, 178 pp.
  14. Post, Austin; LaChapelle, Edward R (2000). Glacier ice. Seattle: University of Washington Press. ISBN   978-0-295-97910-6.
  15. Staff (June 9, 2020). "Millions at risk as melting Pakistan glaciers raise flood fears". Al Jazeera . Retrieved 2020-06-09.
  16. Craig, Tim (2016-08-12). "Pakistan has more glaciers than almost anywhere on Earth. But they are at risk". The Washington Post . ISSN   0190-8286 . Retrieved 2020-09-04. With 7,253 known glaciers, including 543 in the Chitral Valley, there is more glacial ice in Pakistan than anywhere on Earth outside the polar regions, according to various studies.
  17. National Geographic Almanac of Geography, 2005, ISBN   0-7922-3877-X, p. 149.
  18. "170'000 km cube d'eau dans les glaciers du monde". ArcInfo. Aug 6, 2015. Archived from the original on August 17, 2017.
  19. "Ice, Snow, and Glaciers and the Water Cycle". www.usgs.gov. Retrieved 2021-05-25.
  20. Brown, Molly Elizabeth; Ouyang, Hua; Habib, Shahid; Shrestha, Basanta; Shrestha, Mandira; Panday, Prajjwal; Tzortziou, Maria; Policelli, Frederick; Artan, Guleid; Giriraj, Amarnath; Bajracharya, Sagar R.; Racoviteanu,, Adina (November 2010). "HIMALA: Climate Impacts on Glaciers, Snow, and Hydrology in the Himalayan Region". Mountain Research and Development. 30 (4). International Mountain Society: 401–404. doi: 10.1659/MRD-JOURNAL-D-10-00071.1 . hdl: 2060/20110015312 . S2CID   129545865.{{cite journal}}: CS1 maint: multiple names: authors list (link)
  21. American Meteorological Society, Glossary of Meteorology Archived 2012-06-23 at the Wayback Machine
  22. "Glossary of Important Terms in Glacial Geology". Archived from the original on 2006-08-29. Retrieved 2006-08-22.
  23. IPCC, 2021: Annex VII: Glossary [Matthews, J.B.R., V. Möller, R. van Diemen, J.S. Fuglestvedt, V. Masson-Delmotte, C.  Méndez, S. Semenov, A. Reisinger (eds.)]. In Climate Change 2021: The Physical Science Basis. Contribution of Working Group I to the Sixth Assessment Report of the Intergovernmental Panel on Climate Change [Masson-Delmotte, V., P. Zhai, A. Pirani, S.L. Connors, C. Péan, S. Berger, N. Caud, Y. Chen, L. Goldfarb, M.I. Gomis, M. Huang, K. Leitzell, E. Lonnoy, J.B.R. Matthews, T.K. Maycock, T. Waterfield, O. Yelekçi, R. Yu, and B. Zhou (eds.)]. Cambridge University Press, Cambridge, United Kingdom and New York, NY, USA, pp. 2215–2256, doi:10.1017/9781009157896.022.
  24. Sections 4.5 and 4.6 of Lemke, P.; Ren, J.; Alley, R.B.; Allison, I.; Carrasco, J.; Flato, G.; Fujii, Y.; Kaser, G.; Mote, P.; Thomas, R.H.; Zhang, T. (2007). "Observations: Changes in Snow, Ice and Frozen Ground" (PDF). In Solomon, S.; Qin, D.; Manning, M.; Chen, Z.; Marquis, M.; Averyt, K.B.; Tignor, M.; Miller, H.L. (eds.). Climate Change 2007: The Physical Science Basis. Contribution of Working Group I to the Fourth Assessment Report of the Intergovernmental Panel on Climate Change. Cambridge University Press.
  25. Zwally, H. J., J. C. Comiso, C. L. Parkinson, W. J. Campbell, F. D. Carsey, and P. Gloersen, 1983: Antarctic Sea Ice, 1973–1976: Satellite Passive-Microwave Observations. NASA SP-459, National Aeronautics and Space Administration, Washington, D.C., 206 pp.
  26. 1 2 3 Gloersen, P., W. J. Campbell, D. J. Cavalieri, J. C. Comiso, C. L. Parkinson, and H. J. Zwally, 1992: Arctic and Antarctic Sea Ice, 1978–1987: Satellite Passive-Microwave Observations and Analysis. NASA SP-511, National Aeronautics and Space Administration, Washington, D.C., 290 pp.
  27. Parkinson, C. L., J. C. Comiso, H. J. Zwally, D. J. Cavalieri, P. Gloersen, and W. J. Campbell, 1987: Arctic Sea Ice, 1973–1976: Satellite Passive-Microwave Observations, NASA SP-489, National Aeronautics and Space Administration, Washington, D.C., 296 pp.
  28. Parkinson, C. L., 1995: Recent sea-ice advances in Baffin Bay/Davis Strait and retreats in the Bellinshausen Sea. Annals of Glaciology, 21, 348–352.
  29. 1 2 McGee, David; Gribkoff, Elizabeth (4 August 2022). "Permafrost". MIT Climate Portal. Retrieved 27 September 2023.
  30. "What is Permafrost?". International Permafrost Association. Retrieved 27 September 2023.
  31. 1 2 3 Denchak, Melissa (26 June 2018). "Permafrost: Everything You Need to Know". Natural Resources Defense Council . Retrieved 27 September 2023.
  32. Cooper, M. G.; Zhou, T.; Bennett, K. E.; Bolton, W. R.; Coon, E. T.; Fleming, S. W.; Rowland, J. C.; Schwenk, J. (4 January 2023). "Detecting Permafrost Active Layer Thickness Change From Nonlinear Baseflow Recession". Water Resources Research. 57 (1): e2022WR033154. Bibcode:2023WRR....5933154C. doi:10.1029/2022WR033154. S2CID   255639677.
  33. Obu, J. (2021). "How Much of the Earth's Surface is Underlain by Permafrost?". Journal of Geophysical Research: Earth Surface. 126 (5): e2021JF006123. Bibcode:2021JGRF..12606123O. doi: 10.1029/2021JF006123 .
  34. Sayedi, Sayedeh Sara; Abbott, Benjamin W; Thornton, Brett F; Frederick, Jennifer M; Vonk, Jorien E; Overduin, Paul; Schädel, Christina; Schuur, Edward A G; Bourbonnais, Annie; Demidov, Nikita; Gavrilov, Anatoly (22 December 2020). "Subsea permafrost carbon stocks and climate change sensitivity estimated by expert assessment". Environmental Research Letters . 15 (12): B027-08. Bibcode:2020AGUFMB027...08S. doi: 10.1088/1748-9326/abcc29 . S2CID   234515282.
  35. Schuur, T. (November 22, 2019). "Permafrost and the Global Carbon Cycle". Natural Resources Defense Council via NOAA.
  36. Koven, Charles D.; Ringeval, Bruno; Friedlingstein, Pierre; Ciais, Philippe; Cadule, Patricia; Khvorostyanov, Dmitry; Krinner, Gerhard; Tarnocai, Charles (6 September 2011). "Permafrost carbon-climate feedbacks accelerate global warming". Proceedings of the National Academy of Sciences . 108 (36): 14769–14774. Bibcode:2011PNAS..10814769K. doi: 10.1073/pnas.1103910108 . PMC   3169129 . PMID   21852573.
  37. Galera, L. A.; Eckhardt, T.; Beer C., Pfeiffer E.-M.; Knoblauch, C. (22 March 2023). "Ratio of in situ CO2 to CH4 production and its environmental controls in polygonal tundra soils of Samoylov Island, Northeastern Siberia". Journal of Geophysical Research: Biogeosciences. 128 (4): e2022JG006956. Bibcode:2023JGRG..12806956G. doi: 10.1029/2022JG006956 . S2CID   257700504.
  38. 1 2 Fox-Kemper, B., H.T. Hewitt, C. Xiao, G. Aðalgeirsdóttir, S.S. Drijfhout, T.L. Edwards, N.R. Golledge, M. Hemer, R.E. Kopp, G. Krinner, A. Mix, D. Notz, S. Nowicki, I.S. Nurhati, L. Ruiz, J.-B. Sallée, A.B.A. Slangen, and Y. Yu, 2021: Chapter 9: Ocean, Cryosphere and Sea Level Change. In Climate Change 2021: The Physical Science Basis. Contribution of Working Group I to the Sixth Assessment Report of the Intergovernmental Panel on Climate Change [Masson-Delmotte, V., P. Zhai, A. Pirani, S.L. Connors, C. Péan, S. Berger, N. Caud, Y. Chen, L. Goldfarb, M.I. Gomis, M. Huang, K. Leitzell, E. Lonnoy, J.B.R. Matthews, T.K. Maycock, T. Waterfield, O. Yelekçi, R. Yu, and B. Zhou (eds.)]. Cambridge University Press, Cambridge, United Kingdom and New York, NY, USA, pp. 1211–1362.
  39. Schuur, Edward A.G.; Abbott, Benjamin W.; Commane, Roisin; Ernakovich, Jessica; Euskirchen, Eugenie; Hugelius, Gustaf; Grosse, Guido; Jones, Miriam; Koven, Charlie; Leshyk, Victor; Lawrence, David; Loranty, Michael M.; Mauritz, Marguerite; Olefeldt, David; Natali, Susan; Rodenhizer, Heidi; Salmon, Verity; Schädel, Christina; Strauss, Jens; Treat, Claire; Turetsky, Merritt (2022). "Permafrost and Climate Change: Carbon Cycle Feedbacks From the Warming Arctic". Annual Review of Environment and Resources. 47: 343–371. doi:10.1146/annurev-environ-012220-011847. S2CID   252986002.
  40. Robinson, D. A., K. F. Dewey, and R. R. Heim, 1993: Global snow cover monitoring: an update. Bull. Amer. Meteorol. Soc., 74, 1689–1696.
  41. Getting to Know the Cryosphere Archived 15 December 2019 at the Wayback Machine , Earth Labs
  42. Thackeray, Chad W.; Derksen, Chris; Fletcher, Christopher G.; Hall, Alex (2019-12-01). "Snow and Climate: Feedbacks, Drivers, and Indices of Change". Current Climate Change Reports. 5 (4): 322–333. Bibcode:2019CCCR....5..322T. doi:10.1007/s40641-019-00143-w. ISSN   2198-6061. S2CID   201675060.
  43. IPCC, 2019: Technical Summary [H.-O. Pörtner, D.C. Roberts, V. Masson-Delmotte, P. Zhai, E. Poloczanska, K. Mintenbeck, M. Tignor, A. Alegría, M. Nicolai, A. Okem, J. Petzold, B. Rama, N.M. Weyer (eds.)]. In: IPCC Special Report on the Ocean and Cryosphere in a Changing Climate [H.- O. Pörtner, D.C. Roberts, V. Masson-Delmotte, P. Zhai, M. Tignor, E. Poloczanska, K. Mintenbeck, A. Alegría, M. Nicolai, A. Okem, J. Petzold, B. Rama, N.M. Weyer (eds.)]. Cambridge University Press, Cambridge, UK and New York, NY, USA, pp. 39–69. doi:10.1017/9781009157964.002
  44. Beckmann, Johanna; Winkelmann, Ricarda (27 July 2023). "Effects of extreme melt events on ice flow and sea level rise of the Greenland Ice Sheet". The Cryosphere. 17 (7): 3083–3099. Bibcode:2023TCry...17.3083B. doi: 10.5194/tc-17-3083-2023 .
  45. 1 2 3 "How Greenland would look without its ice sheet". BBC News. 14 December 2017. Archived from the original on 7 December 2023. Retrieved 7 December 2023.
  46. Greenland Ice Sheet. 24 October 2023. Archived from the original on 30 October 2017. Retrieved 26 May 2022.
  47. Tan, Ning; Ladant, Jean-Baptiste; Ramstein, Gilles; Dumas, Christophe; Bachem, Paul; Jansen, Eystein (12 November 2018). "Dynamic Greenland ice sheet driven by pCO2 variations across the Pliocene Pleistocene transition". Nature Communications. 9 (1): 4755. doi:10.1038/s41467-018-07206-w. PMC   6232173 . PMID   30420596.
  48. Noël, B.; van Kampenhout, L.; Lenaerts, J. T. M.; van de Berg, W. J.; van den Broeke, M. R. (19 January 2021). "A 21st Century Warming Threshold for Sustained Greenland Ice Sheet Mass Loss". Geophysical Research Letters. 48 (5): e2020GL090471. Bibcode:2021GeoRL..4890471N. doi:10.1029/2020GL090471. hdl:2268/301943. S2CID   233632072.
  49. Höning, Dennis; Willeit, Matteo; Calov, Reinhard; Klemann, Volker; Bagge, Meike; Ganopolski, Andrey (27 March 2023). "Multistability and Transient Response of the Greenland Ice Sheet to Anthropogenic CO2 Emissions". Geophysical Research Letters. 50 (6): e2022GL101827. doi:10.1029/2022GL101827. S2CID   257774870.
  50. 1 2 3 Bochow, Nils; Poltronieri, Anna; Robinson, Alexander; Montoya, Marisa; Rypdal, Martin; Boers, Niklas (18 October 2023). "Overshooting the critical threshold for the Greenland ice sheet". Nature. 622 (7983): 528–536. Bibcode:2023Natur.622..528B. doi:10.1038/s41586-023-06503-9. PMC   10584691 . PMID   37853149.
  51. Christ, Andrew J.; Rittenour, Tammy M.; Bierman, Paul R.; Keisling, Benjamin A.; Knutz, Paul C.; Thomsen, Tonny B.; Keulen, Nynke; Fosdick, Julie C.; Hemming, Sidney R.; Tison, Jean-Louis; Blard, Pierre-Henri; Steffensen, Jørgen P.; Caffee, Marc W.; Corbett, Lee B.; Dahl-Jensen, Dorthe; Dethier, David P.; Hidy, Alan J.; Perdrial, Nicolas; Peteet, Dorothy M.; Steig, Eric J.; Thomas, Elizabeth K. (20 July 2023). "Deglaciation of northwestern Greenland during Marine Isotope Stage 11". Science. 381 (6655): 330–335. Bibcode:2023Sci...381..330C. doi:10.1126/science.ade4248. PMID   37471537. S2CID   259985096.
  52. Armstrong McKay, David; Abrams, Jesse; Winkelmann, Ricarda; Sakschewski, Boris; Loriani, Sina; Fetzer, Ingo; Cornell, Sarah; Rockström, Johan; Staal, Arie; Lenton, Timothy (9 September 2022). "Exceeding 1.5°C global warming could trigger multiple climate tipping points". Science. 377 (6611): eabn7950. doi:10.1126/science.abn7950. hdl: 10871/131584 . ISSN   0036-8075. PMID   36074831. S2CID   252161375. Archived from the original on 14 November 2022. Retrieved 22 October 2022.
  53. Armstrong McKay, David (9 September 2022). "Exceeding 1.5°C global warming could trigger multiple climate tipping points – paper explainer". climatetippingpoints.info. Archived from the original on 18 July 2023. Retrieved 2 October 2022.
  54. Aschwanden, Andy; Fahnestock, Mark A.; Truffer, Martin; Brinkerhoff, Douglas J.; Hock, Regine; Khroulev, Constantine; Mottram, Ruth; Khan, S. Abbas (19 June 2019). "Contribution of the Greenland Ice Sheet to sea level over the next millennium". Science Advances. 5 (6): 218–222. Bibcode:2019SciA....5.9396A. doi:10.1126/sciadv.aav9396. PMC   6584365 . PMID   31223652.
  55. Carlson, Anders E; Walczak, Maureen H; Beard, Brian L; Laffin, Matthew K; Stoner, Joseph S; Hatfield, Robert G (10 December 2018). Absence of the West Antarctic ice sheet during the last interglaciation. American Geophysical Union Fall Meeting.
  56. Lau, Sally C. Y.; Wilson, Nerida G.; Golledge, Nicholas R.; Naish, Tim R.; Watts, Phillip C.; Silva, Catarina N. S.; Cooke, Ira R.; Allcock, A. Louise; Mark, Felix C.; Linse, Katrin (21 December 2023). "Genomic evidence for West Antarctic Ice Sheet collapse during the Last Interglacial" (PDF). Science. 382 (6677): 1384–1389. Bibcode:2023Sci...382.1384L. doi:10.1126/science.ade0664. PMID   38127761. S2CID   266436146.
  57. A. Naughten, Kaitlin; R. Holland, Paul; De Rydt, Jan (23 October 2023). "Unavoidable future increase in West Antarctic ice-shelf melting over the twenty-first century". Nature Climate Change. 13 (11): 1222–1228. Bibcode:2023NatCC..13.1222N. doi: 10.1038/s41558-023-01818-x . S2CID   264476246.
  58. Garbe, Julius; Albrecht, Torsten; Levermann, Anders; Donges, Jonathan F.; Winkelmann, Ricarda (2020). "The hysteresis of the Antarctic Ice Sheet". Nature. 585 (7826): 538–544. Bibcode:2020Natur.585..538G. doi:10.1038/s41586-020-2727-5. PMID   32968257. S2CID   221885420.
  59. 1 2 3 Armstrong McKay, David; Abrams, Jesse; Winkelmann, Ricarda; Sakschewski, Boris; Loriani, Sina; Fetzer, Ingo; Cornell, Sarah; Rockström, Johan; Staal, Arie; Lenton, Timothy (9 September 2022). "Exceeding 1.5°C global warming could trigger multiple climate tipping points". Science. 377 (6611): eabn7950. doi:10.1126/science.abn7950. hdl: 10871/131584 . ISSN   0036-8075. PMID   36074831. S2CID   252161375.
  60. 1 2 3 Armstrong McKay, David (9 September 2022). "Exceeding 1.5°C global warming could trigger multiple climate tipping points – paper explainer". climatetippingpoints.info. Retrieved 2 October 2022.
  61. 1 2 3 Pan, Linda; Powell, Evelyn M.; Latychev, Konstantin; Mitrovica, Jerry X.; Creveling, Jessica R.; Gomez, Natalya; Hoggard, Mark J.; Clark, Peter U. (30 April 2021). "Rapid postglacial rebound amplifies global sea level rise following West Antarctic Ice Sheet collapse". Science Advances. 7 (18). Bibcode:2021SciA....7.7787P. doi:10.1126/sciadv.abf7787. PMC   8087405 . PMID   33931453.
  62. Fretwell, P.; et al. (28 February 2013). "Bedmap2: improved ice bed, surface and thickness datasets for Antarctica" (PDF). The Cryosphere. 7 (1): 390. Bibcode:2013TCry....7..375F. doi: 10.5194/tc-7-375-2013 . S2CID   13129041. Archived (PDF) from the original on 16 February 2020. Retrieved 6 January 2014.
  63. Crotti, Ilaria; Quiquet, Aurélien; Landais, Amaelle; Stenni, Barbara; Wilson, David J.; Severi, Mirko; Mulvaney, Robert; Wilhelms, Frank; Barbante, Carlo; Frezzotti, Massimo (10 September 2022). "Wilkes subglacial basin ice sheet response to Southern Ocean warming during late Pleistocene interglacials". Nature Communications. 13 (1): 5328. Bibcode:2022NatCo..13.5328C. doi:10.1038/s41467-022-32847-3. PMC   9464198 . PMID   36088458.
  64. Fox-Kemper, B., H.T. Hewitt, C. Xiao, G. Aðalgeirsdóttir, S.S. Drijfhout, T.L. Edwards, N.R. Golledge, M. Hemer, R.E. Kopp, G.  Krinner, A. Mix, D. Notz, S. Nowicki, I.S. Nurhati, L. Ruiz, J.-B. Sallée, A.B.A. Slangen, and Y. Yu, 2021: Chapter 9: Ocean, Cryosphere and Sea Level Change. In Climate Change 2021: The Physical Science Basis. Contribution of Working Group I to the Sixth Assessment Report of the Intergovernmental Panel on Climate Change [Masson-Delmotte, V., P. Zhai, A. Pirani, S.L.  Connors, C. Péan, S. Berger, N. Caud, Y. Chen, L. Goldfarb, M.I. Gomis, M. Huang, K. Leitzell, E. Lonnoy, J.B.R. Matthews, T.K. Maycock, T. Waterfield, O. Yelekçi, R. Yu, and B. Zhou (eds.)]. Cambridge University Press, Cambridge, United Kingdom and New York, NY, US, doi:10.1017/9781009157896.011.
  65. "Glossary of Meteorology". American Meteorological Society. Archived from the original on 2012-06-23. Retrieved 2013-01-04.
  66. Purich, Ariaan; Doddridge, Edward W. (13 September 2023). "Record low Antarctic sea ice coverage indicates a new sea ice state". Communications Earth & Environment. 4 (1): 314. Bibcode:2023ComEE...4..314P. doi: 10.1038/s43247-023-00961-9 . S2CID   261855193.
  67. "Thermodynamics: Albedo | National Snow and Ice Data Center". nsidc.org. Archived from the original on 11 October 2017. Retrieved 14 October 2020.
  68. "How does sea ice affect global climate?". NOAA. Retrieved 21 April 2023.
  69. "Arctic Report Card 2012". NOAA. Archived from the original on 17 February 2013. Retrieved 8 May 2013.
  70. Huang, Yiyi; Dong, Xiquan; Bailey, David A.; Holland, Marika M.; Xi, Baike; DuVivier, Alice K.; Kay, Jennifer E.; Landrum, Laura L.; Deng, Yi (2019-06-19). "Thicker Clouds and Accelerated Arctic Sea Ice Decline: The Atmosphere-Sea Ice Interactions in Spring". Geophysical Research Letters. 46 (12): 6980–6989. Bibcode:2019GeoRL..46.6980H. doi: 10.1029/2019gl082791 . hdl: 10150/634665 . ISSN   0094-8276. S2CID   189968828.
  71. Senftleben, Daniel; Lauer, Axel; Karpechko, Alexey (2020-02-15). "Constraining Uncertainties in CMIP5 Projections of September Arctic Sea Ice Extent with Observations". Journal of Climate. 33 (4): 1487–1503. Bibcode:2020JCli...33.1487S. doi: 10.1175/jcli-d-19-0075.1 . ISSN   0894-8755. S2CID   210273007.
  72. Yadav, Juhi; Kumar, Avinash; Mohan, Rahul (2020-05-21). "Dramatic decline of Arctic sea ice linked to global warming". Natural Hazards. 103 (2): 2617–2621. Bibcode:2020NatHa.103.2617Y. doi:10.1007/s11069-020-04064-y. ISSN   0921-030X. S2CID   218762126.
  73. IPCC, 2018: Summary for Policymakers. In: Global Warming of 1.5 °C. An IPCC Special Report on the impacts of global warming of 1.5 °C above pre-industrial levels and related global greenhouse gas emission pathways, in the context of strengthening the global response to the threat of climate change, sustainable development, and efforts to eradicate poverty [Masson-Delmotte, V., P. Zhai, H.-O. Pörtner, D. Roberts, J. Skea, P.R. Shukla, A. Pirani, W. Moufouma-Okia, C. Péan, R. Pidcock, S. Connors, J.B.R. Matthews, Y. Chen, X. Zhou, M.I. Gomis, E. Lonnoy, T. Maycock, M. Tignor, and T. Waterfield (eds.)]. Cambridge University Press, Cambridge, UK and New York, NY, USA, pp. 3-24. doi:10.1017/9781009157940.001.
  74. Fox-Kemper, B., H.T. Hewitt, C. Xiao, G. Aðalgeirsdóttir, S.S. Drijfhout, T.L. Edwards, N.R. Golledge, M. Hemer, R.E. Kopp, G. Krinner, A. Mix, D. Notz, S. Nowicki, I.S. Nurhati, L. Ruiz, J.-B. Sallée, A.B.A. Slangen, and Y. Yu, 2021: Chapter 9: Ocean, Cryosphere and Sea Level Change. In Climate Change 2021: The Physical Science Basis. Contribution of Working Group I to the Sixth Assessment Report of the Intergovernmental Panel on Climate Change [Masson-Delmotte, V., P. Zhai, A. Pirani, S.L. Connors, C. Péan, S. Berger, N. Caud, Y. Chen, L. Goldfarb, M.I. Gomis, M. Huang, K. Leitzell, E. Lonnoy, J.B.R. Matthews, T.K. Maycock, T. Waterfield, O. Yelekçi, R. Yu, and B. Zhou (eds.)]. Cambridge University Press, Cambridge, United Kingdom and New York, NY, US doi:10.1017/9781009157896.011
  75. "Understanding climate: Antarctic sea ice extent". NOAA Climate.gov. 14 March 2023. Retrieved 2023-03-26.
  76. 1 2 Fox-Kemper, B., H.T. Hewitt, C. Xiao, G. Aðalgeirsdóttir, S.S. Drijfhout, T.L. Edwards, N.R. Golledge, M. Hemer, R.E. Kopp, G.  Krinner, A. Mix, D. Notz, S. Nowicki, I.S. Nurhati, L. Ruiz, J.-B. Sallée, A.B.A. Slangen, and Y. Yu, 2021: Chapter 9: Ocean, Cryosphere and Sea Level Change. In Climate Change 2021: The Physical Science Basis. Contribution of Working Group I to the Sixth Assessment Report of the Intergovernmental Panel on Climate Change [Masson-Delmotte, V., P. Zhai, A. Pirani, S.L.  Connors, C. Péan, S. Berger, N. Caud, Y. Chen, L. Goldfarb, M.I. Gomis, M. Huang, K. Leitzell, E. Lonnoy, J.B.R. Matthews, T.K. Maycock, T. Waterfield, O. Yelekçi, R. Yu, and B. Zhou (eds.)]. Cambridge University Press, Cambridge, United Kingdom and New York, NY, USA, pp. 1211–1362, doi:10.1017/9781009157896.011.
  77. Li, Chuanhua; Wei, Yufei; Liu, Yunfan; Li, Liangliang; Peng, Lixiao; Chen, Jiahao; Liu, Lihui; Dou, Tianbao; Wu, Xiaodong (14 June 2022). "Active Layer Thickness in the Northern Hemisphere: Changes From 2000 to 2018 and Future Simulations". JGR Atmospheres. 127 (12): e2022JD036785. Bibcode:2022JGRD..12736785L. doi:10.1029/2022JD036785. S2CID   249696017.
  78. Overduin, P. P.; Schneider von Deimling, T.; Miesner, F.; Grigoriev, M. N.; Ruppel, C.; Vasiliev, A.; Lantuit, H.; Juhls, B.; Westermann, S. (17 April 2019). "Submarine Permafrost Map in the Arctic Modeled Using 1-D Transient Heat Flux (SuPerMAP)" (PDF). Journal of Geophysical Research: Oceans. 124 (6): 3490–3507. Bibcode:2019JGRC..124.3490O. doi:10.1029/2018JC014675. hdl:1912/24566. S2CID   146331663.
  79. "Frozen Ground, the News Bulletin of the IPA". International Permafrost Association. 2014-02-10. Retrieved 2016-04-28.
  80. Carrer, Marco; Dibona, Raffaella; Prendin, Angela Luisa; Brunetti, Michele (February 2023). "Recent waning snowpack in the Alps is unprecedented in the last six centuries". Nature Climate Change. 13 (2): 155–160. Bibcode:2023NatCC..13..155C. doi: 10.1038/s41558-022-01575-3 . hdl: 11577/3477269 . ISSN   1758-6798.
  81. 1 2 Fox-Kemper, B.; Hewitt, H.T.; Xiao, C.; Aðalgeirsdóttir, G.; Drijfhout, S.S.; Edwards, T.L.; Golledge, N.R.; Hemer, M.; Kopp, R.E.; Krinner, G.; Mix, A. (2021). Masson-Delmotte, V.; Zhai, P.; Pirani, A.; Connors, S.L.; Péan, C.; Berger, S.; Caud, N.; Chen, Y.; Goldfarb, L. (eds.). "Ocean, Cryosphere and Sea Level Change" (PDF). Climate Change 2021: The Physical Science Basis. Contribution of Working Group I to the Sixth Assessment Report of the Intergovernmental Panel on Climate Change. 2021. Cambridge University Press, Cambridge, UK and New York, NY, USA: 1283–1285. doi:10.1017/9781009157896.011. ISBN   9781009157896.
  82. Pederson, Gregory T.; Gray, Stephen T.; Woodhouse, Connie A.; Betancourt, Julio L.; Fagre, Daniel B.; Littell, Jeremy S.; Watson, Emma; Luckman, Brian H.; Graumlich, Lisa J. (2011-07-15). "The Unusual Nature of Recent Snowpack Declines in the North American Cordillera". Science. 333 (6040): 332–335. Bibcode:2011Sci...333..332P. doi:10.1126/science.1201570. ISSN   0036-8075. PMID   21659569. S2CID   29486298.
  83. Belmecheri, Soumaya; Babst, Flurin; Wahl, Eugene R.; Stahle, David W.; Trouet, Valerie (2016). "Multi-century evaluation of Sierra Nevada snowpack". Nature Climate Change. 6 (1): 2–3. Bibcode:2016NatCC...6....2B. doi:10.1038/nclimate2809. ISSN   1758-6798.
  84. Brown, Ross D.; Goodison, Barry E.; Brown, Ross D.; Goodison, Barry E. (1996-06-01). "Interannual Variability in Reconstructed Canadian Snow Cover, 1915–1992". Journal of Climate. 9 (6): 1299–1318. Bibcode:1996JCli....9.1299B. doi: 10.1175/1520-0442(1996)009<1299:ivircs>2.0.co;2 .
  85. Hughes, M. G.; Frei, A.; Robinson, D.A. (1996). "Historical analysis of North American snow cover extent: merging satellite and station-derived snow cover observations". Proceedings of the Annual Meeting - Eastern Snow Conference. Williamsburg, Virginia: Eastern Snow Conference. pp. 21–31. ISBN   9780920081181.
  86. Groisman, P. Ya, and D. R. Easterling, 1994: Variability and trends of total precipitation and snowfall over the United States and Canada. J. Climate, 7, 184–205.
  87. Prinsenberg, S. J. 1988: Ice-cover and ice-ridge contributions to the freshwater contents of Hudson Bay and Foxe Basin. Arctic, 41, 6–11.