Climate change mitigation (or decarbonisation) is an action to limit the greenhouse gases in the atmosphere that cause climate change. Climate change mitigation actions include conserving energy and replacing fossil fuels with clean energy sources. Secondary mitigation strategies include changes to land use and removing carbon dioxide (CO2) from the atmosphere.[1][2] Recent assessments emphasize that global greenhouse gas emissions must peak before 2025 and decline by about 43% by 2030 to limit warming to 1.5°C, requiring rapid transitions in energy, transport, and land-use systems.[3] Current climate change mitigation policies are insufficient as they would still result in global warming of about 2.7°C by 2100,[4] significantly above the 2015 Paris Agreement's[5] goal of limiting global warming to below 2°C.[6][7]Recent research shows that demand-side climate solutions—such as shifts in transportation behavior, dietary change, improved building energy efficiency, and reduced material consumption—could reduce global greenhouse gas emissions by 40% to 70% by 2050 while improving human well-being.[8]
This article is actively undergoing a major edit for a little while. To help avoid edit conflicts, do not edit it while this notice is displayed.This notice was added at 18:24, 26 January 2026 (UTC). This page was last edited 17 hours ago, at 18:25, 26 January 2026 (UTC) (refresh). Please remove this template if this page hasn't been edited for a significant time. If you added this notice, remember to remove it or replace it with {{under construction}} between editing sessions.
Human land use changes such as agriculture and deforestation cause about 1/4th of climate change. These changes impact how much CO2 is absorbed by plant matter and how much organic matter decays or burns to release CO2. These changes are part of the fast carbon cycle, whereas fossil fuels release CO2 that was buried underground as part of the slow carbon cycle. Methane is a short-lived greenhouse gas that is produced by decaying organic matter and livestock, as well as fossil fuel extraction. Land use changes can also impact precipitation patterns and the reflectivity of the surface of the Earth. It is possible to cut emissions from agriculture by reducing food waste, switching to a more plant-based diet (also referred to as low-carbon diet), and by improving farming processes.[15]
Various policies can encourage climate change mitigation. Carbon pricing systems have been set up that either tax CO2 emissions or cap total emissions and trade emission credits. Fossil fuel subsidies can be eliminated in favour of clean energy subsidies, and incentives offered for installing energy efficiency measures or switching to electric power sources.[16] Another issue is overcoming environmental objections when constructing new clean energy sources and making grid modifications. Limiting climate change by reducing greenhouse gas emissions or removing greenhouse gases from the atmosphere could be supplemented by climate technologies such as solar radiation management (or solar geoengineering). Complementary climate change actions, including climate activism, have a focus on political and cultural aspects.
While climate mitigation is often cast as a burden to be distributed in some or other way, it can also be seen as an opportunity for industrial development, exports, and status seeking for countries.[17] The examples and precedents that countries set may influence other countries to follow suit.[17]
It is possible to approach various mitigation measures in parallel. This is because there is no single pathway to limit global warming to 1.5 or 2°C.[20]:109 There are four types of measures:
The IPCC defined carbon dioxide removal as "Anthropogenic activities removing carbon dioxide (CO2) from the atmosphere and durably storing it in geological, terrestrial, or ocean reservoirs, or in products. It includes existing and potential anthropogenic enhancement of biological or geochemical CO2 sinks and direct air carbon dioxide capture and storage (DACCS) but excludes natural CO2 uptake not directly caused by human activities."[19]
Greenhouse gas emissions from human activities strengthen the greenhouse effect. This contributes to climate change. Most is carbon dioxide from burning fossil fuels: coal, oil, and natural gas. Human-caused emissions have increased atmospheric carbon dioxide by about 50% over pre-industrial levels. Emissions in the 2010s averaged a record 56 billion tons (Gt) a year.[23] In 2016, energy for electricity, heat and transport was responsible for 73.2% of GHG emissions. Direct industrial processes accounted for 5.2%, waste for 3.2% and agriculture, forestry and land use for 18.4%.[24]
Electricity generation and transport are major emitters. The largest single source is coal-fired power stations with 20% of greenhouse gas emissions.[25]Deforestation and other changes in land use also emit carbon dioxide and methane. The largest sources of anthropogenic methane emissions are agriculture, and gas venting and fugitive emissions from the fossil-fuel industry. The largest agricultural methane source is livestock. Agricultural soils emit nitrous oxide, partly due to fertilizers.[26] There is now a political solution to the problem of fluorinated gases from refrigerants. This is because many countries have ratified the Kigali Amendment.[27]
Carbon dioxide (CO2) is the dominant emitted greenhouse gas. Methane (CH4) emissions almost have the same short-term impact.[28]Nitrous oxide (N2O) and fluorinated gases (F-Gases) play a minor role. Livestock and manure produce 5.8% of all greenhouse gas emissions.[24] But this depends on the time frame used to calculate the global warming potential of the respective gas.[29][30]
Scientists have increased the use satellites to locate and measure greenhouse gas emissions and deforestation. Earlier, scientists largely relied on or calculated estimates of greenhouse gas emissions and governments' self-reported data.[32][33]
Global greenhouse gas emission scenarios, based on policies and pledges as of 11/21
The annual "Emissions Gap Report" by UNEP stated in 2022 that it was necessary to almost halve emissions. "To get on track for limiting global warming to 1.5°C, global annual GHG emissions must be reduced by 45 per cent compared with emissions projections under policies currently in place in just eight years, and they must continue to decline rapidly after 2030, to avoid exhausting the limited remaining atmospheric carbon budget."[15]:xvi The report commented that the world should focus on broad-based economy-wide transformations and not incremental change.[15]:xvi
In 2022, the Intergovernmental Panel on Climate Change (IPCC) released its Sixth Assessment Report on climate change. It warned that greenhouse gas emissions must peak before 2025 at the latest and decline 43% by 2030 to have a good chance of limiting global warming to 1.5°C (2.7°F).[34][35] Or in the words of Secretary-General of the United Nations António Guterres: "Main emitters must drastically cut emissions starting this year".[36]
A 2023 synthesis by leading climate scientists highlighted ten critical areas in climate science with significant policy implications. These include the near inevitability of temporarily exceeding the 1.5°C warming limit, the urgent need for a rapid and managed fossil fuel phase-out, challenges in scaling carbon dioxide removal technologies, uncertainties regarding the future contribution of natural carbon sinks, and the interconnected crises of biodiversity loss and climate change. These insights underscore the necessity for immediate and comprehensive mitigation strategies to address the multifaceted challenges of climate change.[37]
Climate Action Tracker described the situation on 9 November 2021 as follows. The global temperature will rise by 2.7°C by the end of the century with current policies and by 2.9°C with nationally adopted policies. The temperature will rise by 2.4°C if countries only implement the pledges for 2030. The rise would be 2.1°C with the achievement of the long-term targets too. Full achievement of all announced targets would mean the rise in global temperature will peak at 1.9°C and go down to 1.8°C by the year 2100.[38] Experts gather information about climate pledges in the Global Climate Action Portal - Nazca. The scientific community is checking their fulfilment.[39]
There has not been a definitive or detailed evaluation of most goals set for 2020. But it appears the world failed to meet most or all international goals set for that year.[40][41]
One update came during the 2021 United Nations Climate Change Conference in Glasgow. The group of researchers running the Climate Action Tracker looked at countries responsible for 85% of greenhouse gas emissions. It found that only four countries or political entities—the EU, UK, Chile and Costa Rica—have published a detailed official policy‑plan that describes the steps to realise 2030 mitigation targets. These four polities are responsible for 6% of global greenhouse gas emissions.[42]
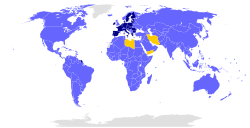
In 2021 the US and EU launched the Global Methane Pledge to cut methane emissions by 30% by 2030. The UK, Argentina, Indonesia, Italy and Mexico joined the initiative. Ghana and Iraq signalled interest in joining. A White House summary of the meeting noted those countries represent six of the top 15 methane emitters globally.[43] Israel also joined the initiative.[44]
Coal, oil, and natural gas remain the primary global energy sources even as renewables have begun rapidly increasing.
The energy system includes the delivery and use of energy. It is the main emitter of carbon dioxide (CO2).[46]:6–6 Rapid and deep reductions in the carbon dioxide and other greenhouse gas emissions from the energy sector are necessary to limit global warming to well below 2°C.[46]:6–3 IPCC recommendations include reducing fossil fuel consumption, increasing production from low- and zero carbon energy sources, and increasing use of electricity and alternative energy carriers.[46]:6–3
Nearly all scenarios and strategies involve a major increase in the use of renewable energy in combination with increased energy efficiency measures.[47]:xxiii It will be necessary to accelerate the deployment of renewable energy six-fold from 0.25% annual growth in 2015 to 1.5% to keep global warming under 2°C.[48]
Renewable energy sources, especially solar photovoltaic and wind power, are providing an increasing share of power capacity.
The competitiveness of renewable energy is a key to a rapid deployment. In 2020, onshore wind and solar photovoltaics were the cheapest source for new bulk electricity generation in many regions.[50] Renewables may have higher storage costs but non-renewables may have higher clean-up costs.[51] A carbon price can increase the competitiveness of renewable energy.[52]
The 150 MW Andasol solar power station is a commercial parabolic troughsolar thermal power plant, located in Spain. The Andasol plant uses tanks of molten salt to store solar energy so that it can continue generating electricity for 7.5 hours after the sun has stopped shining.
Wind and sun can provide large amounts of low-carbon energy at competitive production costs.[54] The IPCC estimates that these two mitigation options have the largest potential to reduce emissions before 2030 at low cost.[9]:43
Solar photovoltaics (PV) has become the cheapest way to generate electricity in many regions of the world.[55]
A 2024 review found that the global levelized cost of electricity for solar PV had fallen to between US$0.039 and 0.041 per kWh.[56] The growth of photovoltaics has been close to exponential. It has about doubled every three years since the 1990s.[57][58] A different technology is concentrated solar power (CSP). This uses mirrors or lenses to concentrate a large area of sunlight on to a receiver. With CSP, the energy can be stored for a few hours. This provides supply in the evening. Solar water heating doubled between 2010 and 2019.[59]
Regions in the higher northern and southern latitudes have the greatest potential for wind power.[60] Offshore wind farms are more expensive. But offshore units deliver more energy per installed capacity with less fluctuations.[61] In most regions, wind power generation is higher in the winter when PV output is low. For this reason, combinations of wind and solar power lead to better-balanced systems.[62]
Other well-established renewable energy forms include hydropower, bioenergy and geothermal energy.
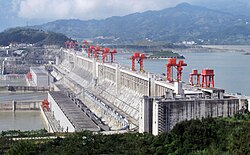
Hydroelectricity is electricity generated by hydropower and plays a leading role in countries like Brazil, Norway and China.[63] but there are geographical limits and environmental issues.[64]Tidal power can be used in coastal regions.
Bioenergy can provide energy for electricity, heat and transport. Bioenergy, in particular biogas, can provide dispatchable electricity generation.[65] While burning plant-derived biomass releases CO2, the plants withdraw CO2 from the atmosphere while they grow. The technologies for producing, transporting and processing a fuel have a significant impact on the lifecycle emissions of the fuel.[66] For example, aviation is starting to use renewable biofuels.[67]
Wind and solar power production does not consistently match demand.[71][72] To deliver reliable electricity from variable renewable energy sources such as wind and solar, electrical power systems must be flexible.[73] Most electrical grids were constructed for non-intermittent energy sources such as coal-fired power plants.[74] The integration of larger amounts of solar and wind energy into the grid requires a change of the energy system; this is necessary to ensure that the supply of electricity matches demand.[75]
There are various ways to make the electricity system more flexible. In many places, wind and solar generation are complementary on a daily and a seasonal scale. There is more wind during the night and in winter when solar energy production is low.[75] Linking different geographical regions through long-distance transmission lines also makes it possible to reduce variability.[76] It is possible to shift energy demand in time. Energy demand management and the use of smart grids make it possible to match the times when variable energy production is highest.[75]Sector coupling can provide further flexibility. This involves coupling the electricity sector to the heat and mobility sector via power-to-heat-systems and electric vehicles.[77]
Battery storage facility
Energy storage helps overcome barriers to intermittent renewable energy.[78] The most commonly used and available storage method is pumped-storage hydroelectricity. This requires locations with large differences in height and access to water.[78] Batteries are also in wide use.[79] They typically store electricity for short periods.[80] Batteries have low energy density. This and their cost makes them impractical for the large energy storage necessary to balance inter-seasonal variations in energy production.[81] Some locations have implemented pumped hydro storage with capacity for multi-month usage.[82]
Nuclear power could complement renewables for electricity.[83] On the other hand, environmental and security risks could outweigh the benefits.[84][85][86] Examples of these environmental risks being the discharge of radioactive water to nearby ecosystems, and the routine release of radioactive gases as well.[87]
The construction of new nuclear reactors currently takes about 10 years. This is much longer than scaling up the deployment of wind and solar.[88]:335 And this timing gives rise to credit risks.[89] However nuclear may be much cheaper in China. China is building a significant number of new power plants.[89]As of 2019[update] the cost of extending nuclear power plant lifetimes is competitive with other electricity generation technologies[90] if long term costs for nuclear waste disposal are excluded from the calculation. There is also no sufficient financial insurance for nuclear accidents.[91]
Switching from coal to natural gas has advantages in terms of sustainability. For a given unit of energy produced, the life-cycle greenhouse-gas emissions of natural gas are around 40 times the emissions of wind or nuclear energy but are much less than coal. Burning natural gas produces around half the emissions of coal when used to generate electricity and around two-thirds the emissions of coal when used to produce heat.[92] Natural gas combustion also produces less air pollution than coal.[93] However, natural gas is a potent greenhouse gas in itself, and leaks during extraction and transportation can negate the advantages of switching away from coal.[94] The technology to curb methane leaks is widely available but it is not always used.[94]
Switching from coal to natural gas reduces emissions in the short term and thus contributes to climate change mitigation. However, in the long term it does not provide a path to net-zero emissions. Developing natural gas infrastructure risks carbon lock-in and stranded assets, where new fossil infrastructure either commits to decades of carbon emissions, or has to be written off before it makes a profit.[95][96]
Reducing demand for products and services that cause greenhouse gas emissions can help in mitigating climate change. One is to reduce demand by behavioural and cultural changes, for example by making changes in diet, especially the decision to reduce meat consumption,[97] an effective action individuals take to fight climate change. Another is by reducing the demand by improving infrastructure, by building a good public transport network, for example. Lastly, changes in end-use technology can reduce energy demand. For instance a well-insulated house emits less than a poorly-insulated house.[98]:119
Mitigation options that reduce demand for products or services help people make personal choices to reduce their carbon footprint. This could be in their choice of transport or food.[99]:5–3 So these mitigation options have many social aspects that focus on demand reduction; they are therefore demand-sidemitigation actions. For example, people with high socio-economic status often cause more greenhouse gas emissions than those from a lower status. If they reduce their emissions and promote green policies, these people could become low-carbon lifestyle role models.[99]:5–4 However, there are many psychological variables that influence consumers. These include awareness and perceived risk.[100]
Government policies can support or hinder demand-side mitigation options. For example, public policy can promote circular economy concepts which would support climate change mitigation.[99]:5–6 Reducing greenhouse gas emissions is linked to the sharing economy.
There is a debate regarding the correlation of economic growth and emissions. It seems economic growth no longer necessarily means higher emissions.[101][102]
A 2024 article in Nature Climate Change emphasised the importance of integrating behavioural science into climate change mitigation strategies. Six key recommendations aimed at improving individual and collective actions toward reducing greenhouse gas emissions include overcoming barriers to research, fostering cross-disciplinary collaborations, and promoting practical behaviour-oriented solutions. These insights suggest that behavioural science plays a crucial role alongside technological and policy measures in addressing climate change.[103]
A paper published in Environmental Research Letters in 2024 described the growing role of demand-side strategies in achieving climate change mitigation. It described how behavioral, social, and infrastructural interventions, such as shifting consumption patterns, improving urban design, and promoting shared mobility could collectively reduce global greenhouse gas emissions by up to 40–70% by mid-century—describing how changes in lifestyles and demand systems are essential complements to technological and policy solutions.[104]
Global primary energy demand exceeded 161,000 terawatt hours (TWh) in 2018.[105] This refers to electricity, transport and heating including all losses. In transport and electricity production, fossil fuel usage has a low efficiency of less than 50%. Large amounts of heat in power plants and in motors of vehicles go to waste. The actual amount of energy consumed is significantly lower at 116,000 TWh.[106]
Energy conservation is the effort made to reduce the consumption of energy by using less of an energy service. One way is to use energy more efficiently. This means using less energy than before to produce the same service. Another way is to reduce the amount of service used. An example of this would be to drive less. Energy conservation is at the top of the sustainable energy hierarchy.[107] When consumers reduce wastage and losses they can conserve energy. The upgrading of technology as well as the improvements to operations and maintenance can result in overall efficiency improvements.
Efficient energy use (or energy efficiency) is the process of reducing the amount of energy required to provide products and services. Improved energy efficiency in buildings ("green buildings"), industrial processes and transportation could reduce the world's energy needs in 2050 by one third. This would help reduce global emissions of greenhouse gases.[108] For example, insulating a building allows it to use less heating and cooling energy to achieve and maintain thermal comfort. Improvements in energy efficiency are generally achieved by adopting a more efficient technology or production process.[109] Another way is to use commonly accepted methods to reduce energy losses.
Lifestyle changes
This pie chart illustrates both total emissions for each income group, and emissions per person within each income group. For example, the 10% with the highest incomes are responsible for half of carbon emissions, and its members emit an average of more than five times as much per person as members of the lowest half of the income scale.
Individual action on climate change can include personal choices in many areas. These include diet, travel, household energy use, consumption of goods and services, and family size. People who wish to reduce their carbon footprint can take high-impact actions such as avoiding frequent flying and petrol-fuelled cars, eating mainly a plant-based diet, having fewer children,[111][112] using clothes and electrical products for longer,[113] and electrifying homes.[114][115] These approaches are more practical for people in high-income countries with high-consumption lifestyles. Naturally, it is more difficult for those with lower income statuses to make these changes. This is because choices like electric-powered cars may not be available. Excessive consumption is more to blame for climate change than population increase.[116] High-consumption lifestyles have a greater environmental impact, with the richest 10% of people emitting about half the total lifestyle emissions.[117][118]
Some scientists say that avoiding meat and dairy foods is the single biggest way an individual can reduce their environmental impact.[119] The widespread adoption of a vegetarian diet could cut food-related greenhouse gas emissions by 63% by 2050.[120] China introduced new dietary guidelines in 2016 which aim to cut meat consumption by 50% and thereby reduce greenhouse gas emissions by 1Gt per year by 2030.[121] Overall, food accounts for the largest share of consumption-based greenhouse gas emissions. It is responsible for nearly 20% of the global carbon footprint. Almost 15% of all anthropogenic greenhouse gas emissions have been attributed to the livestock sector.[115]
A shift towards plant-based diets would help to mitigate climate change.[122] In particular, reducing meat consumption would help to reduce methane emissions.[123] The Global Methane Pledge is an initiative launched by the United States and European Union to reduce global methane emissions by 30% by 2030 to keep the 1.5°C global warming limit in reach.[124] If high-income nations switched to a plant-based diet, vast amounts of land used for animal agriculture could be allowed to return to their natural state. This in turn has the potential to sequester 100 billion tonnes of CO2 by the end of the century.[125][126] A comprehensive analysis found that plant based diets reduce emissions, water pollution and land use significantly (by 75%), while reducing the destruction of wildlife and usage of water.[127]
Environmental footprint of 55,504 UK citizens by diet group (Nat Food 4, 565–574, 2023).
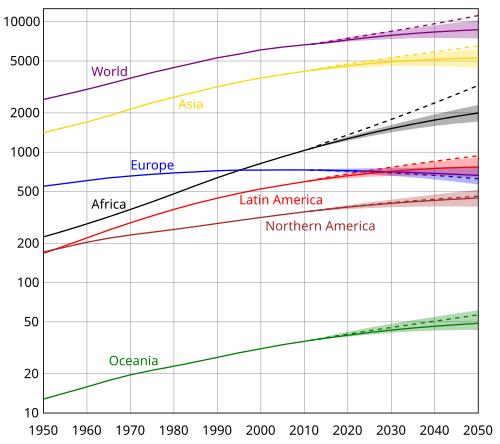
Population growth has resulted in higher greenhouse gas emissions in most regions, particularly Africa.[46]:6–11 However, economic growth has a bigger effect than population growth.[99]:6–622 Rising incomes, changes in consumption and dietary patterns, as well as population growth, cause pressure on land and other natural resources. This leads to more greenhouse gas emissions and fewer carbon sinks.[129]:117 Some scholars have argued that humane policies to slow population growth should be part of a broad climate response together with policies that end fossil fuel use and encourage sustainable consumption.[130] Advances in female education and reproductive health, especially voluntary family planning, can contribute to reducing population growth.[99]:5–35
An important mitigation measure is "preserving and enhancing carbon sinks".[9] This refers to the management of Earth's natural carbon sinks in a way that preserves or increases their capability to remove CO2 from the atmosphere and to store it durably. Scientists call this process also carbon sequestration. In the context of climate change mitigation, the IPCC defines a sink as "Any process, activity or mechanism which removes a greenhouse gas, an aerosol or a precursor of a greenhouse gas from the atmosphere".[19]:2249 Globally, the two most important carbon sinks are vegetation and the ocean.[131]
To enhance the ability of ecosystems to sequester carbon, changes are necessary in agriculture and forestry.[132] Examples are preventing deforestation and restoring natural ecosystems by reforestation.[133]:266 Scenarios that limit global warming to 1.5°C typically project the large-scale use of carbon dioxide removal methods over the 21st century.[134]:1068[135]:17 There are concerns about over-reliance on these technologies, and their environmental impacts.[135]:17[136]:34 But ecosystem restoration and reduced conversion are among the mitigation tools that can yield the most emissions reductions before 2030.[9]:43
Land-based mitigation options are referred to as "AFOLU mitigation options" in the 2022 IPCC report on mitigation. The abbreviation stands for "agriculture, forestry and other land use"[9]:37 The report described the economic mitigation potential from relevant activities around forests and ecosystems as follows: "the conservation, improved management, and restoration of forests and other ecosystems (coastal wetlands, peatlands, savannas and grasslands)". A high mitigation potential is found for reducing deforestation in tropical regions. The economic potential of these activities has been estimated to be 4.2 to 7.4 gigatonnes of carbon dioxide equivalent (GtCO2 -eq) per year.[9]:37
Transferring land rights to indigenous inhabitants is argued to efficiently conserve forests.
The Stern Review on the economics of climate change stated in 2007 that curbing deforestation was a highly cost-effective way of reducing greenhouse gas emissions.[137] About 95% of deforestation occurs in the tropics, where clearing of land for agriculture is one of the main causes.[138] One forest conservation strategy is to transfer rights over land from public ownership to its indigenous inhabitants.[139] Land concessions often go to powerful extractive companies.[139] Conservation strategies that exclude and even evict humans, called fortress conservation, often lead to more exploitation of the land. This is because the native inhabitants turn to work for extractive companies to survive.[140]
Proforestation is promoting forests to capture their full ecological potential.[141] This is a mitigation strategy as secondary forests that have regrown in abandoned farmland are found to have less biodiversity than the original old-growth forests. Original forests store 60% more carbon than these new forests.[142] Strategies include rewilding and establishing wildlife corridors.[143][144]
Afforestation, reforestation and preventing desertification
Afforestation is the establishment of trees where there was previously no tree cover. Scenarios for new plantations covering up to 4000 million hectares (Mha) (6300 x 6300km) suggest cumulative carbon storage of more than 900GtC (2300GtCO2) until 2100.[145] But they are not a viable alternative to aggressive emissions reduction.[146] This is because the plantations would need to be so large they would eliminate most natural ecosystems or reduce food production.[147] One example is the Trillion Tree Campaign.[148][149] However, preserving biodiversity is also important and for example not all grasslands are suitable for conversion into forests.[150] Grasslands can even turn from carbon sinks to carbon sources.
Helping existing roots and tree stumps regrow even in long deforested areas is argued to be more efficient than planting trees. Lack of legal ownership to trees by locals is the biggest obstacle preventing regrowth.
Reforestation is the restocking of existing depleted forests or in places where there were recently forests. Reforestation could save at least 1GtCO2 per year, at an estimated cost of $5–15 per tonne of carbon dioxide (tCO2).[153] Restoring all degraded forests all over the world could capture about 205GtC (750GtCO2).[154] With increased intensive agriculture and urbanisation, there is an increase in the amount of abandoned farmland. By some estimates, for every acre of original old-growth forest cut down, more than 50 acres of new secondary forests are growing.[142][155] In some countries, promoting regrowth on abandoned farmland could offset years of emissions.[156]
Planting new trees can be expensive and a risky investment. For example, about 80 per cent of planted trees in the Sahel die within two years.[151] Reforestation has higher carbon storage potential than afforestation. Even long-deforested areas still contain an "underground forest" of living roots and tree stumps. Helping native species sprout naturally is cheaper than planting new trees and they are more likely to survive. This could include pruning and coppicing to accelerate growth. This also provides woodfuel, which is otherwise a major source of deforestation. Such practices, called farmer-managed natural regeneration, are centuries old but the biggest obstacle towards implementation is ownership of the trees by the state. The state often sells timber rights to businesses which leads to locals uprooting seedlings because they see them as a liability. Legal aid for locals[157][158] and changes to property law such as in Mali and Niger have led to significant changes. Scientists describe them as the largest positive environmental transformation in Africa. It is possible to discern from space the border between Niger and the more barren land in Nigeria, where the law has not changed.[151][152]
Rangelands account for more half the world's land and could sequester 35% of terrestrial carbon.[159]Pastoralists are those who move with their herds that feed and migrate over often unenclosed grazelands. Such land is usually unable to grow any other kind of food. Rangelands coevolved with large wild herds, many of which have decreased or gone extinct, and pastoralists' herds replace such wild herds and thus help maintain the ecosystem.[160] However, the movement of herds grazing on large areas over vast distances is increasingly restricted by governments, who often grant exclusive title to lands for more profitable uses which restricts pastoralists to more enclose spaces.[161] This has led to the overgrazing of the land and desertification, as well as conflict.[159]
There are many measures to increase soil carbon.[162] This makes it complex[163] and hard to measure and account for.[164] One advantage is that there are fewer trade-offs for these measures than for BECCS or afforestation, for example.[165]
Globally, protecting healthy soils and restoring the soil carbon sponge could remove 7.6 billion tonnes of carbon dioxide from the atmosphere annually. This is more than the annual emissions of the US.[166][167] Trees capture CO2 while growing above ground and exuding larger amounts of carbon below ground. Trees contribute to the building of a soil carbon sponge. Carbon formed above ground is released as CO2 immediately when wood is burned. If dead wood remains untouched, only some of the carbon returns to the atmosphere as decomposition proceeds.[166]
Farming can deplete soil carbon and render soil incapable of supporting life. However, conservation farming can protect carbon in soils, and repair damage over time.[168] The farming practice of cover crops is a form of carbon farming.[169] Methods that enhance carbon sequestration in soil include no-till farming, residue mulching and crop rotation. Scientists have described the best management practices for European soils to increase soil organic carbon. These are conversion of arable land to grassland, straw incorporation, reduced tillage, straw incorporation combined with reduced tillage, ley cropping system and cover crops.[170]
Another mitigation option is the production of biochar and its storage in soils This is the solid material that remains after the pyrolysis of biomass. Biochar production releases half of the carbon from the biomass—either released into the atmosphere or captured with CCS—and retains the other half in the stable biochar.[171] It can endure in soil for thousands of years.[172] Biochar may increase the soil fertility of acidic soils and increase agricultural productivity. During production of biochar, heat is released which may be used as bioenergy.[171]
Wetland restoration is an important mitigation measure. It has moderate to great mitigation potential on a limited land area with low trade-offs and costs.[173] Wetlands perform two important functions in relation to climate change. They can sequester carbon, converting carbon dioxide to solid plant material through photosynthesis. They also store and regulate water.[174][175] Wetlands store about 45 million tonnes of carbon per year globally.[176]
Some wetlands are a significant source of methane emissions.[177] Some also emit nitrous oxide.[178][179]Peatland globally covers just 3% of the land's surface.[180] But it stores up to 550 gigatonnes (Gt) of carbon. This represents 42% of all soil carbon and exceeds the carbon stored in all other vegetation types, including the world's forests.[181] The threat to peatlands includes draining the areas for agriculture. Another threat is cutting down trees for lumber, as the trees help hold and fix the peatland.[182][183] Additionally, peat is often sold for compost.[184] It is possible to restore degraded peatlands by blocking drainage channels in the peatland, and allowing natural vegetation to recover.[143][185]
Mangroves, salt marshes and seagrasses make up the majority of the ocean's vegetated habitats. They only equal 0.05% of the plant biomass on land. But they store carbon 40 times faster than tropical forests.[143]Bottom trawling, dredging for coastal development and fertiliser runoff have damaged coastal habitats. Notably, 85% of oyster reefs globally have been removed in the last two centuries. Oyster reefs clean the water and help other species thrive. This increases biomass in that area. In addition, oyster reefs mitigate the effects of climate change by reducing the force of waves from hurricanes. They also reduce the erosion from rising sea levels.[186] Restoration of coastal wetlands is thought to be more cost-effective than restoration of inland wetlands.[187]
These options focus on the carbon which ocean reservoirs can store. They include ocean fertilization, ocean alkalinity enhancement or enhanced weathering.[188]:12–36 The IPCC found in 2022 ocean-based mitigation options currently have only limited deployment potential. But it assessed that their future mitigation potential is large.[188]:12–4 It found that in total, ocean-based methods could remove 1–100Gt of CO2 per year.[98]:TS-94 Their costs are in the order of US$40–500 per tonne of CO2. Most of these options could also help to reduce ocean acidification. This is the drop in pH value caused by increased atmospheric CO2 concentrations.[189]
The recovery of whale populations can play a role in mitigation as whales play a significant part in nutrient recycling in the ocean. This occurs through what is referred to as the whale pump, where whales' liquid feces stay at the surface of the ocean. Phytoplankton live near the surface of the ocean in order use sunlight to photosynthesize and rely on much of the carbon, nitrogen and iron of the feces. As the phytoplankton form the base of the marine food chain this increases ocean biomass and thus the amount of carbon sequestrated in it.[190]
Blue carbon management is another type of ocean-based biological carbon dioxide removal (CDR). It can involve land-based as well as ocean-based measures.[188]:12–51[191]:764 The term usually refers to the role that tidal marshes, mangroves and seagrasses can play in carbon sequestration.[19]:2220 Some of these efforts can also take place in deep ocean waters. This is where the vast majority of ocean carbon is held. These ecosystems can contribute to climate change mitigation and also to ecosystem-based adaptation. Conversely, when blue carbon ecosystems are degraded or lost they release carbon back to the atmosphere.[19]:2220 There is increasing interest in developing blue carbon potential.[192] Scientists have found that in some cases these types of ecosystems remove far more carbon per area than terrestrial forests. However, the long-term effectiveness of blue carbon as a carbon dioxide removal solution remains under discussion.[193][192][194]
Enhanced weathering could remove 2–4Gt of CO2 per year. This process aims to accelerate natural weathering by spreading finely ground silicate rock, such as basalt, onto surfaces. This speeds up chemical reactions between rocks, water, and air. It removes carbon dioxide from the atmosphere, permanently storing it in solid carbonate minerals or ocean alkalinity.[195] Cost estimates are in the US$50–200 per tonne range of CO2.[98]:TS-94
Schematic showing both terrestrial and geological sequestration of carbon dioxide emissions from a large point source, for example burning natural gas
In addition to traditional land-based methods to remove carbon dioxide (CO2) from the air, other technologies are under development. These could reduce CO2 emissions and lower existing atmospheric CO2 levels. Carbon capture and storage (CCS) is a method to mitigate climate change by capturing CO2 from large point sources, such as cement factories or biomass power plants. It then stores it away safely instead of releasing it into the atmosphere. The IPCC estimates that the costs of halting global warming would double without CCS.[196]
Among the most viable carbon dioxide removal methods considered alongside solar radiation modification, biochar soil amendment is already being deployed commercially. Studies indicate that the carbon it contains remains stable in soils for centuries, giving it a durable potential of removing gigatonnes of CO2 per year.[197] Expert assessments place the net cost of removing CO2 with biochar between US$30 and $120 per tonne. Market data show that biochar supplied 94% of all durable CDR credits delivered in 2023, demonstrating current scalability.[198][199] Stratospheric aerosol injection (SAI), by comparison, could reduce global temperature quickly by dispersing sulfate aerosols in the stratosphere; however, deployment at climatically relevant scale would require the design and certification of a new fleet of high‑altitude aircraft, a process estimated to take a decade or more, and ongoing operating costs of about US$18 billion for each degree Celsius of cooling.[200] While models confirm that SAI would lower global mean temperature, there are potential side effect including ozone depletion, altered regional precipitation patterns, and the risk of a sudden "termination shock" warming if the programme were interrupted. These systemic risks are absent from biochar deployment.[201]
Bioenergy with carbon capture and storage (BECCS) expands on the potential of CCS and aims to lower atmospheric CO2 levels. This process uses biomass grown for bioenergy. The biomass yields energy in useful forms such as electricity, heat, biofuels, etc. through consumption of the biomass via combustion, fermentation, or pyrolysis. The process captures the CO2 that was extracted from the atmosphere when it grew. It then stores it underground or via land application as biochar. This effectively removes it from the atmosphere.[202] This makes BECCS a negative emissions technology (NET).[203]
Scientists estimated the potential range of negative emissions from BECCS in 2018 as 0–22Gt per year.[204]As of 2022[update], BECCS was capturing approximately 2 million tonnes per year of CO2 annually.[205] The cost and availability of biomass limits wide deployment of BECCS.[206][207]:10 BECCS currently forms a big part of achieving climate targets beyond 2050 in modelling, such as by the Integrated Assessment Models (IAMs) associated with the IPCC process. But many scientists are sceptical due to the risk of loss of biodiversity.[208]
Direct air capture is a process of capturing CO2 directly from the ambient air. This is in contrast to CCS which captures carbon from point sources. It generates a concentrated stream of CO2 for sequestration, utilisation or production of carbon-neutral fuel and windgas.[209] Artificial processes vary, and there are concerns about the long-term effects of some of these processes.[210][obsoletesource]
Taking into account direct and indirect emissions, industry is the sector with the highest share of global emissions.
2016 global greenhouse gas emissions by sector.[211] Percentages are calculated from estimated global emissions of all Kyoto Greenhouse Gases, converted to CO2 equivalent quantities (GtCO2e).
The building sector accounts for 23% of global energy-related CO2 emissions.[20]:141 About half of the energy is used for space and water heating.[212] Building insulation can reduce the primary energy demand significantly. Heat pump loads may also provide a flexible resource that can participate in demand response to integrate variable renewable resources into the grid.[213]Solar water heating uses thermal energy directly. Sufficiency measures include moving to smaller houses when the needs of households change, mixed use of spaces and the collective use of devices.[98]:71 Planners and civil engineers can construct new buildings using passive solar building design, low-energy building, or zero-energy building techniques. In addition, it is possible to design buildings that are more energy-efficient to cool by using lighter-coloured, more reflective materials in the development of urban areas.
Heat pumps efficiently heat buildings, and cool them by air conditioning. A modern heat pump typically transports around three to five times more thermal energy than electrical energy consumed. The amount depends on the coefficient of performance and the outside temperature.[214]
Refrigeration and air conditioning account for about 10% of global CO2 emissions caused by fossil fuel-based energy production and the use of fluorinated gases. Alternative cooling systems, such as passive cooling building design and passive daytime radiative cooling surfaces, can reduce air conditioning use. Suburbs and cities in hot and arid climates can significantly reduce energy consumption from cooling with daytime radiative cooling.[215]
Energy consumption for cooling is likely to rise significantly due to increasing heat and availability of devices in poorer countries. Of the 2.8 billion people living in the hottest parts of the world, only 8% currently have air conditioners, compared with 90% of people in the US and Japan.[216] Adoption of air conditioners typically increases in warmer areas at above $10,000 annual household income.[217] By combining energy efficiency improvements and decarbonising electricity for air conditioning with the transition away from super-polluting refrigerants, the world could avoid cumulative greenhouse gas emissions of up to 210–460 GtCO2-eq over the next four decades.[218] A shift to renewable energy in the cooling sector comes with two advantages: Solar energy production with mid-day peaks corresponds with the load required for cooling and additionally, cooling has a large potential for load management in the electric grid.[218]
Cities emitted 28GtCO2-eq in 2020 of combined CO2 and CH4 emissions.[98]:TS-61 This was from producing and consuming goods and services.[98]:TS-61 Climate-smart urban planning aims to reduce sprawl to reduce the distance travelled. This lowers emissions from transportation. Switching from cars by improving walkability and cycling infrastructure is beneficial to a country's economy as a whole.[220]
Urban forestry, lakes and other blue and green infrastructure can reduce emissions directly and indirectly by reducing energy demand for cooling.[98]:TS-66 Methane emissions from municipal solid waste can be reduced by segregation, composting, and recycling.[221]
Sales of electric vehicles (EVs) indicate a trend away from gas-powered vehicles that generate greenhouse gases.
Transportation accounts for 15% of emissions worldwide.[223] Increasing the use of public transport, low-carbon freight transport and cycling are important components of transport decarbonisation.[224][225]
Electric vehicles and environmentally friendly rail help to reduce the consumption of fossil fuels. In most cases, electric trains are more efficient than air transport and truck transport.[226] Other efficiency means include improved public transport, smart mobility, carsharing and electric hybrids. Fossil-fuel for passenger cars can be included in emissions trading.[227] Furthermore, moving away from a car-dominated transport system towards low-carbon advanced public transport system is important.[228]
Heavyweight, large personal vehicles (such as cars) require a lot of energy to move and take up much urban space.[229][230] Several alternatives modes of transport are available to replace these. The European Union has made smart mobility part of its European Green Deal.[231] In smart cities, smart mobility is also important.[232]
The World Bank is helping lower income countries buy electric buses. Their purchase price is higher than diesel buses. But lower running costs and health improvements due to cleaner air can offset this higher price.[233]
Between one quarter and three quarters of cars on the road by 2050 are forecast to be electric vehicles.[234]Hydrogen may be a solution for long-distance heavy freight trucks, if batteries alone are too heavy.[235]
In the shipping industry, the use of liquefied natural gas (LNG) as a marine bunker fuel is driven by emissions regulations. Ship operators must switch from heavy fuel oil to more expensive oil-based fuels, implement costly flue gas treatment technologies or switch to LNG engines.[236] Methane slip, when gas leaks unburned through the engine, lowers the advantages of LNG. Maersk, the world's biggest container shipping line and vessel operator, warns of stranded assets when investing in transitional fuels like LNG.[237] The company lists green ammonia as one of the preferred fuel types of the future. It has announced the first carbon-neutral vessel on the water by 2023, running on carbon-neutral methanol.[238] Cruise operators are trialling partially hydrogen-powered ships.[239]
Hybrid and all electric ferries are suitable for short distances. Norway's goal is an all electric fleet by 2025.[240]
Between 1940 and 2018, aviation CO2 emissions grew from 0.7% to 2.65% of all CO2 emissions.
Jet airliners contribute to climate change by emitting carbon dioxide, nitrogen oxides, contrails and particulates. Their radiative forcing is estimated at 1.3–1.4 that of CO2 alone, excluding induced cirrus cloud.In 2018, global commercial operations generated 2.4% of all CO2 emissions.[242]
The aviation industry has become more fuel efficient. But overall emissions have risen as the volume of air travel has increased. By 2020, aviation emissions were 70% higher than in 2005 and they could grow by 300% by 2050.[243]
Experts expect emissions from aviation to rise in most projections, at least until 2040. They currently amount to 180Mt of CO2 or 11% of transport emissions. Aviation biofuel and hydrogen can only cover a small proportion of flights in the coming years. Experts expect hybrid-driven aircraft to start commercial regional scheduled flights after 2030. Battery-powered aircraft are likely to enter the market after 2035.[244] Under CORSIA, flight operators can purchase carbon offsets to cover their emissions above 2019 levels. CORSIA will be compulsory from 2027.
Agriculture, forestry and land use
Greenhouse gas emissions across the supply chain for different foods, showing which type of food should be encouraged and which discouraged from a mitigation perspective
Almost 20% of greenhouse gas emissions come from the agriculture and forestry sector.[245] To significantly reduce these emissions, annual investments in the agriculture sector need to increase to $260 billion by 2030. The potential benefits from these investments are estimated at $4.3 trillion by 2030, offering a substantial economic return of 16-to-1.[246]:7–8
Mitigation measures in the food system can be divided into four categories. These are demand-side changes, ecosystem protections, mitigation on farms, and mitigation in supply chains. On the demand side, limiting food waste is an effective way to reduce food emissions. Changes to a diet less reliant on animal products such as plant-based diets are also effective.[15]:XXV
With 21% of global methane emissions, cattle are a major driver of global warming.[247]:6 When rainforests are cut and the land is converted for grazing, the impact is even higher. In Brazil, producing 1kg of beef can result in the emission of up to 335kg CO2-eq.[248] Increasing the milk yield of dairy cows has been shown to reduce emissions.[249] Other livestock, manure management and rice cultivation also emit greenhouse gases, in addition to fossil fuel combustion in agriculture.
Important mitigation options for reducing the greenhouse gas emissions from livestock include genetic selection,[250][251] introduction of methanotrophic bacteria into the rumen,[252][253] vaccines, feeds,[254] diet modification and grazing management.[255][256][257] Other options are diet changes towards ruminant-free alternatives, such as milk substitutes and meat analogues. Non-ruminant livestock, such as poultry, emit far fewer GHGs.[258]
It is possible to cut methane emissions in rice cultivation by improved water management, combining dry seeding and one drawdown, or executing a sequence of wetting and drying. This results in emission reductions of up to 90% compared to full flooding and even increased yields.[259]
Reducing the usage of nitrogen fertilizers through nutrient management could avoid nitrous oxide emissions equal to 2.77 - 11.48 gigatons of carbon dioxide from 2020 to 2050.[260]
Industry is the largest emitter of greenhouse gases when direct and indirect emissions are included. Electrification can reduce emissions from industry. Green hydrogen can play a major role in energy-intensive industries for which electricity is not an option. Further mitigation options involve the steel and cement industry, which can switch to a less polluting production process. Products can be made with less material to reduce emission-intensity and industrial processes can be made more efficient. Finally, circular economy measures reduce the need for new materials. This also saves on emissions that would have been released from the mining of collecting of those materials.[15]:43
The decarbonisation of cement production requires new technologies, and therefore investment in innovation.[261] Bioconcrete is one possibility to reduce emissions.[262] But no technology for mitigation is yet mature. So CCS will be necessary at least in the short-term.[263]
Another sector with a significant carbon footprint is the steel sector, which is responsible for about 7% of global emissions.[264] Emissions can be reduced by using electric arc furnaces to melt and recycle scrap steel. To produce virgin steel without emissions, blast furnaces could be replaced by hydrogen direct reduced iron and electric arc furnaces. Alternatively, carbon capture and storage solutions can be used.[264]
Coal, gas and oil production often come with significant methane leakage.[265] In the early 2020s some governments recognised the scale of the problem and introduced regulations.[266]Methane leaks at oil and gas wells and processing plants are cost-effective to fix in countries which can easily trade gas internationally.[265] There are leaks in countries where gas is cheap; such as Iran,[267] Russia,[268] and Turkmenistan.[269] Nearly all this can be stopped by replacing old components and preventing routine flaring.[265]Coalbed methane may continue leaking even after the mine has been closed. But it can be captured by drainage and/or ventilation systems.[270] Fossil fuel firms do not always have financial incentives to tackle methane leakage.[271]
Co-benefits
Co-benefits of climate change mitigation, also often referred to as ancillary benefits, were firstly dominated in the scientific literature by studies that describe how lower GHG emissions lead to better air quality and consequently impact human health positively.[272][273] The scope of co-benefits research expanded to its economic, social, ecological and political implications.
Positive secondary effects that occur from climate mitigation and adaptation measures have been mentioned in research since the 1990s.[274][275] The IPCC first mentioned the role of co-benefits in 2001, followed by its fourth and fifth assessment cycle stressing improved working environment, reduced waste, health benefits and reduced capital expenditures.[276] In the early 2000s the OECD was further fostering its efforts in promoting ancillary benefits.[277]
The IPCC pointed out in 2007: "Co-benefits of GHG mitigation can be an important decision criteria in analyses carried out by policy-makers, but they are often neglected" and added that the co-benefits are "not quantified, monetised or even identified by businesses and decision-makers".[278] Appropriate consideration of co-benefits can greatly "influence policy decisions concerning the timing and level of mitigation action", and there can be "significant advantages to the national economy and technical innovation".[278]
An analysis of climate action in the UK found that public health benefits are a major component of the total benefits derived from climate action.[279]
Co-benefits can positively impact employment, industrial development, states' energy independence and energy self-consumption. The deployment of renewable energies can foster job opportunities. Depending on the country and deployment scenario, replacing coal power plants with renewable energy can more than double the number of jobs per average MW capacity.[280] Investments in renewable energies, especially in solar- and wind energy, can boost the value of production.[281] Countries which rely on energy imports can enhance their energy independence and ensure supply security by deploying renewables. National energy generation from renewables lowers the demand for fossil fuel imports which scales up annual economic saving.[282]
The European Commission forecasts a shortage of 180,000 skilled workers in hydrogen production and 66,000 in solar photovoltaic power by 2030.[283]
Energy security
A higher share of renewables can additionally lead to more energy security.[284][285] Socioeconomic co-benefits have been analysed such as energy access in rural areas and improved rural livelihoods.[286][287] Rural areas which are not fully electrified can benefit from the deployment of renewable energies. Solar-powered mini-grids can remain economically viable, cost-competitive and reduce the number of power cuts. Energy reliability has additional social implications: stable electricity improves the quality of education.[288]
The International Energy Agency (IEA) spelled out the "multiple benefits approach" of energy efficiency while the International Renewable Energy Agency (IRENA) operationalised the list of co-benefits of the renewable energy sector.[289][290]
The health benefits from climate change mitigation are significant. Potential measures can not only mitigate future health impacts from climate change but also improve health directly.[291][292] Climate change mitigation is interconnected with various health co-benefits, such as those from reduced air pollution.[292] Air pollution generated by fossil fuel combustion is both a major driver of global warming and the cause of a large number of annual deaths. Some estimates are as high as 8.7 million excess deaths during 2018.[293][294] A 2023 study estimated that fossil fuels kill over 5 million people each year, as of 2019,[295] by causing diseases such as heart attack, stroke and chronic obstructive pulmonary disease.[296]Particulate air pollution kills by far the most, followed by ground-level ozone.[297]
Mitigation policies can also promote healthier diets such as less red meat, more active lifestyles, and increased exposure to green urban spaces.[298][299] Access to urban green spaces provides benefits to mental health as well.[298]:18 The increased use of green and blue infrastructure can reduce the urban heat island effect. This reduces heat stress on people.[98]:TS-66
Some mitigation measures have co-benefits in the area of climate change adaptation.[300]:8–63 This is for example the case for many nature-based solutions.[301]:4–94[302]:6 Examples in the urban context include urban green and blue infrastructure which provide mitigation as well as adaptation benefits. This can be in the form of urban forests and street trees, green roofs and walls, urban agriculture and so forth. The mitigation is achieved through the conservation and expansion of carbon sinks and reduced energy use of buildings. Adaptation benefits come for example through reduced heat stress and flooding risk.[300]:8–64
Emission trading and carbon taxes around the world (2019)
Mitigation measures can also have negative side effects and risks.[98]:TS-133 In agriculture and forestry, mitigation measures can affect biodiversity and ecosystem functioning.[98]:TS-87 In renewable energy, mining for metals and minerals can increase threats to conservation areas.[304] There is some research into ways to recycle solar panels and electronic waste. This would create a source for materials so there is no need to mine them.[305][306]
Scholars have found that discussions about risks and negative side effects of mitigation measures can lead to deadlock or the feeling that there are insuperable barriers to taking action.[306]
Several factors affect mitigation cost estimates. One is the baseline. This is a reference scenario that the alternative mitigation scenario is compared with. Others are the way costs are modelled, and assumptions about future government policy.[307]:622 Cost estimates for mitigation for specific regions depend on the quantity of emissions allowed for that region in future, as well as the timing of interventions.[308]:90
Mitigation costs will vary according to how and when emissions are cut. Early, well-planned action will minimise the costs.[153] Globally, the benefits of keeping warming under 2°C exceed the costs,[309] which according to The Economist are affordable.[310]
Economists estimate the cost of climate change mitigation at between 1% and 2% of GDP.[311][312] While this is a large sum, it is still far less than the subsidies governments provide to the fossil fuel industry. The International Monetary Fund estimated this at more than $5 trillion per year.[313][47]
Another estimate says that financial flows for climate mitigation and adaptation are going to be over $800 billion per year. These financial requirements are predicted to exceed $4 trillion per year by 2030.[314][315]
Globally, limiting warming to 2°C may result in higher economic benefits than economic costs.[316]:300 The economic repercussions of mitigation vary widely across regions and households, depending on policy design and level of international cooperation. Delayed global cooperation increases policy costs across regions, especially in those that are relatively carbon intensive at present. Pathways with uniform carbon values show higher mitigation costs in more carbon-intensive regions, in fossil-fuels exporting regions and in poorer regions. Aggregate quantifications expressed in GDP or monetary terms undervalue the economic effects on households in poorer countries. The actual effects on welfare and well-being are comparatively larger.[317]
Cost–benefit analysis may be unsuitable for analysing climate change mitigation as a whole. But it is still useful for analysing the difference between a 1.5°C target and 2°C.[311] One way of estimating the cost of reducing emissions is by considering the likely costs of potential technological and output changes. Policymakers can compare the marginal abatement costs of different methods to assess the cost and amount of possible abatement over time. The marginal abatement costs of the various measures will differ by country, by sector, and over time.[153]
It is possible to avoid some of the costs of the effects of climate change by limiting climate change. According to the Stern Review, inaction can be as high as the equivalent of losing at least 5% of global gross domestic product (GDP) each year, now and forever. This can be up to 20% of GDP or more when including a wider range of risks and impacts. But mitigating climate change will only cost about 2% of GDP. Also it may not be a good idea from a financial perspective to delay significant reductions in greenhouse gas emissions.[319][320]
Mitigation solutions are often evaluated in terms of costs and greenhouse gas reduction potentials. This fails to take into account the direct effects on human well-being.[321]
Distributing emissions abatement costs
Mitigation at the speed and scale required to limit warming to 2°C or below implies deep economic and structural changes. These raise multiple types of distributional concerns across regions, income classes and sectors.[317]
There have been different proposals on how to allocate responsibility for cutting emissions.[322]:103 These include egalitarianism, basic needs according to a minimum level of consumption, proportionality and the polluter-pays principle. A specific proposal is "equal per capita entitlements".[322]:106 This approach has two categories. In the first category, emissions are allocated according to national population. In the second category, emissions are allocated in a way that attempts to account for historical or cumulative emissions.
In order to reconcile economic development with mitigating carbon emissions, developing countries need particular support. This would be both financial and technical. The IPCC found that accelerated support would also tackle inequities in financial and economic vulnerability to climate change.[323] One way to achieve this is the Kyoto Protocol's Clean Development Mechanism (CDM).
Policies
National policies
Although China is the leading producer of CO2 emissions in the world with the U.S. second, per capita the U.S. leads China by a fair margin (data from 2017).
Climate change mitigation policies can have a large and complex impact on the socio-economic status of individuals and countries This can be both positive and negative.[324] It is important to design policies well and make them inclusive. Otherwise climate change mitigation measures can impose higher financial costs on poor households.[325]
An evaluation was conducted on 1,500 climate policy interventions made between 1998 and 2022.[326] The interventions took place in 41 countries and across 6 continents, which together contributed 81% of the world's total emissions as of 2019. The evaluation found 63 successful interventions that resulted in significant emission reductions; the total CO2 release averted by these interventions was between 0.6 and 1.8 billion metric tonnes. The study focused on interventions with at least 4.5% emission reductions, but the researchers noted that meeting the reductions required by the Paris Agreement would require 23 billion metric tonnes per year. Generally, carbon pricing was found to be most effective in developed countries, while regulation was most effective in the developing countries. Complementary policy mixes benefited from synergies, and were mostly found to be more effective interventions than the implementation of isolated policies.[327][328][329]
The OECD recognise 48 distinct climate mitigation policies suitable for implementation at national level. Broadly, these can be categorised into three types: market based instruments, non market based instruments and other policies.[330][326]
Other policies include the Establishing an Independent climate advisory body.[330]
Non market based policies include the Implementing or tighening of Regulatory standards. These set technology or performance standards. They can be effective in addressing the market failure of informational barriers.[331]:412
Among market based policies, the carbon price has been found to be the most effective (at least for developed economies),[326] and has its own section below. Additional market based policy instruments for climate change mitigation include:
Emissions taxes These often require domestic emitters to pay a fixed fee or tax for every tonne of CO2 emissions they release into the atmosphere.[331]:4123Methane emissions from fossil fuel extraction are also occasionally taxed.[332] But methane and nitrous oxide from agriculture are typically not subject to tax.[333] Removing unhelpful subsidies: Many countries provide subsidies for activities that affect emissions. For example, significant fossil fuel subsidies are present in many countries.[334]Phasing-out fossil fuel subsidies is crucial to address the climate crisis.[335] It must however be done carefully to avoid protests[336] and making poor people poorer.[337] Creating helpful subsidies: Creating subsidies and financial incentives.[338] One example is energy subsidies to support clean generation which is not yet commercially viable such as tidal power.[339] Tradable permits: A permit system can limit emissions.[331]:415
Carbon emission trade – allowance prices from 2008
Imposing additional costs on greenhouse gas emissions can make fossil fuels less competitive and accelerate investments into low-carbon sources of energy. A growing number of countries raise a fixed carbon tax or participate in dynamic carbon emission trading (ETS) systems. In 2021, more than 21% of global greenhouse gas emissions were covered by a carbon price. This was a big increase from earlier due to the introduction of the Chinese national carbon trading scheme.[340]:23
Trading schemes offer the possibility to limit emission allowances to certain reduction targets. However, an oversupply of allowances keeps most ETS at low price levels around $10 with a low impact. This includes the Chinese ETS which started with $7/tCO2 in 2021.[341] One exception is the European Union Emission Trading Scheme where prices began to rise in 2018. They reached about €80/tCO2 in 2022.[342] This results in additional costs of about €0.04/KWh for coal and €0.02/KWh for gas combustion for electricity, depending on the emission intensity.[343] Industries which have high energy requirements and high emissions often pay only very low energy taxes, or even none at all.[344]:11–80
While this is often part of national schemes, carbon offsets and credits can be part of a voluntary market as well such as on the international market. Notably, the company Blue Carbon of the UAE has bought ownership over an area equivalent to the United Kingdom to be preserved in return for carbon credits.[345]
International cooperation is considered a critical enabler for climate action[9]:52 while conflicts generally hamper it.[346] Almost all countries are parties to the United Nations Framework Convention on Climate Change (UNFCCC).[347][348] The ultimate objective of the UNFCCC is to stabilise atmospheric concentrations of greenhouse gases at a level that would prevent dangerous human interference with the climate system.[349]
Although not designed for this purpose, the Montreal Protocol has benefited climate change mitigation efforts.[350] The Montreal Protocol is an international treaty that has successfully reduced emissions of ozone-depleting substances such as CFCs. These are also greenhouse gases.
While international climate efforts have traditionally focused on demand-side policies like carbon taxes and emissions trading, a growing body of research explores supply-side treaties aimed at reducing the global output of fossil fuels. Proponents argue these treaties may be more cost-efficient and easier to monitor than demand-side agreements, potentially addressing issues like 'carbon leakage' and the 'green paradox'.[355] However, scholars note that because most major emitters are also major producers, supply-side treaties face similar challenges in participation and distributive conflict.[355]
Historically efforts to deal with climate change have taken place at a multinational level. They involve attempts to reach a consensus decision at the United Nations, under the United Nations Framework Convention on Climate Change (UNFCCC).[356] This is the dominant approach historically of engaging as many international governments as possible in taking action on a worldwide public issue. The Montreal Protocol in 1987 is a precedent that this approach can work. But some critics say the top-down framework of only utilising the UNFCCC consensus approach is ineffective. They put forward counter-proposals of bottom-up governance. At this same time this would lessen the emphasis on the UNFCCC.[357][358][359]
The Kyoto Protocol to the UNFCCC adopted in 1997 set out legally binding emission reduction commitments for the "Annex 1" countries.[360]:817 The Protocol defined three international policy instruments ("Flexibility Mechanisms") which could be used by the Annex 1 countries to meet their emission reduction commitments. According to Bashmakov, use of these instruments could significantly reduce the costs for Annex 1 countries in meeting their emission reduction commitments.[361]:402[needs update]
In 2015, the UNFCCC's "structured expert dialogue" came to the conclusion that, "in some regions and vulnerable ecosystems, high risks are projected even for warming above 1.5°C".[362] Together with the strong diplomatic voice of the poorest countries and the island nations in the Pacific, this expert finding was the driving force leading to the decision of the 2015 Paris Climate Conference to lay down this 1.5°C long-term target on top of the existing 2°C goal.[363]
A typology of discourses aimed at delaying climate change mitigationDistribution of committed CO2 emissions from developed fossil fuel reserves
There are individual, institutional and market barriers to achieving climate change mitigation.[99]:5–71 They differ for all the different mitigation options, regions and societies.
In order to decarbonise societies the state needs to play a predominant role. This is because it requires a massive coordination effort.[364]:213 This strong government role can only work well if there is social cohesion, political stability and trust.[364]:213
For land-based mitigation options, finance is a major barrier. Other barriers are cultural values, governance, accountability and institutional capacity.[129]:7–5
Developing countries face further barriers to mitigation.[365]
The cost of capital increased in the early 2020s.[366] A lack of available capital and finance is common in developing countries.[367] Together with the absence of regulatory standards, this barrier supports the proliferation of inefficient equipment.
There are also financial and capacity barrier in many of these countries.[99]:97
One study estimates that only 0.12% of all funding for climate-related research goes on the social science of climate change mitigation.[368] Vastly more funding goes on natural science studies of climate change. Considerable sums also go on studies of the impact of climate change and adaptation to it.[368]
Society and culture
Commitments to divest
More firms plan to invest in climate change mitigation, specifically focusing on low-carbon sectors.
The COVID-19 pandemic led some governments to shift their focus away from climate action, at least temporarily.[372] This obstacle to environmental policy efforts may have contributed to slowed investment in green energy technologies. The economic slowdown resulting from COVID-19 added to this effect.[373][374]
In 2020, carbon dioxide emissions fell by 6.4% or 2.3 billion tonnes globally.[375] Greenhouse gas emissions rebounded later in the pandemic as many countries began lifting restrictions. The direct impact of pandemic policies had a negligible long-term impact on climate change.[375][376]
Examples by country
Greenhouse gas emissions per person in the highest-emitting countries.[377] Though China has the greatest total annual carbon dioxide emissions, the U.S. and a few other high-emitting countries exceed China in per capita emissions.
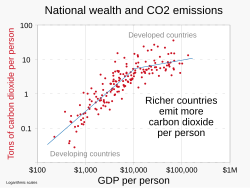
Richer (developed) countries emit more CO2 per person than poorer (developing) countries.[378] Emissions are roughly proportional to GDP per person, though the rate of increase diminishes with average GDP/pp of about $10,000.
While climate mitigation is often cast as a burden to be distributed in some or other way, it can also be seen as an opportunity for industrial development, exports, and status seeking for countries.[17] The examples and precedents that countries et may influence other countries to follow suit.[17]
In 2025, however, under the Trump administration, the Environmental Protection Agency (EPA) administrator Lee Zeldin proposed a rule to eliminate the reporting and measuring of carbon emissions by a vast majority of US industries, including fossil fuel producers and refiners.[385] The White House considers the GHGRP rollback as part of its plan to increase US oil and gas production.[386]
The European Commission estimates that an additional €477 million in annual investment is needed for the European Union to meet its Fit-for-55 decarbonisation goals.[283][389]
In the European Union, government-driven policies and the European Green Deal have helped position greentech (as an example) as a vital area for venture capital investment. By 2023, venture capital in the EU's greentech sector equalled that of the United States, reflecting a concerted effort to drive innovation and mitigate climate change through targeted financial support.[283][390] The European Green Deal has fostered policies that contributed to a 30% rise in venture capital for greentech companies in the EU from 2021 to 2023, despite a downturn in other sectors during the same period.[391]
While overall venture capital investment in the EU remains about six times lower than in the United States, the greentech sector has closed this gap significantly, attracting substantial funding. Key areas benefitting from increased investments are energy storage, circular economy initiatives, and agricultural technology. This is supported by the EU's ambitious goal to reduce greenhouse gas emissions by at least 55% by 2030.[391]
Related approaches
Relationship with solar radiation modification (SRM)
While solar radiation modification (SRM) could reduce surface temperatures, it temporarily masks climate change rather than addressing the root cause, which is greenhouse gases.[392]:14–56 SRM would work by altering how much solar radiation the Earth absorbs.[392]:14–56 Examples include reducing the amount of sunlight reaching the surface, reducing the optical thickness and lifetime of clouds, and changing the ability of the surface to reflect radiation.[393] The IPCC describes SRM as a climate risk reduction strategy or supplementary option rather than a climate mitigation option.[392]
The terminology in this area is still evolving. Experts sometimes use the term geoengineering or climate engineering in the scientific literature for both CDR or SRM, if the techniques are used at a global scale.[18]:6–11 IPCC reports no longer use the terms geoengineering or climate engineering.[19]
↑"4.2". Climate Change 2022: Mitigation of Climate Change(PDF) (Report). Intergovernmental Panel on Climate Change. 2022. Retrieved 3 May 2025. Transformative changes for the near term include rapid decarbonisation of the electricity sector and low‑carbon electrification of buildings, industry and transport.
↑Nadel, Steven (2019). "Electrification in the Transportation, Buildings, and Industrial Sectors: A Review of Opportunities, Barriers, and Policies". Current Sustainable/Renewable Energy Reports. 6 (4): 158–168. Bibcode:2019CSRER...6..158N. doi:10.1007/s40518-019-00138-z.
↑"It's critical to tackle coal emissions". blogs.worldbank.org. 8 October 2021. Retrieved 25 November 2022. Coal power plants produce a fifth of global greenhouse gas emissions – more than any other single source.
↑Franziska Funke; Linus Mattauch; Inge van den Bijgaart; H. Charles J. Godfray; Cameron Hepburn; David Klenert; Marco Springmann; Nicolas Treich (19 July 2022). "Toward Optimal Meat Pricing: Is It Time to Tax Meat Consumption?". Review of Environmental Economics and Policy. 16 (2): 000. Bibcode:2022RvEEP..16..219F. doi:10.1086/721078. S2CID250721559. animal-based agriculture and feed crop production account for approximately 83 percent of agricultural land globally and are responsible for approximately 67 percent of deforestation (Poore and Nemecek 2018). This makes livestock farming the single largest driver of greenhouse gas (GHG) emissions, nutrient pollution, and ecosystem loss in the agricultural sector. A failure to mitigate GHG emissions from the food system, especially animal-based agriculture, could prevent the world from meeting the climate objective of limiting global warming to 1.5°C, as set forth in the Paris Climate Agreement, and complicate the path to limiting climate change to well below 2°C of warming (Clark et al. 2020).
↑"Solar - Fuels & Technologies". IEA. Retrieved 22 December 2022. utility-scale solar PV is the least costly option for new electricity generation in a significant majority of countries worldwide
↑Whiting, G.T.T.; Mirletz, H.; O'Connor, T.; Barnes, T.; Agarwal, S. (2024-02-01). "The rise of renewables and fall of fossil fuel generation in the power sector of emerging economies". Renewable and Sustainable Energy Reviews. 191 114245. doi:10.1016/j.rser.2024.114245 (inactive 5 November 2025). ISSN1364-0321.{{cite journal}}: CS1 maint: DOI inactive as of November 2025 (link)
↑Carman, Jennifer; Goldberg, Matthew; Marlon, Jennifer; Wang, Xinran; Lacroix, Karine; Neyens, Liz; Leiserowitz, Anthony; Maibach, Edward; Rosenthal, Seth; Kotcher, John (Aug 3, 2021). "Americans' Actions to Limit and Prepare For Global Warming". Americans' Actions to Limit and Prepare for Global Warming, March 2021. March 2021.
↑Nielsen, K. S.; Cologna, V.; Bauer, J. M.; Berger, S.; Brick, C.; Dietz, T.; Hahnel, U. J. J.; Henn, L.; Lange, F.; Stern, P. C.; Wolske, K. S. (2024). "Realizing the full potential of behavioural science for climate change mitigation". Nature Climate Change. 14 (5): 322–330. Bibcode:2024NatCC..14..322N. doi:10.1038/s41558-024-01951-1.
↑Felix Creutzig, Joyashree Roy, and Jan Minx, "Demand-Side Climate Change Mitigation: Where Do We Stand and Where Do We Go?" Environmental Research Letters 19, no. 4 (2024): 040201. https://doi.org/10.1088/1748-9326/ad33d3
↑Boysen, Lena R.; Lucht, Wolfgang; Gerten, Dieter; Heck, Vera; Lenton, Timothy M.; Schellnhuber, Hans Joachim (17 May 2017). "The limits to global-warming mitigation by terrestrial carbon removal". Earth's Future. 5 (5): 463–474. Bibcode:2017EaFut...5..463B. doi:10.1002/2016EF000469. hdl:10871/31046. S2CID53062923.
↑"Carbon farming explained: the pros, the cons and the EU's plans". Clean Energy Wire. 17 March 2022. Retrieved 2 December 2022. But many German researchers and the country's agriculture ministry warn that soil carbon sequestration is easily reversible, hard to measure, and could lead to greenwashing. Existing frameworks for carbon farming certificates deploy a wide variety of approaches to quantifying the amount of carbon removals, the European Commission says.
↑Zhang, X.; Wang, Y.; Li, Z.; Chen, H. (2024). "Carbon sequestration potential of wetlands and regulating strategies: A review". Environmental Research. 238 117345. doi:10.1016/j.envres.2024.117345 (inactive 1 July 2025).{{cite journal}}: CS1 maint: DOI inactive as of July 2025 (link)
↑Synthesis of Adaptation Options for Coastal Areas. Climate Ready Estuaries Program, EPA 430-F-08-024. Washington, DC: US Environmental Protection Agency. 2009.
↑Tiwari, Shashank; Singh, Chhatarpal; Singh, Jay Shankar (2020). "Wetlands: A Major Natural Source Responsible for Methane Emission". In Upadhyay, Atul Kumar; Singh, Ranjan; Singh, D. P. (eds.). Restoration of Wetland Ecosystem: A Trajectory Towards a Sustainable Environment. Singapore: Springer. pp.59–74. doi:10.1007/978-981-13-7665-8_5. ISBN978-981-13-7665-8. S2CID198421761.
↑Harenda K.M., Lamentowicz M., Samson M., Chojnicki B.H. (2018) The Role of Peatlands and Their Carbon Storage Function in the Context of Climate Change. In: Zielinski T., Sagan I., Surosz W. (eds) Interdisciplinary Approaches for Sustainable Development Goals. GeoPlanet: Earth and Planetary Sciences. Springer, Cham. https://doi.org/10.1007/978-3-319-71788-3_12
↑Taillardat, Pierre; Thompson, Benjamin S.; Garneau, Michelle; Trottier, Karelle; Friess, Daniel A. (6 October 2020). "Climate change mitigation potential of wetlands and the cost-effectiveness of their restoration". Interface Focus. 10 (5) 20190129. doi:10.1098/rsfs.2019.0129. PMC7435041. PMID32832065. Analysis of wetland restoration costs relative to the amount of carbon they can sequester revealed that restoration is more cost-effective in coastal wetlands such as mangroves (US$1800 ton C−1) compared with inland wetlands (US$4200–49 200 ton C−1). We advise that for inland wetlands, priority should be given to conservation rather than restoration; while for coastal wetlands, both conservation and restoration may be effective techniques for climate change mitigation.
↑International Energy Agency (2017). Energy technology perspectives 2017: catalysing energy technology transformations. Paris: Organisation for Economic Co-operation and Development. ISBN978-92-64-27597-3. OCLC1144453104.
↑Parmar, N.R.; Nirmal Kumar, J.I.; Joshi, C.G. (2015). "Exploring diet-dependent shifts in methanogen and methanotroph diversity in the rumen of Mehsani buffalo by a metagenomics approach". Frontiers in Life Science. 8 (4): 371–378. doi:10.1080/21553769.2015.1063550. S2CID89217740.
↑Martin, C. et al. 2010. Methane mitigation in ruminants: from microbe to the farm scale. Animal 4: pp 351-365.
↑Eckard, R. J.; etal. (2010). "Options for the abatement of methane and nitrous oxide from ruminant production: A review". Livestock Science. 130 (1–3): 47–56. doi:10.1016/j.livsci.2010.02.010.
↑Pearce, David William (1992). The secondary benefits of greenhouse gas control. Centre for Social and Economic Research on the Global Environment. OCLC232159680.
↑Metz, Bert (2001). Climate change 2001: mitigation: contribution of Working Group III to the third assessment report of the Intergovernmental Panel on Climate Change. Cambridge University Press. ISBN0-521-80769-7. OCLC46640845.
↑Mondal, Md. Alam Hossain; Denich, Manfred; Vlek, Paul L.G. (December 2010). "The future choice of technologies and co-benefits of CO2 emission reduction in Bangladesh power sector". Energy. 35 (12): 4902–4909. Bibcode:2010Ene....35.4902M. doi:10.1016/j.energy.2010.08.037. ISSN0360-5442.
↑Chhatre, Ashwini; Lakhanpal, Shikha; Larson, Anne M; Nelson, Fred; Ojha, Hemant; Rao, Jagdeesh (December 2012). "Social safeguards and co-benefits in REDD+: a review of the adjacent possible". Current Opinion in Environmental Sustainability. 4 (6): 654–660. Bibcode:2012COES....4..654C. doi:10.1016/j.cosust.2012.08.006. ISSN1877-3435.
↑Economic viability and CO2 emissions of hydrogen production for ammonia synthesis: A comparative analysis across Europe. Alessandro Magnino, March 2025
This page is based on this Wikipedia article Text is available under the CC BY-SA 4.0 license; additional terms may apply. Images, videos and audio are available under their respective licenses.