Population growth is the increase in the number of people in a population or dispersed group. The global population has grown from 1 billion in 1800 to 8.2 billion in 2025.[3] Actual global human population growth amounts to around 70 million annually, or 0.85% per year. As of 2024, The United Nations projects that global population will peak in the mid-2080s at around 10.3 billion. The UN's estimates have decreased strongly in recent years due to sharp declines in global birth rates.[4] Others have challenged many recent population projections as having underestimated population growth.[5]
The world human population has been growing since the end of the Black Death, around the year 1350.[6] A mix of technological advancement that improved agricultural productivity[7] and sanitation and medical advancement that reduced mortality increased population growth. In some geographies, this has slowed through the process called the demographic transition, where many nations with high standards of living have seen a significant slowing of population growth. This is in direct contrast with less developed contexts, where population growth is still happening.[8] Globally, the rate of population growth has declined from a peak of 2.2% per year in 1963.[9]
*World Population Prospects 2017 (United Nations Population Division)
History
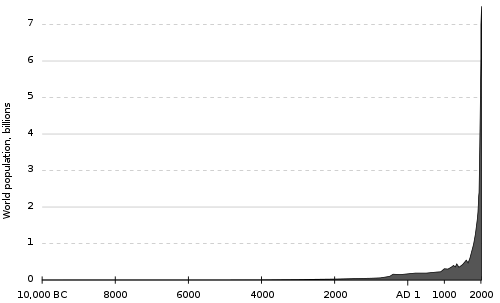
World human population estimates from 1800 to 2100, with estimated range of future population after 2020 based on "high" and "low" scenarios. Data from the United Nations projections in 2019.Estimated size of human population from 10,000 BCE to 2000 CE
Due to its dramatic impact on the human ability to grow food, the Haber process, named after one of its inventors, the German chemist Fritz Haber, served as the "detonator of the population explosion", enabling the global population to increase from 1.6 billion in 1900 to 7.7 billion by November 2019.[18]
Thomas McKeown hypotheses
Some of the reasons for the "Modern Rise of Population"[19] were particularly investigated by the British health scientist Thomas McKeown (1912–1988). In his publications, McKeown challenged four theories about the population growth:
McKeown stated that the growth in Western population, particularly surging in the 19th century, was not so much caused by an increase in fertility, but largely by a decline of mortality particularly of childhood mortality followed by infant mortality,[20][21]
The decline of mortality could largely be attributed to rising standards of living, whereby McKeown put most emphasis on improved nutritional status,
McKeown questioned the effectiveness of public health measures, including sanitary reforms, vaccination and quarantine,[22]
The "McKeown thesis" states that curative medicine measures played little role in mortality decline, not only prior to the mid-20th century[20] but also until well into the 20th century.[23]
Although the McKeown thesis has been heavily disputed, recent studies have confirmed the value of his ideas.[24] His work is pivotal for present day thinking about population growth, birth control, public health and medical care. McKeown had a major influence on many population researchers, such as health economists and Nobel prize winners Robert W. Fogel (1993) and Angus Deaton (2015). The latter considered McKeown as "the founder of social medicine".[25]
Growth rate models
The "population growth rate" is the rate at which the number of individuals in a population increases in a given time period, expressed as a fraction of the initial population. Specifically, population growth rate refers to the change in population over a unit time period, often expressed as a percentage of the number of individuals in the population at the beginning of that period. This can be written as the formula, valid for a sufficiently small time interval:
A positive growth rate indicates that the population is increasing, while a negative growth rate indicates that the population is decreasing. A growth ratio of zero indicates that there were the same number of individuals at the beginning and end of the period—a growth rate may be zero even when there are significant changes in the birth rates, death rates, immigration rates, and age distribution between the two times.[26]
A related measure is the net reproduction rate. In the absence of migration, a net reproduction rate of more than 1 indicates that the population of females is increasing, while a net reproduction rate less than one (sub-replacement fertility) indicates that the population of females is decreasing.
Most populations do not grow exponentially, rather they follow a logistic model. Once the population has reached its carrying capacity, it will stabilize and the exponential curve will level off towards the carrying capacity, which is usually when a population has depleted most its natural resources.[27] In the world human population, growth may be said to have been following a linear trend throughout the last few decades.[9]
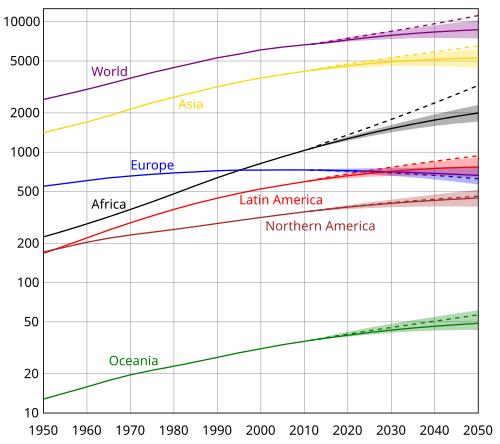
Estimates of population evolution in different continents between 1950 and 2050 according to the United Nations. The vertical axis is logarithmic and is in millions of people. (2011)World population growth rates between 1950 and 2050
The world population growth rate peaked in 1963 at 2.2% per year and subsequently declined.[9] In 2017, the estimated annual growth rate was 1.1%.[29] The CIA World Factbook gives the world annual birthrate, mortality rate, and growth rate as 1.86%, 0.78%, and 1.08% respectively.[30] The last 100years have seen a massive fourfold increase in the population, due to medical advances, lower mortality rates, and an increase in agricultural productivity made possible by the Green Revolution.[31]
The annual increase in the number of living humans peaked at 88.0million in 1989, then slowly declined to 73.9million in 2003, after which it rose again to 75.2million in 2006. In 2017, the human population increased by 83million.[29] Generally, developed nations have seen a decline in their growth rates in recent decades, though annual growth rates remain above 2% in some countries of the Middle East and Sub-Saharan Africa, and also in South Asia, Southeast Asia, and Latin America.[32]
The United Nations Population Division projects world population to reach 11.2billion by the end of the 21st century. The Institute for Health Metrics and Evaluation projects that the global population will peak in 2064 at 9.73 billion and decline to 8.89 billion in 2100. [35] A 2014 study in Science concludes that the global population will reach 11 billion by 2100, with a 70% chance of continued growth into the 22nd century.[36][37] The German Foundation for World Population reported in December 2019 that the global human population grows by 2.6 people every second, and could reach 8 billion by 2023.[38][39]
The majority of world population growth today is occurring in less developed countries.
According to United Nations population statistics, the world population grew by 30%, or 1.6billion humans, between 1990 and 2010.[40] In number of people the increase was highest in India (350million) and China (196million). Population growth rate was among highest in the United Arab Emirates (315%) and Qatar (271%).[40]
Growth rates of the world's most populous countries
Many of the world's countries, including many in Sub-Saharan Africa, the Middle East, South Asia and South East Asia, have seen a sharp rise in population since the end of the Cold War. The fear is that high population numbers are putting further strain on natural resources, food supplies, fuel supplies, employment, housing, etc. in some of the less fortunate countries. For example, the population of Chad has ultimately grown from 6,279,921 in 1993 to 10,329,208 in 2009,[42] further straining its resources. Vietnam, Mexico, Nigeria, Egypt, Ethiopia, and the DRC are witnessing a similar growth in population.
The following table gives some example countries or territories:
Human population projections are attempts to extrapolate how human populations will change in the future.[100] These projections are an important input to forecasts of the population's impact on this planet and humanity's future well-being.[101] Models of population growth take trends in human development and apply projections into the future.[102] These models use trend-based-assumptions about how populations will respond to economic, social and technological forces to understand how they will affect fertility and mortality, and thus population growth.[102]
↑Stokstad, Erik (5 May 2019). "Landmark analysis documents the alarming global decline of nature". Science. AAAS. Retrieved 20 October 2022. Driving these threats are the growing human population, which has doubled since 1970 to 7.6 billion, and consumption. (Per capita of use of materials is up 15% over the past 5 decades.)
↑United Nations Environment Programme (2021). Making Peace with Nature: A scientific blueprint to tackle the climate, biodiversity and pollution emergencies. Nairobi. https://www.unep.org/resources/making-peace-nature
↑Armelagos, George J., Alan H. Goodman, and Kenneth H. Jacobs. "The origins of agriculture: Population growth during a period of declining health." Population and Environment 13.1 (1991): 9-22.
↑McKeown, Thomas (1976). The Modern Rise of Population. London, UK: Edward Arnold. ISBN978-0-7131-5986-8.
12McKeown T, Brown RG (1955). "Medical evidence related to English population changes in the eighteenth century". Population Studies. 9 (2): 119–141. doi:10.1080/00324728.1955.10404688. JSTOR2172162.
↑McKeown T, Record RG (1962). "Reasons for the Decline of Mortality in England and Wales during the Nineteenth Century". Population Studies. 16 (2): 94–122. doi:10.2307/2173119. JSTOR2173119.
↑McKeown T, Record RG, Turner RD (1975). "An Interpretation of the Decline of Mortality in England and Wales during the Twentieth Century". Population Studies. 29 (3): 391–422. doi:10.1080/00324728.1975.10412707. JSTOR2173935. PMID11630508.
↑Deaton, Angus (2013). The Great Escape. Health, wealth, and the origins of inequality. Princeton and Oxford: Princeton University Press. pp.91–93. ISBN978-0-691-15354-4. McKeown's views, updated to modern circumstances, are still important today in debates between those who think that health is primarily determined by medical discoveries and medical treatment and those who look to the background social conditions of life.
123456789"World Population Prospects: The 2008 Revision: Selected Tables: Annex Tables"(PDF). United Nations. 2009. Table A.1. Total Population by Sex in 2009 and Sex Ratio by Country in 2009. Retrieved 12 March 2009. NB: The preliminary results of the National population census in Guinea-Bissau put the figure at 1,449,230, according to email information by the Instituto Nacional de Estudos e Pesquisa, Bissau.
↑"Population clock". Australian Bureau of Statistics website. Commonwealth of Australia. Retrieved 12 April 2011. The population estimate shown is automatically calculated daily at 00:00 UTC and is based on data obtained from the population clock on the date shown in the citation.
This page is based on this Wikipedia article Text is available under the CC BY-SA 4.0 license; additional terms may apply. Images, videos and audio are available under their respective licenses.