Population pyramid

Last updated
Population distribution by age and sex for Angola in 2005 Angola population pyramid 2005.svg
Population distribution by age and sex for Angola in 2005

A population pyramid (age structure diagram) or "age-sex pyramid" is a graphical illustration of the distribution of a population (typically that of a country or region of the world) by age groups and sex; it typically takes the shape of a pyramid when the population is growing. [1] Males are usually shown on the left and females on the right, and they may be measured in absolute numbers or as a percentage of the total population. The pyramid can be used to visualize the age of a particular population. [2] It is also used in ecology to determine the overall age distribution of a population; an indication of the reproductive capabilities and likelihood of the continuation of a species. Number of people per unit area of land is called population density.

Contents

Structure

A population pyramid often contains continuous stacked-histogram bars, making it a horizontal bar diagram. The population size is shown on the x-axis (horizontal) while the age-groups are represented on the y-axis (vertical). [3] The size of each bar can be displayed either as a percentage of the total population or as a raw number. Males are conventionally shown on the left and females on the right. Population pyramids are often viewed as the most effective way to graphically depict the age and distribution of a population, partly because of the very clear image these pyramids provide. [4] A great deal of information about the population broken down by age and sex can be read from a population pyramid, and this can shed light on the extent of development and other aspects of the population.

The measures of central tendency (mean, median, and mode) should be considered when assessing a population pyramid. For example, the average age could be used to determine the type of population in a particular region. A population with an average age of 15 would be very young compared to one with an average age of 55. Population statistics are often mid-year numbers.

A series of population pyramids could give a clear picture of how a country transitions from high to low fertility rates. If the pyramid has a broad base, this indicates that a relatively high proportion of the population lies in the youngest age band, such as ages 0–14, which suggests that the fertility rate of the country is high and above replacement fertility level. [5] If a population is below replacement fertility level, the older population is declining with age, due to a combination of mortality and an increase in the number of births over time. There are usually more females than males in the older age ranges since women have a greater life expectancy, for a variety of reasons including women partaking less in risky behaviors.

The shape of the pyramid can also reveal the age-dependency ratio of a population. Populations with a high proportion of children and/or of elderly people have a higher dependency ratio. This ratio refers to how many old and young people are dependent on the working-age groups (often defined as ages 15–64). According to Weeks' Population: an Introduction to Concepts and Issues, population pyramids can be used to predict the future, known as a population forecast. Population momentum, when a population's birth rates continue to increase even after fertility rate has declined to replacement level, can even be predicted if a population has a low mortality rate since the population will continue to grow. This then brings up the term doubling time, which is used to predict when the population will double in size. Lastly, a population pyramid can even give insight into the economic status of a country from the age stratification since the distribution of supplies is not evenly distributed through a population.

Demographic transition

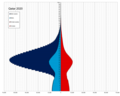
The development and transition of Switzerland's population pyramid over 2 centuries
Switzerland population pyramid in 1900.svg
1900
Switzerland population pyramid in 2000.svg
2000
Switzerland population pyramid in 2100.svg
2100

In the demographic transition model, the size and shape of population pyramids vary. In stage one of the demographic transition model, the pyramids have the most defined shape. They have the ideal big base and a skinny top. In stage two, the pyramid looks similar but starts to widen in the middle age groups. In stage three, the pyramids start to round out and look similar in shape to a tombstone. In stage four, there is a decrease in the younger age groups. This causes the base of the widened pyramid to narrow. Lastly, in stage five, the pyramid starts to take on the shape of a kite as the base continues to decrease. The shape of the population is dependent upon what the economy is like in the country. More developed countries can be found in stages three, four, and five, while the least developed countries have a population represented by the pyramids in stages one and two.

Types

Population age pyramid of Nigeria in 2020, similar to all of sub-Saharan Africa Nigeria single age population pyramid 2020.png
Population age pyramid of Nigeria in 2020, similar to all of sub-Saharan Africa

Each country will have a different population pyramid. However, population pyramids can be categorised into three types: stationary, expansive, or constrictive. These types have been identified by the fertility and mortality rates of a country. [6]

"Stationary" pyramid or constant population pyramid
A pyramid can be described as stationary if the percentages of population (age and sex) remain approximately constant over time. [7] In a stationary population, the numbers of births and death roughly balance one another.
"Expansive" pyramid or Expanding population pyramid
A population pyramid that is very wide at the younger ages, characteristic of countries with a high birth rate and perhaps low life expectancy therefore leading to high death rate. [6] The population is said to be fast-growing, and the size of each birth cohort increases each year. [8]
"Constrictive" pyramid or Declining population
A population pyramid that is narrowed at the bottom. The population is generally older on average, as the country has long life expectancy, a low death rate, but also a low birth rate. [6] This may suggest that in future there may be a high dependency ratio due to reducing numbers at working ages. This is a typical pattern for a very developed country, with a high level of education, easy access to and incentive to use birth control, good health care, and few negative environmental factors. [9]

Youth bulge

Median age by country. A youth bulge is evident for Africa, and to a lesser extent for West Asia, South Asia, Southeast Asia and Central America. 2017 world map, median age by country.svg
Median age by country. A youth bulge is evident for Africa, and to a lesser extent for West Asia, South Asia, Southeast Asia and Central America.
Map of countries by fertility rate (2020), according to the Population Reference Bureau Total Fertility Rate Map by Country.svg
Map of countries by fertility rate (2020), according to the Population Reference Bureau

Gary Fuller (1995) described a youth bulge as a type of expansive pyramid. Gunnar Heinsohn (2003) argues that an excess in especially young adult male population predictably leads to social unrest, war, and terrorism, as the "third and fourth sons" that find no prestigious positions in their existing societies rationalize their impetus to compete by religion or political ideology.

Heinsohn claims that most historical periods of social unrest lacking external triggers (such as rapid climatic changes or other catastrophic changes of the environment) and most genocides can be readily explained as a result of a built-up youth bulge. [10] This factor has been also used to account for the Arab Spring events and the rise of extremist populism in the 2010s. [11] Economic recessions, such as the Great Depression of the 1930s and the late 2000s Great Recession, are also claimed to be explained in part due to a large youth population who cannot find jobs. [11] Youth bulge can be seen as one factor among many in explaining social unrest and uprisings in society. [12] A 2016 study finds that youth bulges increase the chances of non-ethnic civil wars, but not ethnic civil wars. [13]

A large population of adolescents entering the labor force and electorate strains at the seams of the economy and polity, which were designed for smaller populations. This creates unemployment and alienation unless new opportunities are created quickly enough – in which case a 'demographic dividend' accrues because productive workers outweigh young and elderly dependents. Yet the 16–29 age range is associated with risk-taking, especially among males. In general, youth bulges in developing countries are associated with higher unemployment and, as a result, a heightened risk of violence and political instability. [14] [15] For Cincotta and Doces (2011), the transition to more mature age structures is almost a sine qua non for democratization. [16]

To reverse the effects of youth bulges, specific policies such as creating more jobs, improving family planning programs, and reducing over all infant mortality rates should be a priority. [17]

Middle East and North Africa

The Middle East and North Africa are currently experiencing a prominent youth bulge. "Across the Middle East, countries have experienced a pronounced increase in the size of their youth populations over recent decades, both in total numbers and as a percentage of the total population. Today, the nearly 111 million individuals aging between 15 to 29 living across the region make up nearly 27 percent of the region's population." [18] Structural changes in service provision, especially health care, beginning in the 1960s created the conditions for a demographic explosion, which has resulted in a population consisting primarily of younger people. It is estimated that around 65% of the regional population is under the age of 25. [19]

The youth bulge in the Middle East and North Africa has been favorably compared to that of East Asia, which harnessed this human capital and saw huge economic growth in recent decades. [20] The youth bulge has been referred to by the Middle East Youth Initiative as a demographic gift, which, if engaged, could fuel regional economic growth and development. [21] "While the growth of the youth population imposes supply pressures on education systems and labor markets, it also means that a growing share of the overall population is made up of those considered to be of working age; and thus not dependent on the economic activity of others. In turn, this declining dependency ratio can have a positive impact on overall economic growth, creating a demographic dividend. The ability of a particular economy to harness this dividend, however, is dependent on its ability to ensure the deployment of this growing working-age population towards productive economic activity, and to create the jobs necessary for the growing labor force." [18]

See also

Related Research Articles

<span class="mw-page-title-main">Demographics of Burundi</span>

Demographic features of the population of Burundi include population density, ethnicity, education level, health of the populace, economic status, religious affiliations and other aspects.

<span class="mw-page-title-main">Demographics of North Korea</span>

The demographics of North Korea are determined through national censuses and international estimates. The Central Bureau of Statistics of North Korea conducted the most recent census in 2008, where the population reached 24 million inhabitants. The population density is 199.54 inhabitants per square kilometre, and the 2014 estimated life expectancy is 69.81 years. In 1980, the population rose at a near consistent, but low, rate. Since 2000, North Korea's birth rate has exceeded its death rate; the natural growth is positive. In terms of age structure, the population is dominated by the 15–64-year-old segment (68.09%). The median age of the population is 32.9 years, and the gender ratio is 0.95 males to 1.00 female. Since the early 1990s, the birth rate has been fairly stable, with an average of 2 children per woman, down from an average of 3 in the early 1980s.

<span class="mw-page-title-main">Demography of the United Kingdom</span>

The population of the United Kingdom was estimated at over 67.0 million in 2020. It is the 21st most populated country in the world and has a population density of 270 people per square kilometre, with England having significantly greater density than Wales, Scotland, and Northern Ireland. Almost a third of the population lives in south east England, which is predominantly urban and suburban, with about 9 million in the capital city, London, whose population density is just over 5,200 per square kilometre.

<span class="mw-page-title-main">Demography</span> Science that deals with populations and their structures, statistically and theoretically

Demography, also known as Demographics, is the statistical study of populations, especially human beings.

<span class="mw-page-title-main">Demographics of the Gambia</span> Demographics of the West African country

The demographic characteristics of the population of The Gambia are known through national censuses, conducted in ten-year intervals and analyzed by The Gambian Bureau of Statistics (GBOS) since 1963. The latest census was conducted in 2013. The population of The Gambia at the 2013 census was 1.8 million. The population density is 176.1 per square kilometer, and the overall life expectancy in The Gambia is 64.1 years. Since the first census of 1963, the population of The Gambia has increased every ten years by an average of 43.2 percent. Since 1950s, the birth rate has constantly exceeded the death rate; the natural growth rate is positive. The Gambia is in the second stage of demographic transition. In terms of age structure, The Gambia is dominated by 15- to 24-year-old segment (57.6%). The median age of the population is 19.9 years, and the gender ratio of the total population is 0.98 males per female.

In demography, demographic transition is a phenomenon and theory which refers to the historical shift from high birth rates and high death rates in societies with minimal technology, education and economic development, to low birth rates and low death rates in societies with advanced technology, education and economic development, as well as the stages between these two scenarios. In economic growth, the demographic transition has swept the world over the past two centuries,and the unprecedented population growth of the post-Malthusian period was reversed, reducing birth rates and population growth significantly in all regions of the world, and enabling economies to translate more of the gains of factor accumulation and technological progress into per capita income growth. The demographic transition strengthens economic growth process by three changes: (i) reduced dilution of capital and land stock, (ii) increased investment in human capital, and (iii) increased size of the labor force relative to the total population and changed age population distribution. Although this shift has occurred in many industrialized countries, the theory and model are frequently imprecise when applied to individual countries due to specific social, political and economic factors affecting particular populations.

Zero population growth, sometimes abbreviated ZPG, is a condition of demographic balance where the number of people in a specified population neither grows nor declines; that is, the number of births plus in-migrants equals the number of deaths plus out-migrants. ZPG has been a prominent political movement since the 1960s.

<span class="mw-page-title-main">Dependency ratio</span> Age-population ratio of those in the labor force to those not in the labor force

The dependency ratio is an age-population ratio of those typically not in the labor force and those typically in the labor force. It is used to measure the pressure on the productive population.

<span class="mw-page-title-main">Total fertility rate</span> Number of children a woman is expected to have barring select circumstances

The total fertility rate (TFR) of a population is the average number of children that would be born to a female over their lifetime if:

  1. they were to experience the exact current age-specific fertility rates (ASFRs) through their lifetime
  2. they were to live from birth until the end of their reproductive life.

Population decline, also known as depopulation, is a reduction in a human population size. Throughout history, Earth's total human population has continued to grow; however, current projections suggest that this long-term trend of steady population growth may be coming to an end.

Population momentum is a consequence of the demographic transition. Population momentum explains why a population will continue to grow even if the fertility rate declines. Population momentum occurs because it is not only the number of children per woman that determine population growth, but also the number of women in reproductive age. Eventually, when the fertility rate reaches the replacement rate and the population size of women in the reproductive age bracket stabilizes, the population achieves equilibrium and population momentum comes to an end. Population momentum is defined as the ratio of the size of the population at that new equilibrium level to the size of the initial population. Population momentum usually occurs in populations that are growing.

<span class="mw-page-title-main">Demographic window</span>

The Demographic Window is defined to be that period of time in a nation's demographic evolution when the proportion of population of working age group is particularly prominent. This occurs when the demographic architecture of a population becomes younger and the percentage of people able to work reaches its height. Typically, the demographic window of opportunity lasts for 30–40 years depending upon the country. Because of the mechanical link between fertility levels and age structures, the timing and duration of this period is closely associated to those of fertility decline: when birth rates fall, the age pyramid first shrinks with gradually lower proportions of young population and the dependency ratio decreases as is happening in various parts of East Asia over several decades. After a few decades, low fertility however causes the population to get older and the growing proportion of elderly people inflates again the dependency ratio as is observed in present-day Europe.

<span class="mw-page-title-main">Epidemiological transition</span>

In demography and medical geography, epidemiological transition is a theory which "describes changing population patterns in terms of fertility, life expectancy, mortality, and leading causes of death." For example, a phase of development marked by a sudden increase in population growth rates brought by improved food security and innovations in public health and medicine, can be followed by a re-leveling of population growth due to subsequent declines in fertility rates. Such a transition can account for the replacement of infectious diseases by chronic diseases over time due to increased life span as a result of improved health care and disease prevention. This theory was originally posited by Abdel Omran in 1971.

Demographic dividend, as defined by the United Nations Population Fund (UNFPA), is "the economic growth potential that can result from shifts in a population’s age structure, mainly when the share of the working-age population is larger than the non-working-age share of the population ". In other words, it is “a boost in economic productivity that occurs when there are growing numbers of people in the workforce relative to the number of dependents”. UNFPA stated that “A country with both increasing numbers of young people and declining fertility has the potential to reap a demographic dividend."

<span class="mw-page-title-main">Demographics of Taiwan</span>

The population of Taiwan is approximately 23.35 million as of April 2023.

Population change is simply the change in the number of people in a specified area during a specific time period. Demographics is the study of population statistics, their variation and its causes. These statistics include birth rates, death rates, migration rates and sex ratios. All of these statistics are investigated by censuses and surveys conducted over a period of time. Some demographic information can also be obtained from historical maps, and aerial photographs.

<span class="mw-page-title-main">Ageing of Europe</span> Overview of ageing in Europe

The ageing of Europe, also known as the greying of Europe, is a demographic phenomenon in Europe characterised by a decrease in fertility, a decrease in mortality rate, and a higher life expectancy among European populations. Low birth rates and higher life expectancy contribute to the transformation of Europe's population pyramid shape. The most significant change is the transition towards a much older population structure, resulting in a decrease in the proportion of the working age while the number of the retired population increases. The total number of the older population is projected to increase greatly within the coming decades, with rising proportions of the post-war baby-boom generations reaching retirement. This will cause a high burden on the working age population as they provide for the increasing number of the older population.

Political demography is the study of the relationship between politics and population change. Population change is driven by classic demographic mechanisms – birth, death, age structure, and migration.

The societal effects of negligible senescence considers a scenario where negligible senescence is achieved on a societal wide level in humans. There is much controversy about the realistic timeline of such a scenario. The predictions vary in time starting from 2037 till later than the 21st century. The effects of negligible senescence has a profound impact on economy, climate, demographics and impacts social structures. The baseline scenario ceteris paribus of negligible senescence is more population growth while a larger healthier labor force would spur economic growth.

<span class="mw-page-title-main">Ageing of the United Kingdom</span> Ageing of the United Kingdom

The population of the United Kingdom is getting increasingly older, due to longer life expectancy and a sub-replacement fertility rate for little under 50 years. The society is expected to change as a result culturally and economically. By 2050, 1 in every 4 people is expected to be above the age of 65 and this will be more extreme in certain areas of the country.

References

Citations

  1. "Population Pyramids of the World from 1950 to 2100". PopulationPyramid.net. Retrieved 21 April 2018.
  2. Weeks, John (2001). Population An introduction to concepts and issues. Wadsworth. p. 307.
  3. "population pyramid | sociology". Encyclopædia Britannica. Retrieved 2017-03-29.
  4. Department of Health Home Archived 2009-08-30 at the Wayback Machine
  5. "From Population Pyramids to Pillars". www.prb.org. Retrieved 2017-03-29.
  6. 1 2 3 Population Pyramids - Oregon State University
  7. Weeks, John (2011). Population An Introduction to concepts and issues. Wadsworth. p. 309. ISBN   978-1305094505.
  8. Korenjak-Cˇ erne, Kejžar, Batagelj (2008). "Clustering of Population Pyramids". Informatica. 32.{{cite journal}}: CS1 maint: multiple names: authors list (link)
  9. Boucher, Lauren (10 March 2016). "What are the different types of population pyramids?". www.populationeducation.org. Retrieved 29 March 2017.
  10. "Why a two-state solution doesn't guarantee peace in the Middle East". Washington Examiner. Retrieved 2017-04-05.
  11. 1 2 Korotayev A. et al.A Trap At The Escape From The Trap? Demographic-Structural Factors of Political Instability in Modern Africa and West Asia. Cliodynamics 2/2 (2011): 1-28.
  12. "The Effects of 'Youth Bulge' on Civil Conflicts". Archived from the original on 27 May 2013. Retrieved 21 April 2018.
  13. Yair, Omer; Miodownik, Dan (2016-02-01). "Youth bulge and civil war: Why a country's share of young adults explains only non-ethnic wars". Conflict Management and Peace Science. 33 (1): 25–44. doi:10.1177/0738894214544613. ISSN   0738-8942. S2CID   144349983.
  14. Huntington, Samuel P. 1996. The Clash of Civilizations and the Remaking of World Order. New York, NY: Simon and Schuster
  15. Urdal, Henrik. 2006. "A Clash of Generations? Youth Bulges and Political Violence." International Studies Quarterly 50:607-29 doi : 10.1111/j.1468-2478.2006.00416.x
  16. Cincotta, Richard, and John Doces. 2011. "The Age-structural Maturity Thesis: The Youth Bulge's Influence on the Advent and Stability of Liberal Democracy?" In Political Demography: identity, conflict and institutions ed. J. A. Goldstone, E. Kaufmann and M. Toft. Boulder, CO: Paradigm Press Archived 2017-02-26 at the Wayback Machine
  17. "The Effects of 'Youth Bulge' on Civil Conflicts". Council on Foreign Relations. Retrieved 2017-04-05.
  18. 1 2 Hassan, Islam; Dyer, Paul (2017). "The State of Middle Eastern Youth" (PDF). The Muslim World. 107 (1): 3–12. doi:10.1111/muwo.12175.
  19. "Middle East Youth Initiative". Middle East Youth Initiative. Retrieved 21 April 2018.
  20. "Youth – An Undervalued Asset: Towards a New Agenda in the Middle East and North Africa, Progress, Challenges and Way Forward," Middle East and North Africa Region Human Development Department (MNSHD), The World Bank, 2007" (PDF). Archived from the original (PDF) on 19 January 2012. Retrieved 27 October 2011.
  21. "Middle East Youth Initiative: About: Why Shabab?" . Retrieved 27 October 2011.

Additional references