High, medium, and low projections of the future human world population
In world demographics, the world population is the total number of humans currently alive. It was estimated by the United Nations to have exceeded 8 billion (8,000,000,000) on November 15, 2022. It took around 300,000 years of human prehistory and history for the human population to reach a billion and only 218 more years from there to reach 8 billion. As of 2026, the world population is approximately 8.3 billion.[2]
The human population experienced continuous growth following the Great Famine of 1315–1317 and the end of the Black Death in 1350, when it had reached nearly 370 million.[3] The highest global population growth rates, with increases of over 1.8% per year, occurred between 1955 and 1975, peaking at 2.1% between 1965 and 1970.[4] The growth rate declined to 1.1% between 2015 and 2020 and is projected to decline further in the 21st century.[5] The global population is still increasing, but there is significant uncertainty about its long-term trajectory due to changing fertility and mortality rates.[6] The UN Department of Economics and Social Affairs (UNDESA) has projected the world population to reach between 9 and 10 billion people by 2050, providing an 80% confidence interval of 10–12 billion by the end of the 21st century,[1] with a growth rate by then of zero. However, other demographers predict that the human population may begin to decline in the second half of the 21st century if global fertility rates continue to fall.[7]
The total number of births globally, as of 2024, is approximately 132 million/year, which is projected to peak during the period 2040–2045 at 141 million/year and then decline slowly to 126 million/year by 2100.[8] The total number of deaths is currently 63 million/year and is projected to grow steadily to 122 million/year by 2100.[9]
Visual comparison of the world population in past and present
Estimates of world population by their nature are an aspect of modernity, possible only since the Age of Discovery. Early estimates for the population of the world[11] date to the 17th century: William Petty, in 1682, estimated the world population at 320 million (current estimates ranging close to twice this number); by the late 18th century, estimates ranged close to one billion (consistent with current estimates).[12] More refined estimates, broken down by continents, were published in the first half of the 19th century, at 600 million to 1 billion in the early 1800s and 800 million to 1 billion in the 1840s.[13]
It is difficult for estimates to be better than rough approximations, as even current population estimates are fraught with uncertainties from 3% to 5%.[14]
Prehistoric patterns
The history of the world's population involves a great deal of speculation. Before 9000 BC, virtually all humans were hunter-gatherers living in small bands that usually verged on the edge of extinction. Survival depended on the capture of hunted animals; if supply of animals dwindled for any reason, humans would starve; if the human population grew too large the number of surviving animals would shrink, leading to starvation the next year for the hunters (humans had not yet invented the technique of domesticating and herding animals). The hunting cultures sometimes fished, and usually gathered wild seeds and nuts, but they did not plant or grow vegetables or any other crops. One very rough estimate is 8 million hunters lived circa 9000 BC when the first of several "agricultural revolutions" occurred in the eastern hemisphere (the dates are very conjectural). Around the year 9000 BC in the Middle East, for reasons unknown, some groups began to domesticate and graze sheep. The practice of cultivating plants was invented independently in three places: in the Middle East and Europe (wheat, 6500–3500 BC), in Southeast Asia (rice, 6800–4000 BC), and in Central America and Peru (corn, about 2500 BC).[15]
Agriculture provided a steady food supply that could be stored for a year or longer in order to minimize the risk of famine. Farm production could be expanded by systematic human exertion. The new technology of farming meant that the food supply was proportional to the number of workers who could plant and harvest the crops. Every new pair of hands meant more food for the community, so children were valued in agricultural societies. Later, additional workers found useful work in building irrigation canals and systems that provided a stable water supply for crops, especially in Egypt, Mesopotamia, India, China, Peru and Mexico. The population could now grow because new people paid their own way. (It would take many centuries before the arable land supply became a limiting factor.) However, death rates were high, especially for infants and children, so even with high birth rates growth was slow. The same amount of land could support either 1,000 hunters or 100,000 farmers, and it is easy to see which side ultimately would win a fight for the land. Farmers gathered in permanent villages, and through a process of warfare consolidated into much larger states, including those in China, India, Egypt and Mesopotamia. From 300 to 1400 AD large agricultural states also existed throughout the eastern United States, called the "Hopewell tradition" and "Mississippian cultures". They are most famous as Mound Builders, but their culture collapsed (for unknown reasons) by 1500. The natives encountered by the English and French were nomadic hunters who supplemented their meat diet with cultivated vegetables.[16][17]
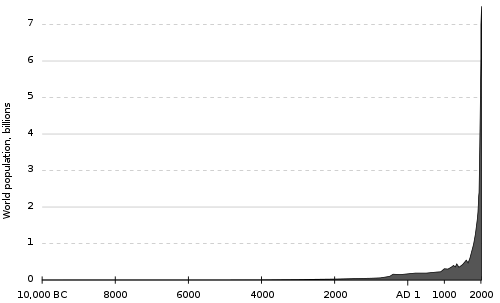
Graph of human population from 10000 BC to 2000 AD. It shows exponential rise in world population that has taken place since the end of the seventeenth century.
Estimates of the population of the world at the time agriculture emerged in around 10,000 BC have ranged between 1 million and 15million.[18][19] Even earlier, genetic evidence suggests humans may have gone through a population bottleneck of between 1,000 and 10,000 people about 70,000 BC, according to the now largely discredited Toba catastrophe theory. By contrast, it is estimated that around 50–60million people lived in the combined eastern and western Roman Empire in the 4th century AD.[20]
The Plague of Justinian caused Europe's population to drop by around 50% between the 6th and 8th centuries AD.[21] The population of Europe was more than 70 million in 1340.[22] From 1340 to 1400, the world's population fell from an estimated 443 million to 350–375million,[23] with the Indian subcontinent suffering the most tremendous loss and Europe suffering the Black Deathpandemic;[24] it took 200 years for European population figures to recover.[25] The population of China decreased from 123 million in 1200 to 65million in 1393,[26] presumably from a combination of Mongol invasions, famine, and plague.[27]
Starting in AD 2, the Han dynasty of ancient China kept consistent family registers to properly assess the poll taxes and labor service duties of each household.[28] In that year, the population of Western Han was recorded as 57,671,400 individuals in 12,366,470 households, decreasing to 47,566,772 individuals in 9,348,227 households by AD 146, towards the end of the Han dynasty.[28] From 200 to 400, the world population fell from an estimated 257 million to 206million, with China suffering the greatest loss.[24] At the founding of the Ming dynasty in 1368, China's population was reported to be close to 60 million; toward the end of the dynasty in 1644, it may have approached 150million.[29] England's population reached an estimated 5.6million in 1650, up from an estimated 2.6million in 1500.[30] New crops that were brought to Asia and Europe from the Americas by Portuguese and Spanish colonists in the 16th century are believed to have contributed to population growth.[31][32][33] Since their introduction to Africa by Portuguese traders in the 16th century,[34] maize and cassava have similarly replaced traditional African crops as the most important staple food crops grown on the continent.[35]
The pre-Columbian population of the Americas is uncertain; historian David Henige called it "the most unanswerable question in the world."[36] By the end of the 20th century, scholarly consensus favored an estimate of roughly 55 million people, but numbers from various sources have ranged from 10million to 100million.[37] Encounters between European explorers and populations in the rest of the world often introduced local epidemics of extraordinary virulence.[38] According to the most extreme scholarly claims, as many as 90% of the Native American population of the New World died of Old World diseases such as smallpox, measles, and influenza.[39] Over the centuries, the Europeans had developed high degrees of immunity to these diseases, while the indigenous peoples had no such immunity.[40]
Modern history
Map showing urban areas with at least one million inhabitants in 2025. Only 3% of the world's population lived in urban areas in 1800; this proportion had risen to 47% by 2000, and reached 56% by 2020.
During the European Agricultural and Industrial Revolutions, the life expectancy of children increased dramatically.[42] The percentage of the children born in London who died before the age of five decreased from 74.5% in 1730–1749 to 31.8% in 1810–1829.[43][44] Between 1700 and 1900, Europe's population increased from about 100 million to over 400million.[45] Altogether, the areas populated by people of European descent comprised 36% of the world's population in 1900.[46]
Population growth in the Western world became more rapid after the introduction of vaccination and other improvements in medicine and sanitation.[47] Improved material conditions led to the population of Britain increasing from 10 million to 40million in the 19th century.[48] The population of the United Kingdom reached 60 million in 2006.[49] The United States saw its population grow from around 5.3million in 1800 to 106 million in 1920, exceeding 307million in 2010.[50]
20th century
The human population grew by approximately 4.5 billion people during the 20th century, increasing from about 1.6 billion in 1900 to just over 6 billion by the year 2000.
The first half of the 20th century in Imperial Russia and the Soviet Union was marked by a succession of major wars, famines and other disasters which caused large-scale population losses (approximately 60 million excess deaths).[51][52] After the collapse of the Soviet Union, Russia's population declined significantly – from 150 million in 1991 to 143million in 2012[53] – but by 2013 this decline appeared to have halted.[54]
Many countries in the developing world have experienced extremely rapid population growth since the early 20th century, due to economic development and improvements in public health. China's population rose from approximately 430 million in 1850 to 580million in 1953,[55] and now stands at over 1.3billion. The population of the Indian subcontinent, which was about 125 million in 1750, increased to 389million in 1941;[56] today, India, Pakistan and Bangladesh are collectively home to about 1.63 billion people.[57]Java, an island in Indonesia, had about 5 million inhabitants in 1815; it had a population of over 139million in 2020.[58] In just one hundred years, the population of Brazil decupled (x10), from about 17 million in 1900, or about 1% of the world population in that year, to about 176million in 2000, or almost 3% of the global population in the very early 21st century. Mexico's population grew from 13.6million in 1900 to about 112million in 2010.[59][60] Between the 1920s and 2000s, Kenya's population grew from 2.9million to 37 million.[61]
World population milestones in billions[62] (Worldometers estimates)
Population
1
2
3
4
5
6
7
8
9
10
Year
1804
1927
1960
1974
1987
1999
2011
2022
2037
2057
Years elapsed
–
123
33
14
13
12
12
11
15
20
The UN estimated that the world population reached one billion for the first time in 1804. It was another 123 years before it reached two billion in 1927, but it took only 33 years to reach three billion in 1960.[63] Thereafter, it took 14 years for the global population to reach four billion in 1974, 13 years to reach five billion in 1987, 12 years to reach six billion in 1999 and, according to the United States Census Bureau, 13 years to reach seven billion in March 2012.[64] The United Nations, however, estimated that the world population reached seven billion in October 2011.[65][66][67]
According to the UN, the global population reached eight billion in November 2022,[68] but because the growth rate is slowing, it will take another 15 years to reach around 9billion by 2037 and 20 years to reach 10billion by 2057.[69] Alternative scenarios for 2050 range from a low of 7.4billion to a high of more than 10.6billion.[70] Projected figures vary depending on underlying statistical assumptions and the variables used in projection calculations, especially the fertility and mortality variables. Long-range predictions to 2150 range from a population decline to 3.2billion in the "low scenario", to "high scenarios" of 24.8billion.[70] One extreme scenario predicted a massive increase to 256billion by 2150, assuming the global fertility rate remained at its 1995 level of 3.04 children per woman; however, by 2010 the global fertility rate had declined to 2.52.[71][72]
There is no estimation for the exact day or month the world's population surpassed one or two billion. The points at which it reached three and four billion were not officially noted, but the International Database of the United States Census Bureau placed them in July 1959 and April 1974 respectively. The United Nations did determine, and commemorate, the "Day of 5 Billion" on 11 July 1987, and the "Day of 6 Billion" on 12 October 1999. The Population Division of the United Nations declared the "Day of Seven Billion" to be 31 October 2011.[73] The United Nations marked the birth of the eight billionth person on 15 November 2022.[74][68]
2015 map showing average life expectancy by country in years. In 2015, the World Health Organization estimated the average global life expectancy as 71.4 years.
As of 2020, the global sex ratio is approximately 1.01 males to 1 female.[76] Approximately 24.7% of the global population is aged under 15, while 65.2% is aged 15–64 and 10.1% is aged 65 or over.[76] The median age of the world's population is estimated to be 31 years in 2020,[10] and is expected to rise to 37.9 years by 2050.[77]
According to the World Health Organization, the global average life expectancy is 73.3 years as of 2020, with women living an average of 75.9 years and men approximately 70.8 years.[78] In 2010, the global fertility rate was estimated at 2.44 children per woman.[79] In June 2012, British researchers calculated the total weight of Earth's human population as approximately 287million tonnes (630billion pounds), with the average person weighing around 62 kilograms (137lb).[80]
The IMF estimated nominal 2021 gross world product at US$94.94trillion, giving an annual global per capita figure of around US$12,290.[81] Around 9.3% of the world population lives in extreme poverty, subsisting on less than US$1.9 per day;[82] around 8.9% are malnourished.[83] 87% of the world's over-15s are considered literate.[84] As of January 2024, there were about 5billion global Internet users, constituting 66% of the world population.[85]
The Han Chinese are the world's largest single ethnic group, constituting over 19% of the global population in 2011.[86] The world's most-spoken languages[a] are English (1.132B), Mandarin Chinese (1.117B), Hindi (615M), Spanish (534M) and French (280M). More than three billion people speak an Indo-European language, which is the largest language family by number of speakers. Standard Arabic is a language with no native speakers, but the total number of speakers is estimated at 274 million people.[87]
Six of the Earth's seven continents are permanently inhabited on a large scale. Asia is the most populous continent, with its 4.64billion inhabitants accounting for 60% of the world population. The world's two most populated countries, India and China, together constitute about 36% of the world's population. Africa is the second most populated continent, with around 1.34billion people, or 17% of the world's population. Europe's 747 million people make up 10% of the world's population as of 2020, while the Latin American and Caribbean regions are home to around 653 million (8%). Northern America, primarily consisting of the United States and Canada, has a population of around 368million (5%), and Oceania, the least populated region, has about 42million inhabitants (0.5%).[89]Antarctica only has a very small, fluctuating population of about 1200 people based mainly in polar science stations.[90]
Population pyramid of the world in continental groupings in 2023. The left and right sides of the vertical axis represent different sexes (male and female).
Current world population and latest projection according to the UN. Population in (millions) and percent of the global population in that year.[91]
Cartogram showing the distribution of the world population, each square represents half a million people.Choropleth showing Population density (people per square kilometre) by country or U.S. state in 20191901 to 2021 population graph of the five countries with the highest current populations
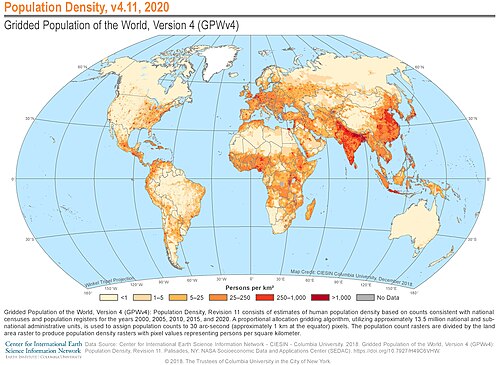
The tables below list the world's most densely populated countries, both in absolute terms and in comparison to their total populations, as of November 2022. All areas and populations are from The World Factbook, unless otherwise noted.
Population density (people per km ) map of the world in 2020. Red areas denote regions of highest population density
10 most densely populated countries (with population above 5million)[102]
Countries ranking highly in both total population (more than 20 million people) and population density (more than 250 people per square kilometer)[102]
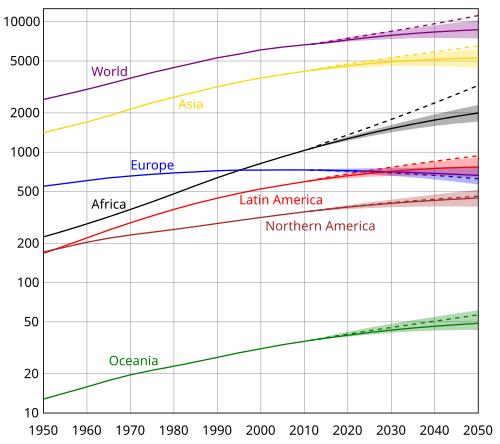
Estimates of population evolution in different continents between 1950 and 2050, according to the United Nations. The vertical axis is logarithmic and is in millions of people.
Population size fluctuates at differing rates in differing regions. Nonetheless, population growth has been the long-standing trend on all inhabited continents, as well as in most individual states. During the 20th century, the global population saw its greatest increase in known history, rising from about 1.6billion in 1900 to over 6billion in 2000[105] as the whole world entered the early phases of what has come to be called the "demographic transition". Some of the key factors contributing to this increase included the lessening of the mortality rate in many countries by improved sanitation and medical advances, and a massive increase in agricultural productivity attributed to the Green Revolution.[106][107] By 2000, there were approximately ten times as many people on Earth as there had been in 1700.
However, this rapid growth did not last. During the period 2000–2005, the United Nations estimates that the world's population was growing at an annual rate of 1.3% (equivalent to around 80 million people), down from a peak of 2.1% during the period 1965–1970.[5] Globally, although the population growth rate has been steadily declining from its peak in 1968,[108] growth still remains high in Sub-Saharan Africa.[109]
In 2019, the United Nations reported that the rate of population growth continues to decline due to the ongoing global demographic transition. If this trend continues, the rate of growth may diminish to zero by 2100, concurrent with a world population plateau of 10.9billion.[5][69] However, this is only one of many estimates published by the UN; in 2009, UN population projections for 2050 ranged between around 8billion and 10.5billion.[111] An alternative scenario is given by the statistician Jorgen Randers, who argues that traditional projections insufficiently take into account the downward impact of global urbanization on fertility. Randers' "most likely scenario" reveals a peak in the world population in the early 2040s at about 8.1billion people, followed by decline.[112] Adrian Raftery, a University of Washington professor of statistics and of sociology, states that "there's a 70 percent probability the world population will not stabilize this century. Population, which had sort of fallen off the world's agenda, remains a very important issue."[113]
Estimated world population figures, 10,000BC – AD 2000
Estimated world population figures, 10,000BC – AD 2000 (in log y scale)
The table below shows historical and predicted regional population figures in millions.[115][116][117] The availability of historical population figures varies by region.
World historical and predicted populations (in millions)[118][63][119]
The following table gives estimates, in millions, of population in the past. The data for 1750 to 1900 are from the UN report "The World at Six Billion"[116][120] whereas the data from 1950 to 2015 are from a UN data sheet.[101]
Using the above figures, the change in population from 2010 to 2015 was:
World: +420 million
Africa: +142 million
Asia: +223 million
Europe: +3 million
Latin America and Caribbean: +35 million
Northern America: +14 million
Oceania: +2.9 million
123456North America is here defined to include the northernmost countries and territories of North America: Canada, the United States, Greenland, Bermuda, and Saint Pierre and Miquelon. Latin America & Carib. comprises Mexico, Central America, the Caribbean, and South America.
World population by age group projection until 2100.
Long-term global population growth is difficult to predict. The United Nations and the US Census Bureau both give different estimates – according to the UN, the world population reached seven billion in late 2011,[115] while the USCB asserted that this occurred in March 2012.[125] Since 1951, the UN has issued multiple projections of future world population, based on different assumptions. From 2000 to 2005, the UN consistently revised these projections downward, until the 2006 revision, issued on 14 March 2007, revised the 2050 mid-range estimate upwards by 273million.[citation needed]
Complicating the UN's and others' attempts to project future populations is the fact that average global birth rates, as well as mortality rates, are declining rapidly, as the nations of the world progress through the stages of the demographic transition, but both vary greatly between developed countries (where birth rates and mortality rates are often low) and developing countries (where birth and mortality rates typically remain high). Different ethnicities also display varying birth rates.[126] Birth rate and mortality rates can change rapidly due to disease epidemics, wars and other mass catastrophes, or advances in medicine and public health.
World population growth 1700–2100, 2022 projectionRegional and worldwide populations after 1950. Projected population to 2100 is based on the UN's medium population scenario.
The UN's first report in 1951 showed that during the period 1950–55 the crude birth rate was 36.9/1,000 population and the crude death rate was 19.1/1,000. By the period 2015–20, both numbers had dropped significantly to 18.5/1,000 for the crude birth rate and 7.5/1,000 for the crude death rate. UN projections for 2100 show a further decline in the crude birth rate to 11.6/1,000 and an increase in the crude death rate to 11.2/1,000.[127][69]
The total number of births globally is currently (2015–20) 140 million/year, is projected to peak during the period 2040–45 at 141million/year and thereafter decline slowly to 126million/year by 2100.[128] The total number of deaths is currently 57 million/year and is projected to grow steadily to 121million/year by 2100.[127]
2012 United Nations projections show a continued increase in population in the near future with a steady decline in population growth rate; the global population is expected to reach between 8.3and 10.9billion by 2050.[129][130] 2003 UN Population Division population projections for the year 2150 range between 3.2 and 24.8billion.[71] One of many independent mathematical models supports the lower estimate,[131] while a 2014 estimate forecasts between 9.3 and 12.6billion in 2100, and continued growth thereafter.[132][133] The 2019 Revision of the UN estimates gives the "medium variant" population as; nearly 8.6billion in 2030, about 9.7billion in 2050 and about 10.9billion in 2100.[134] In December 2019, the German Foundation for World Population projected that the global population will reach 8billion by 2023 as it increases by 156 every minute.[135] In a modeled future projection by the Institute for Health Metrics and Evaluation, the global population was projected to peak in 2064 at 9.73billion people and decline to 8.79billion in 2100.[136] Some analysts have questioned the sustainability of further world population growth, highlighting the growing pressures on the environment,[137][138] global food supplies, and energy resources.[139][140][141]
Some scholars have argued that a form of "cultural selection" may be occurring due to significant differences in fertility rates between cultures, and it can therefore be expected that fertility rates and rates of population growth may rise again in the future.[142][143][144] An example is certain religious groups that have a higher birth rate that is not accounted for by differences in income. In his book Shall the Religious Inherit the Earth?, Eric Kaufmann argues that demographic trends point to religious fundamentalists greatly increasing as a share of the population over the next century.[145][146] From the perspective of evolutionary psychology, it is expected that selection pressure should occur for whatever psychological or cultural traits maximize fertility.[147][148][149]
UN (medium variant – 2019 revision) and US Census Bureau (June 2015) estimates[97][123]
Year
UN est. (millions)
Difference
USCB est. (millions)
Difference
2005
6,542
–
6,473
–
2010
6,957
415
6,866
393
2015
7,380
423
7,256
390
2020
7,795
415
7,643
380
2025
8,184
390
8,007
363
2030
8,549
364
8,341
334
2035
8,888
339
8,646
306
2040
9,199
311
8,926
280
2045
9,482
283
9,180
254
2050
9,735
253
9,408
228
UN 2024 estimates and medium variant projections (in millions)[150]
Year
World
Asia
Africa
Europe
Latin Am./ Caribbean
Northern America
Oceania
2000
6,144
3,741 (60.9%)
811 (13.2%)
726 (11.8%)
522 (8.5%)
312 (5.1%)
31 (0.5%)
2024
8,160
4,810 (58.9%)
1,520 (18.6%)
745 (9.1%)
663 (8.1%)
385 (4.7%)
46 (0.6%)
2050
9,660
5,280 (54.7%)
2,470 (25.6%)
703 (7.3%)
730 (7.6%)
426 (4.4%)
57 (0.6%)
2075
10,250
5,100 (49.8%)
3,290 (32.1%)
636 (6.2%)
698 (6.8%)
452 (4.4%)
66 (0.6%)
2100
10,180
4,610 (45.3%)
3,810 (37.4%)
592 (5.8%)
613 (6.0%)
475 (4.7%)
73 (0.7%)
Mathematical approximations
In 1975, Sebastian von Hoerner proposed a formula for population growth which represented hyperbolic growth with an infinite population in 2025.[151] The hyperbolic growth of the world population observed until the 1970s was later correlated to a non-linear second-order positive feedback between demographic growth and technological development. This feedback can be described as follows: technological advance → increase in the carrying capacity of land for people → demographic growth → more people → more potential inventors → acceleration of technological advance → accelerating growth of the carrying capacity → faster population growth → accelerating growth of the number of potential inventors → faster technological advance → hence, the faster growth of the Earth's carrying capacity for people, and so on.[152] The transition from hyperbolic growth to slower rates of growth is related to the demographic transition.
According to the Russian demographer Sergey Kapitsa,[153] the world population grew between 67,000BC and 1965 according to the following formula:
where
N is current population,
T is the current year,
C = (1.86 ± 0.01)·1011,
T0 = 2007 ± 1,
= 42 ± 1.
Years for world population to double
According to linear interpolation and extrapolation of UNDESA population estimates, the world population has doubled, or will double, in the years listed in the tables below (with two different starting points). During the 2nd millennium, each doubling took roughly half as long as the previous doubling, fitting the hyperbolic growth model mentioned above. However, after 2024, it is unlikely that there will be another doubling of the global population in the 21st century.[154]
Historic chart showing the periods of time the world population has taken to double, from 1700 to 2000
The total number of humans who have ever lived is estimated to be approximately 100billion. Such estimates can only be rough approximations, as even modern population estimates are subject to uncertainty of around 3% to 5%.[14] Kapitsa (1996) cites estimates ranging between 80 and 150billion.[156] The PRB puts the figure at 117billion as of 2020, estimating that the current world population is 6.7% of all the humans who have lived since 190,000 BCE.[157] Haub (1995) prepared another figure, updated in 2002 and 2011; the 2011 figure was approximately 107billion.[158][159][160] Haub characterized this figure as an estimate that required "selecting population sizes for different points from antiquity to the present and applying assumed birth rates to each period".[159]
Robust population data only exist for the last two or three centuries. Until the late 18th century, few governments had ever performed an accurate census. In many early attempts, such as in Ancient Egypt and the Persian Empire, the focus was on counting merely a subset of the population for purposes of taxation or military service.[161] Thus, there is a significant margin of error when estimating ancient global populations.
Pre-modern infant mortality rates are another critical factor for such an estimate; these rates are very difficult to estimate for ancient times due to a lack of accurate records. Haub (1995) estimates that around 40% of those who have ever lived did not survive beyond their first birthday. Haub also stated that "life expectancy at birth probably averaged only about ten years for most of human history",[159] which is not to be mistaken for the life expectancy after reaching adulthood. The latter equally depended on period, location and social standing, but calculations identify averages from roughly 30years upward.
The National Institute of Corrections estimates that the number of people who have ever lived will rise to 121billion by 2050, 4billion more than their 2021 estimate.[162]
Human population as a function of food availability
Individuals from a wide range of academic fields and political backgrounds have proposed that, like all other animal populations, any human population (and, by extension, the world population) predictably grows and shrinks according to available food supply, growing during an abundance of food and shrinking in times of scarcity.[163] This idea may run counter to the popular thinking that, as population grows, food supply must also be increased to support the growing population; instead, the claim here is that growing population is the result of a growing food supply. Notable proponents of this notion include: agronomist and insect ecologist David Pimentel,[164] behavioral scientist Russell Hopfenberg (the former two publishing a study on the topic in 2001),[165] anthropologist and activist Virginia Abernethy,[166] ecologist Garrett Hardin,[167] science writer and anthropologist Peter Farb, journalist Richard Manning,[168] environmental biologist Alan D. Thornhill,[169] cultural critic and writer Daniel Quinn,[170] and anarcho-primitivistJohn Zerzan.[171]
Scientists generally acknowledge that at least one significant factor contributing to population growth (or overpopulation) is that as agriculture advances in creating more food, the population consequently increases—the Neolithic Revolution and Green Revolution often specifically provided as examples of such agricultural breakthroughs.[172][173][174][175][176][177] Furthermore, certain scientific studies do lend evidence to food availability in particular being the dominant factor within a more recent timeframe.[178][179][164] Other studies take it as a basic model from which to make broad population conjectures.[172] The idea became taboo following the United Nations' 1994 International Conference on Population and Development, where framing human population growth as negatively impacting the natural environment became regarded as "anti-human".[180]
Most human populations throughout history validate this theory, as does the overall current global population. Populations of hunter-gatherers fluctuate in accordance with the amount of available food. The world human population began consistently and sharply to rise, and continues to do so, after sedentary agricultural lifestyles became common due to the Neolithic Revolution and its increased food supply.[181][174][177] This was, subsequent to the Green Revolution starting in the 1940s, followed by even more severely accelerated population growth. Often, wealthier countries send their surplus food resources to the aid of starving communities; however, some proponents of this theory argue that this seemingly beneficial strategy only results in further harm to those communities in the long run. Anthropologist Peter Farb, for example, has commented on the paradox that "intensification of production to feed an increased population leads to a still greater increase in population."[182] Environmental writer Daniel Quinn has also focused on this phenomenon, which he calls the "food race", coining a term he felt was comparable, in terms of both escalation and potential catastrophe, to the nuclear arms race.
Criticism of this theory can come from multiple angles, for example by demonstrating that human population is not solely an effect of food availability, but that the situation is more complex. For instance, other relevant factors that can increase or limit human population include access to birth control, fresh water availability, arable land availability, energy consumed per person, heat removal, forest products, and various nonrenewable resources like fertilizers.[183] Another criticism is that, in the modern era, birth rates are lowest in the developed nations, which also have the highest access to food. In fact, some developed countries have both a diminishing population and an abundant food supply. The United Nations projects that the population of 51 countries or areas, including Germany, Italy, Japan, and most of the states of the former Soviet Union, is expected to be lower in 2050 than in 2005.[184] This shows that, limited to the scope of the population living within a single given political boundary, particular human populations do not always grow to match the available food supply. However, the global population as a whole still grows in accordance with the total food supply and many of these wealthier countries are major exporters of food to poorer populations, so that, according to Hopfenberg and Pimentel's 2001 research, "it is through exports from food-rich to food-poor areas... that the population growth in these food-poor areas is further fueled.[164] Their study thus suggests that human population growth is an exacerbating feedback loop in which food availability creates a growing population, which then causes the misimpression that food production must be consequently expanded even further.[185]
Regardless of criticisms against the theory that population is a function of food availability, the human population is, on the global scale, undeniably increasing,[186] as is the net quantity of human food produced—a pattern that has been true for roughly 10,000 years, since the human development of agriculture. The fact that some affluent countries demonstrate negative population growth fails to discredit the theory as a whole, since the world has become a globalized system with food moving across national borders from areas of abundance to areas of scarcity. Hopfenberg and Pimentel's 2001 findings support both this[164] and Daniel Quinn's direct accusation, in the early 2010s, that "First World farmers are fueling the Third World population explosion".[187]
↑Has limited international recognition as a country. Area for the purposes of these calculations is that claimed, not controlled, by the State of Palestine.
↑Has limited international recognition as a country. Area for the purposes of these calculations is that controlled, not claimed, by Taiwan.
↑Jean-Noël Biraben (1980), "An Essay Concerning Mankind's Evolution". Population, Selected Papers. Vol. 4. pp. 1–13. Original paper in French:(b) Jean-Noël Biraben (1979)."Essai sur l'évolution du nombre des hommes". Population. Vol. 34 (no. 1). pp. 13–25.
↑Ortiz-Ospina, Esteban; Roser, Max (9 May 2013). "World Population Growth". Our World in Data. Archived from the original on 13 October 2016. Retrieved 13 October 2016.
12"World", The World Factbook, Central Intelligence Agency, 19 October 2021, retrieved 1 November 2021
↑The compound "world population" becomes common from c. the 1930s, adapted from early 20th-century "world's population"; pre-20th century authors use "population of the world".
↑"The population of the world, which Sir W. P. in 1682, stated at only 320 millions, has been estimated by some writers at about 730million, by others, at upwards of 900million; Mr. Wallace, of Edinburgh, conjectured it might amount to 1billion, and this number has since generally been adopted who have noticed the subject;" The Monthly Magazine 4 (July–December 1797), p. 167.
↑600million: Simon Gray, The Happiness of States (1818), p. 356Archived 6 June 2019 at the Wayback Machine . 800million: Gordon Hall, Samuel Newell, The Conversion of the World (1818), p. 10Archived 6 June 2019 at the Wayback Machine . 800 to 1000million: John Redman Coxe, Considerations Respecting the Recognition of Friends in Another World (1845), p. 21 (footnote with references).
12"[E]ven recent demographic data is accurate only from 3 to 5%, although in demography traditionally more digits are indicated than those having a meaning. This is partially due to the ethical difficulty in rounding off numbers that supposedly represent real people, officially counted during a census". Sergei P.Kapitza, "The phenomenological theory of world population growth", Physics-Uspekhi 39(1) 57–71 (1996).
↑Peter Bellwood, First Farmers: The Origins of Agricultural Societies (Blackwell, (2004).
↑Fekri A. Hassan, "Population dynamics" in Companion Encyclopedia of Archaeology (Routledge, 2002), pp. 672–713.
↑Mark Nathan Cohen, The Food Crisis in Prehistory: Overpopulation and the Origins of Agriculture (Yale University Press, 1977).
12Nishijima, Sadao (1986), "The economic and social history of Former Han", in Twitchett, Denis; Loewe, Michael, Cambridge History of China: Volume I: the Ch'in and Han Empires, 221 B.C. – A.D. 220, Cambridge: Cambridge University Press, pp 595–96.
↑Collingham, Lizzie (2006). Vindaloo: the Portuguese and the chilli pepper. Curry: A Tale of Cooks and Conquerors. Oxford: Oxford University Press. pp.47–73. ISBN978-0-19-988381-3.
"Ch. 5: Population Size and Composition"(PDF). World Population Prospects, the 2000 Revision. Vol.III. United Nations Population Division. p.171. Retrieved 3 July 2010.
"Executive Summary"(PDF). World Population Prospects: The 2002 Revision Volume III: Analytical Report. 2002. Retrieved 3 July 2010.
"World Population to 2300"(PDF). New York: United Nations Department of Economic and Social Affairs: Population Division. 2004. pp.3, 14. Archived(PDF) from the original on 19 September 2018. Retrieved 3 July 2010.
12"Key Findings"(PDF). Long-Range Population Projections. New York: United Nations: Department of Economic and Social Affairs. 2003. Retrieved 3 July 2010.{{cite book}}: |work= ignored (help)CS1 maint: publisher location (link)
↑"Monthly Statidtical Bulletin – Bangladesh"(PDF). 2022-05-12-10-42-55414488d843db66462b5410cb439c22.pdf. Bangladesh Bureau of Statistics. February 2022. Archived(PDF) from the original on 8 June 2022. Retrieved 8 June 2022.
↑Randers, Jorgen (2012). 2052: A Global Forecast for the Next Forty Years. Vermont: Chelsea Green Publishing. p.62.{{cite book}}: CS1 maint: publisher location (link)
12Figures include the former Soviet countries in Europe. Caselli, Graziella; Gillaume Wunsch; Jacques Vallin (20 December 2005). Demography: Analysis and Synthesis, Four Volume Set: A Treatise in Population. Academic Press. p.42. ISBN978-0-12-765660-1.
↑Stokstad, Erik (5 May 2019). "Landmark analysis documents the alarming global decline of nature". Science. AAAS. Retrieved 19 July 2020. Driving these threats are the growing human population, which has doubled since 1970 to 7.6billion, and consumption. (Per capita of use of materials is up 15% over the past 5 decades.)
↑Zehner, Ozzie (2012). Green Illusions. Lincoln and London: University of Nebraska Press. pp.187–331. Archived from the original on 29 November 2019. Retrieved 10 April 2020.
↑Sebastien von Hoerner (1975). "Population Explosion and Interstellar Expansion". Journal of the British Interplanetary Society. 28 (28): 691–712. Bibcode:1975JBIS...28..691V.
↑Sergei P. Kapitza, "The phenomenological theory of world population growth", Physics-Uspekhi 39(1) 57–71 (1996), citing K.M. Weiss, Human Biology 56637 (1984) and N.Keyfitz, Applied Mathematical Demography (New York: Wiley, 1977).
↑Bystroff, Christopher (2021). "Footprints to singularity: A global population model explains late 20th century slow-down and predicts peak within ten years". PLoS ONE 16(5): e0247214. doi:10.1371/journal.pone.0247214
12Gilland, Bernard (2006). "Population, nutrition and agriculture". Population and Environment, 28(1), 1.
↑Bocquet-Appel, Jean-Pierre (2011). "When the world's population took off: the springboard of the Neolithic Demographic Transition". Science, 333(6042), 560–561.
↑"What Causes Overpopulation?" Euroscientist. Euroscience: "When agriculture advances, and it becomes easier to feed the population, it continues to grow."
↑Cohen, Joel E. (1995). Population growth and earth's human carrying capacity. Science, 269(5222), 341–346.
↑Fanta, V., Šálek, M., Zouhar, J., Sklenicka, P., & Storch, D. (2018). Equilibrium dynamics of European pre-industrial populations: the evidence of carrying capacity in human agricultural societies. Proceedings of the Royal Society B: Biological Sciences, 285(1871), 20172500.
↑Henderson, Kirsten, & Loreau, Michel (2019). "An ecological theory of changing human population dynamics". People and Nature, 1(1), 32.
↑GJ Armelagos, AH Goodman, KH Jacobs Population and environment – 1991 link.springer.com
↑Van Den Bergh, Jeroen, & Rietveld, Piet (2004). "Reconsidering the limits to world population: meta-analysis and meta-prediction". BioScience, 54(3), 195–204.
↑Salmony, Steven E. (2006). "The Human Population: Accepting Species Limits". Environmental Health Perspectives, 114(1), A 17. doi:10.1289/ehp.114-a17.
↑Quinn, Daniel: "The Question (ID Number 122)". Retrieved October 2014 from "Archived copy". Archived from the original on 4 March 2016. Retrieved 18 October 2014.{{cite web}}: CS1 maint: archived copy as title (link).
Hopfenberg, Russell, and David Pimentel. "Human population numbers as a function of food supply." Environment, development and sustainability 3 (2001): 1–15. online
Kiple, Kenneth F. and Kriemhild Coneè Ornelas, eds. The Cambridge World History of Food (2000)
This page is based on this Wikipedia article Text is available under the CC BY-SA 4.0 license; additional terms may apply. Images, videos and audio are available under their respective licenses.


![.mw-parser-output figure[typeof="mw:File/Thumb"] .image-key>ol{margin-left:1.3em;margin-top:0}.mw-parser-output figure[typeof="mw:File/Thumb"] .image-key>ul{margin-top:0}.mw-parser-output figure[typeof="mw:File/Thumb"] .image-key li{page-break-inside:avoid;break-inside:avoid-column}@media(min-width:300px){.mw-parser-output figure[typeof="mw:File/Thumb"] .image-key,.mw-parser-output figure[typeof="mw:File/Thumb"] .image-key-wide{column-count:2}.mw-parser-output figure[typeof="mw:File/Thumb"] .image-key-narrow{column-count:1}}@media(min-width:450px){.mw-parser-output figure[typeof="mw:File/Thumb"] .image-key-wide{column-count:3}}
.mw-parser-output .plainlist ol,.mw-parser-output .plainlist ul{line-height:inherit;list-style:none;margin:0;padding:0}.mw-parser-output .plainlist ol li,.mw-parser-output .plainlist ul li{margin-bottom:0}
.mw-parser-output .legend{page-break-inside:avoid;break-inside:avoid-column}.mw-parser-output .legend-color{display:inline-block;min-width:1.25em;height:1.25em;line-height:1.25;margin:1px 0;text-align:center;border:1px solid black;background-color:transparent;color:black}.mw-parser-output .legend-text{}
>80
77.5-80
75-77.5
72.5-75
70-72.5
67.5-70
65-67.5
60-65
55-60
50-55
2015 map showing average life expectancy by country in years. In 2015, the World Health Organization estimated the average global life expectancy as 71.4 years. Expectancy of life.svg](http://upload.wikimedia.org/wikipedia/commons/thumb/f/fa/Expectancy_of_life.svg/500px-Expectancy_of_life.svg.png)