With about 4% of the world's population, the United States is the third most populous country, and the most populous in the Americas and the Western Hemisphere. Its estimated population was 341,784,857 on July 1, 2025, according to the U.S. Census Bureau.[1] The country's population grew by only 1.8 million, or 0.5%, between 2024 and 2025, due to a decline in net international migration.[25] The previous year, the Census Bureau had reported a population increase of 0.98% between 2023 and 2024,[26] slightly below the global population growth rate of 1.03%.[27] These figures include the 50 states and the federal capital, Washington, D.C., but exclude the 3.6 million residents of five unincorporated U.S. territories (Puerto Rico, Guam, the U.S. Virgin Islands, American Samoa, and the Northern Mariana Islands) as well as several minor uninhabited island possessions. By several metrics, including racial and ethnic background, religious affiliation, and percentage of rural and urban divide, the state of Illinois is the most representative of the larger demography of the United States.[28]
The United States population almost quadrupled during the 20th century, with an average growth rate of about 1.3% a year, from about 76 million in 1900 to 281 million in 2000.[29] It is estimated to have reached the 200 million mark in 1967, and the 300 million mark on October 17, 2006.[29][30] Foreign-born immigration caused the U.S. population to continue its rapid increase, with this population doubling from almost 20 million in 1990 to over 45 million in 2015,[31] representing one-third of the population increase.[32] The U.S. Census Bureau reported in late 2024 that recent immigration to the United States had more than offset the country's lower birth rates: "Net international migration's influence on population trends has increased over the last few years. Since 2021, it accounted for the majority of the nation's growth—a departure from the last two decades, when natural increase was the main factor." This in turn led to an increase in the U.S. population in each of the years 2022, 2023, and 2024 (+0.58%, +0.83%, and +0.98% respectively). Net international migration slowed to a record low in 2025, however, and so did U.S. population growth during that year (+0.5%).[33][34]
Population growth is fastest among minorities as a whole, and according to a 2020 U.S. Census Bureau analysis, 50% of U.S. children under the age of 18 are members of ethnic minority groups.[35] As of 2020, white Americans numbered 235,411,507 or 71% of the population, including people who identified as white in combination with another race. People who identified as white alone (including Hispanic whites) numbered 204,277,273 or 61.6% of the population, while non-Latino whites made up 57.8% of the country's population.[36]
Latino Americans accounted for 51.1% of the country's total population growth between 2010 and 2020.[37] The Hispanic or Latino population increased from 50.5 million in 2010 to 62.1 million in 2020, a 23% increase and a numerical increase of more than 11.6 million.[37] Immigrants and their U.S.-born descendants are expected to provide most of the U.S. population gains in the decades ahead.[38]
Asian Americans are the fastest-growing racial group in the United States, with a growth rate of 35%. However, multiracial Asian Americans make up the fastest-growing subgroup, with a growth rate of 55%, reflecting the increase of mixed-race marriages in the United States.[39][40]
As of 2022[update], births to White American mothers remain around 50% of the U.S. total, a decline of 3% compared to 2021.[41] In the same time period, births to Asian American and Hispanic women increased by 2% and 6%, respectively.[42]
Population pyramid by race and ethnicity of the United States over time from 1900 to 2020
In 1900, when the U.S. population was 76 million, there were 66.8 million white Americans in the United States, representing 88% of the total population,[44] 8.8 million Black Americans, with about 90% of them still living in Southern states,[45] and slightly more than 500,000 Hispanics.[46]
Under federal law, the Immigration and Nationality Act of 1965,[47] the number of first-generation immigrants living in the United States has increased,[48] from 9.6 million in 1970 to about 38 million in 2007.[49] Around a million people legally immigrated to the United States per year in the 1990s, up from 250,000 per year in the 1950s.[50]
In 1900, non-Hispanic whites comprised almost 97% of the population of the 10 largest U.S. cities.[51] The Census Bureau reported that minorities (including Hispanic whites) made up 50.4% of the children born in the U.S. between July 2010 and July 2011,[52] compared to 37% in 1990.[53]
In 2014, the state with the lowest fertility rate was Rhode Island, with a rate of 1.56, while Utah had the greatest rate with a rate of 2.33.[54] This correlates with the ages of the states' populations: Rhode Island has the ninth-oldest median age in the US–39.2–while Utah has the youngest–29.0.[55]
In 2017, the U.S. birth rate remains well below the replacement level needed – at least 2.1 children per woman so as not to experience population decreases – as white American births fell in all 50 states and the District of Columbia. Among non-Hispanic white women, no states had a fertility rate above the replacement level. Among non-Hispanic Black women, 12 states reached above the replacement level needed. Among Hispanic women, 29 states did.[56] For non-Hispanic white women, the highest total fertility rate was in Utah, at 2.099, and the lowest in the District of Columbia, at 1.012. Among non-Hispanic Black women, the highest total fertility rate was in Maine, at 4.003, and the lowest in Wyoming, at 1.146. For Hispanic women, the highest total fertility rate was in Alabama, at 3.085, and the lowest in Vermont, at 1.200, and Maine, at 1.281.[56][57] As of 2016, due to aging, low birth rates and rising mortality driven partly by drug overdoses, deaths outnumber births among non-Hispanic whites in more than half the states in the country.[58]
Growth rate
United States population as estimated by the U.S. Census Bureau beginning in 1790.States in the U.S. with population change 2010 to 2020 United States census
-2.00% or less
-0.01% to -1.99%
0% to 0.99%
1% to 2.49%
2.5% to 4.99%
5% to 8.99%
9% to 11.99%
12% or more
U.S. population growth rates: 0.98% (2024), 0.83% (2023), 0.58% (2022), 0.16% (2021), 0.41% (2020)[26]
The 2020 U.S. Census reported there were more females than males with females making up 50.9% (or 168,763,470 people) of the population and males making up 49.1% (or 162,685,811 people). The previous census in 2010 also reported that there were more females than males; but females made up slightly less of the population at 50.8% and males made slightly more at 49.2%.[60]
The first U.S. Census to report more females than males was the 1950 Census.[61]
Percent distribution of the total population by age: 1900 to 2015
Sources: U.S. Census Bureau, U.S. Department of Commerce, United Nations medium variant projections[63]
Percent distribution of the total population by age groups (1900 to 2015)
Ages
1900
1910
1920
1930
1940
1950
1960
1970
1980
1990
2000
2010
2015
0–14 years
34.5
32.1
31.8
29.4
25.0
26.9
31.1
28.5
22.6
21.5
21.4
20.2
19.8
15–24 years
19.6
19.7
17.7
18.3
18.2
14.7
13.4
17.4
18.8
14.8
13.9
25–44 years
28.1
29.2
29.6
29.5
30.1
30.0
26.2
23.6
27.7
32.5
30.2
45–64 years
13.7
14.6
16.1
17.5
19.8
20.3
20.1
20.6
19.6
18.6
22.0
65 years and over
4.1
4.3
4.7
5.4
6.8
8.1
9.2
9.9
11.3
12.6
12.4
13.0
14.3
Total (%)
100
100
100
100
100
100
100
100
100
100
100
33.2
34.1
Dependency ratio
Bi-variate choropleth map comparing the estimated percent of the population 65 and older and 17 and younger in the Contiguous United States by county, 2020
The dependency ratio is the age-population ratio of people who are normally not in the labor force (the dependent population, which includes those aged 0 to 14 and 65 and older) to those who are (the productive part, ages 15 to 64). It is used to gauge the strain on the populace that is productive. The support ratio is the ratio of the working-age population to the elderly population, that is, the reciprocal of the aged dependency ratio.
Number of persons per square mile in the United States in 2010
States and territories in the United States by population per square mile, according to the 2020 United States census
Counties in the United States by population growth since 2010 according to the U.S. Census Bureau 2018 Annual Estimate of the Resident Population.[65] Counties with population growth greater than the United States as a whole are in dark green, counties with population growth slower than the United States in light green, and counties with declining populations in light red.
States in the United States by population growth since 2010 according to the U.S. Census Bureau 2018 Annual Estimate of the Resident Population.[65] States with population growth greater than the United States as a whole are in dark green, states with population growth slower than the United States in light green, and states with declining populations in light red.
The most densely populated state is New Jersey (1,263/mi2 or 488/km2).
The population is highly urbanized, with 83.3% of the population residing in cities and suburbs.[7] Large urban clusters are spread throughout the eastern half of the United States (particularly the Great Lakes area, northeast, east, and southeast) and the western tier states; mountainous areas, principally the Rocky Mountains and Appalachian chain, deserts in the southwest, the dense boreal forests in the extreme north, and the central prairie states are less densely populated; Alaska's population is concentrated along its southern coast – with particular emphasis on the city of Anchorage – and Hawaii's is centered on the island of Oahu.[7]California and Texas are the most populous states, as the mean center of U.S. population has consistently shifted westward and southward.[66][67]New York City is the most populous city in the United States[68] and has been since at least 1790.
As of 2011[update], about 250 million Americans live in or around urban areas. That means more than three-quarters of the U.S. population shares just about three percent of the U.S. land area.[76]
Population by year (includes estimates)
This table includes the official United States population by year from the U.S. Census Bureau, and includes the Bureau's intercensal estimates. Such estimates are taken on July 1 of each year but are not included for the years of the decennial census (2000, 2010, 2020, etc.). Whether the figure is a decennial census or an intercensal estimate is noted.
↑Total number of births is final; number of deaths is still provisional.
↑Provisional data for 2025 (especially for the last few months of the year) are subject to additional revisions in 2026 because of the underreporting of birth and death certificates. The total number of births and deaths in 2025 is therefore likely to increase by thousands due to delays in the completion of birth and death certificates in 2025.
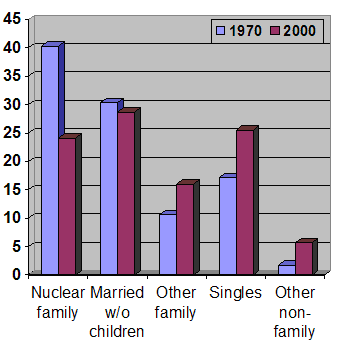
Marriages, Families and Intimate Relationships in the U.S., 1970–2000Median age at first marriage in the U.S.
According to the U.S. Census Bureau, in 2021, the population of the United States grew at a slower rate than in any other year since the country's founding.[109] The U.S. population grew only 0.1% from the previous year before.[109] The U.S. population has grown by less than one million people for the first time since 1937, with the lowest numeric growth since at least 1900, when the Census Bureau began yearly population estimates.[109] Apart from the previous few years, when population growth plummeted to historically low levels, the slowest pace of increase in the twentieth century occurred between 1918 and 1919, when the influenza epidemic and World War I were both in full swing.[109] Slower population growth has been the norm in the United States for some years, owing to lower fertility and net international migration, as well as rising mortality from an aging population.[109]
To put it another way, since the mid-2010s, births and net international migration have been dropping while deaths have risen. These trends have a cumulative effect of reduced population increase.[109]
The COVID-19 pandemic has accelerated this trend, resulting in a historically slow population increase in 2021.
The growth rate is 0.1% as estimated for 2021.[109]
The birth rate is 11.0 births/1,000 population, as of 2020.[110] This was the lowest birth rate since records began. There were 3,613,647 births in 2020, this was the lowest number of births since 1980.[110]
11.0 births/1,000 population per year (final data for 2020).
11.4 births/1,000 population per year (final data for 2019).[110]
In 2020, the CDC reported that there were 1,676,911 marriages in 2020, compared to 2019, there were 2,015,603 marriages.[111] Marriage rates varied significantly by state, ranging from 3.2 marriages/1,000 population in California to 21.0 marriages/1,000 population in Nevada.*[112]
5.1 marriages/1,000 population per year (provisional data for 2020).[111]
6.1 marriages/1,000 population per year (provisional data for 2019).[111]
*Rates are based on provisional counts of marriages by state of occurrence
In 2009, Time magazine reported that 40% of births in the United States were to unmarried women.[113] The following is a breakdown by race for unwed births: 17% Asian, 29% White, 53% Hispanics (of any race), 66% Native Americans, and 72% Black American.[114]
According to the CDC, in 2020, there were at least 1,461,121 births to unmarried women, or 40.5% of all births in the United States. The following is a breakdown by race for unwed births: 28.4% Non-Hispanic White, 70.4% Non-Hispanic Black, and 52.8% Hispanic (of any race).[115]
The drop in the U.S. birth rate from 2007 to 2009 is believed to be associated with the Great Recession.[116]
Per U.S. federal government data released in March 2011, births fell 4% from 2007 to 2009, the largest drop in the U.S. for any two-year period since the 1970s.[118] Births have declined for three consecutive years, and are now 7% below the peak in 2007.[119] This drop has continued through 2010, according to data released by the U.S. National Center for Health Statistics in June 2011.[119] Numerous experts have suggested that this decline is largely a reflection of unfavorable economic conditions.[120] This connection between birth rates and economic downturns partly stems from the fact that American birth rates have now fallen to levels that are comparable to the Great Depression of the 1930s.[121] Teen birth rates in the U.S. are at their lowest level in U.S. history.[122] In fact, teen birth rates in the U.S. have consistently decreased since 1991 through 2011, except for a brief increase between 2005 and 2007.[122] The other aberration from this otherwise steady decline in teen birth rates is the 6% decrease in birth rates for 15- to 19-year-olds between 2008 and 2009.[122] Despite these years of decrease, U.S. teen birth rates still remain higher than in other developed nations.[122] Racial differences prevail with teen birth and pregnancy rates as well. American Indian/Alaska Native, Hispanic, and non-Hispanic Black teen pregnancy rates are more than double the non-Hispanic white teen birth rate.[123]
Age group (2010)
Total (of population)
White alone (of race/age group)
Black alone (of race/age group)
Mixed and/or Some Other Race (of race/age group)
Asian alone (of race/age group)
Either American Indian or Alaska Native (of race/age group)
Either Native Hawaiian or Other Pacific Islander (of race/age group)
Total
308745538 (100%)
223553265 (72.4%)
38929319 (12.6%)
28116441 (9.1%)
14674252 (4.9%)
2932248 (1.0%)
540013 (0.2%)
0–4
20201362 (6.5%)
12795675 (5.7%/63.3%)
2902590 (7.5%/14.4%)
3315480 (11.8%/16.4%)
898011 (6.1%/4.5%)
244615 (8.3%/1.2%)
44991 (8.3%/0.2%)
5–9
20348657 (6.6%)
13293799 (5.9%/65.3%)
2882597 (7.4%/14.2%)
2957487 (10.5%/14.5%)
928248 (6.3%/4.6%)
243259 (8.3%/1.2%)
43267 (8.0%/0.0%)
10–14
20677194 (6.7%)
13737332 (6.1%/66.4%)
3034266 (7.8%/14.7%)
2736570 (9.7%/13.2%)
881590 (6.0%/4.3%)
245049 (8.4%/1.19%)
42387 (7.8%/0.2%)
15–19
22040343 (7.1%)
14620638 (6.5%/66.4%)
3448051 (8.9%/15.6%)
2704571 (9.6%/12.3%)
956028 (6.5%/4.3%)
263805 (9.0%/1.2%)
47250 (8.7%/0.2%)
20–24
21585999 (7.0%)
14535947 (6.5%/67.3%)
3111397 (8.0%/14.4%)
2538967 (9.0%/11.8%)
1106222 (7.5%/5.1%)
240716 (8.2%/1.1%)
52750 (9.8%/0.2%)
25–29
21101849 (6.8%)
14345364 (6.4%/68.0%)
2786254 (7.2%/13.2%)
2464343 (8.8%/11.7%)
1234322 (8.4%/5.9%)
221654 (7.6%/1.1%)
49912 (9.2%/0.2%)
30–34
19962099 (6.5%)
13573270 (6.1%/68.0%)
2627925 (6.8%/13.2%)
2273322 (8.1%/11.4%)
1240906 (8.5%/6.2%)
202928 (6.9%/1.0%)
43748 (8.1%/0.2%)
35–39
20179642 (6.5%)
13996797 (6.3%/69.36%)
2613389 (6.7%/13.0%)
2038408 (7.2%/10.1%)
1296301 (8.8%/6.4%)
196017 (6.7%/1.0%)
38730 (7.2%/0.2%)
40–44
20890964 (6.8%)
15052798 (6.7%/72.1%)
2669034 (6.9%/12.8%)
1782463 (6.3%/8.5%)
1155565 (7.9%/5.5%)
194713 (6.6%/0.9%)
36391 (6.7%/0.2%)
45–49
22708591 (7.4%)
17028255 (7.6%/75.0%)
2828657 (7.3%/12.5%)
1532117 (5.4%/6.8%)
1076060 (7.3%/4.7%)
207857 (7.1%/0.9%)
35645 (6.6%/0.2%)
50–54
22298125 (7.2%)
17178632 (7.7%/77.0%)
2694247 (6.9%/12.1%)
1222175 (4.3%/5.5%)
980282 (6.7%/4.4%)
191893 (6.5%/0.9%)
30896 (5.7%/0.1%)
55–59
19664805 (6.4%)
15562187 (7.0%/79.1%)
2205820 (5.7%/11.2%)
873943 (3.1%/4.4%)
844490 (5.8%/4.3%)
154320 (5.3%/0.8%)
24045 (4.5%/0.1%)
60–64
16817924 (5.4%)
13693334 (6.1%/81.4%)
1686695 (4.3%/10.0%)
611144 (2.2%/3.6%)
689601 (4.7%/4.1%)
118362 (4.0%/0.7%)
18788 (3.5%/0.1%)
65–69
12435263 (4.0%)
10313002 (4.6%/82.9%)
1162577 (3.0%/9.4%)
394208 (1.4%/3.2%)
474327 (3.2%/3.8%)
79079 (2.7%/0.6%)
12070 (2.2%/0.1%)
70–74
9278166 (3.0%)
7740932 (3.5%/83.4%)
852317 (2.2%/9.2%)
268574 (1.0%/2.9%)
354268 (2.4%/3.8%)
53926 (1.8%/0.6%)
8149 (1.5%/0.1%)
75–79
7317795 (2.4%)
6224569 (2.8%/85.1%)
616789 (1.6%/8.4%)
184596 (0.7%/2.5%)
251210 (1.7%/3.4%)
35268 (1.2%/0.5%)
5363 (1.0%/0.1%)
80–84
5743327 (1.9%)
5002427 (2.2%/87.1%)
424592 (1.1%/7.4%)
122249 (0.4%/2.1%)
168879 (1.2%/2.9%)
21963 (0.7%/0.4%)
3217 (0.6%/0.1%)
85+
5493433 (1.8%)
4858307 (2.2%/88.4%)
382122 (1.0%/7.0%)
95824 (0.3%/1.7%)
137942 (0.9%/2.5%)
16824 (0.6%/0.3%)
2414 (0.4%/0.0%)
Total fertility rate (TFR)
TFR of the United States overtime from 1820 to 2016
In 1800 the average U.S. woman had 7.04 children;[124] by the first decade of the 1900s, this number had already decreased to 3.56.[125] Since 1971, the birth rate has generally been below the replacement rate of 2.1.[126][127]:3 Since the Great Recession of 2007, the rate has consistently been below replacement.[126][127]:3 The drop in the TFR from 2.08 per woman in 2007 to 1.76 in 2017 was mostly due to the declining birth rate of ethnic minorities, teenagers and women in their 30s.[128] During that period, the birthrate for women ages 35 to 44 has risen.[126][128] The 12 month ending general fertility rate increased from 56.6 to 57.0 in 2022 Q1 compared to 2021 Q4.[129]
(Note that ≈95% of Hispanics are included as "white Hispanics" by CDC, which does not recognize the Census's "Some other race" category and counts people in that category as white.)
A total of 3,659,289 babies were born in 2021, a 1% increase from 2020. Additionally, researchers also looked at births by race and found that White and Hispanic women each saw the number of births increase by about 2% from 2020 to 2021. Meanwhile, Black and Asian women saw the number of births decline by 2.4% and 2.5%, respectively, over the same period, while American Indian/Alaskan Native women saw their numbers fall by 3.2%.[132] It also marks the first rise in births since 2014. Prior to this report, the total number of births had been decreasing by an average of 2% per year.[132] However, the total fertility rate (the number of births that the average women have over their lifetimes) was 1.6635 births per every woman. This is still below the replacement level, the level a population needs to replace itself, which is, at least, 2.1 births per woman.[132]
Number of births, by race and Hispanic origin of the mother and month of birth: United States, January–June, final 2019 and 2020, and provisional 2021 (provisional 2021 data is based on 99.92% of births)[139]
Note: Hispanics are counted both by their ethnicity and by their race, giving a higher overall number. Also note that growth arrows indicate an increase or decrease in the number of births, not in the fertility rate.[54][140][141][142]
Male: 76.5 (2024), 75.8 years (2023), 74.8 years (2022), 73.5 years (2021)[147]
Female: 81.4 years (2024), 81.1 years (2023), 80.2 years (2022), 79.3 years (2021)[148]
Starting in 1998, life expectancy in the U.S. fell behind that of other wealthy industrialized countries, and Americans' "health disadvantage" gap has been increasing ever since.[149] Average U.S. life expectancy in the United States has actually declined in four of the years following 2014 (the year when average U.S. life expectancy reached 78.9 years, its historical peak).[150] These declines were mostly reversed in 2022 (+1.1 years), 2023 (+0.9 years), and 2024 (+0.6 years). The CDC attributed the improvement in 2024 to a significant fall in the number of fatal drug overdoses, adding that "heart disease continues to be the leading cause of death in the United States, followed by cancer and unintentional injuries."[151][152] As of 2024, death rates among the youngest in the U.S. remain well higher than in peer nations.[152] In 2023, there had already been lower death rates in each of the ten U.S. leading causes of death, with gains in life expectancy largely driven by "decreases in mortality due to COVID-19, heart disease, unintentional injuries, cancer and diabetes".[152][153]
From 2019 to 2020, the COVID-19 pandemic had contributed to approximately 61% of the decrease in life expectancy in the United States.[154] While increases in mortality from unintentional injuries, heart disease, homicide, and diabetes contributed to 11.7%, 5.8%, 2.9%, and 2.8% of the decrease in life expectancy from 2019 to 2020, respectively.[154] Life expectancy has also varied by racial and ethnic group, with Non-Hispanic Asians having the highest life expectancy and Non-Hispanic American Indians having the lowest.[154] In 2021, life expectancy at birth in the United States fell for the second year in a row, the first two-year drop since 1961–1963.[155]
Life expectancy at birth by Hispanic origin and race, and sex: United States, 2019, 2020 & 2021[156]
Race
Males 2021
Females 2021
Total 2021*
Total 2020
Total 2019
2019 to 2021 /
NH White
73.7
79.2
76.4
77.4
78.8
2.4
NH Black
66.7
74.8
70.8
71.5
74.8
4.0
NH Asian
81.2
85.6
83.5
83.6
85.6
2.1
NH American Indian or Alaska Native
61.5
69.2
65.2
67.1
71.8
6.6
Hispanic
74.4
81.0
77.7
77.9
81.9
4.2
All origins and races
73.2
79.1
76.1
77.0
78.8
2.7
NOTE: Data regarding life expectancy at birth for 2021 are provisional.*
NH = Non-Hispanic.
LEB = Life expectancy at birth
Growth arrows (/) indicate an increase or decrease in total life expectancy compared to years before.
The United States Census Bureau's 2017 projections were produced using the cohort-component method. In the cohort-component method, the components of population change (fertility, mortality, and net migration) are projected separately for each birth cohort (persons born in a given year). The base population is advanced each year by using projected survival rates and net international migration. Each year, a new birth cohort is added to the population by applying the projected fertility rates to the female population.
U.S. population projections (resident population as of July 1, in thousands)[162]
Year
Population
2017
325,511
2018
327,892
2019
330,269
2020
332,639
2021
334,998
2022
337,342
2023
339,665
2024
341,963
2025
344,234
2026
346,481
2027
348,695
2028
350,872
2029
353,008
2030
355,101
2031
357,147
2032
359,147
2033
361,099
2034
363,003
2035
364,862
2036
366,676
2037
368,448
2038
370,179
2039
371,871
2040
373,528
2041
375,152
2042
376,746
2043
378,314
2044
379,861
2045
381,390
2046
382,907
2047
384,415
2048
385,918
2049
387,419
2050
388,922
2051
390,431
2052
391,947
2053
393,473
2054
395,009
2055
396,557
2056
398,118
2057
399,691
2058
401,277
2059
402,874
2060
404,483
Observed and Total Population for the States, 2030-2040[163]
Map of counties by racial plurality, per the 2020 United States census. Blue counties stand for a Non-Hispanic White plurality, Yellow for a Black or African American plurality, Green for a Hispanic or Latino plurality, Red for a Native American or Alaska Native plurality, and Purple for an Asian plurality.
The following table shows the race and ethnicity of the United States per the 1930, 1970, 2000, and 2020 censuses. Data only covers states and the federal district, thus only covering the first 48 states and Washington, D.C. in 1930 and including Alaska and Hawaii as well in 1970, 2000, and 2020. The figures thus do not include various other territories that have been under the United States during this time period.[a] Over this time period, the U.S. has evolved from being 89% White, 10% Black and 1% Hispanic in 1930 to 58% White, 12% Black, and 19% Hispanic ninety years later, reflecting a significant demographic shift.
U.S. race by Hispanic origin demographics from 1940 to 2020Ethnic origins in the United StatesEthno-racial makeup of the United States by single year ages from 1990 to 2020Ethno-racial makeup of the United States by single year ages in 2020
Counties in the United States by percentage of the population which is non-Hispanic or Latino and/or non-white according to the U.S. Census BureauAmerican Community Survey 2013–2017 5-Year Estimates.[171] Counties with larger populations of Hispanic/Latino and/or non-white than the United States as a whole are in full purple.
States in the United States by Hispanic/Latino and/or non-white population according to the U.S. Census Bureau American Community Survey 2013–2017 5-Year Estimates.[171] States with larger Hispanic/Latino and/or non-white populations than the United States as a whole are in full purple.
Race
Population pyramid by race/ethnicity in 2020
The United States Census Bureau collects racial data in accordance with guidelines provided by the U.S. Office of Management and Budget (OMB), and these data are based on self-identification. Many other countries count multiple races based on origin while America compiles multiple dozens of ethnicity groups into skin color grouping them together.[172] The racial classifications and definitions used by the U.S. Census Bureau are:[173]
White: a person having origins in any of the original peoples of Europe, the Middle East, or North Africa.[174] It includes people who indicate their race as "White" or report entries such as English, Azerbaijani, Iranian (Kurd and Lur), Irish, German, Italian, Spanish, Portuguese, Greek, Turkish, Lebanese, Moroccan (Arab and Berber), or Caucasian.
Black or African American: a person having origins in any of the Black racial groups of Africa.[174] It includes people who indicate their race as "Black, African Am." or report entries such as African American, Kenyan, Nigerian, or Haitian.
American Indian or Alaska Native: a person having origins in any of the original peoples of North and South America (including Central America) and who maintains tribal affiliation or community attachment.[174] This category includes people who indicate their race as "American Indian or Alaska Native" or report entries such as Navajo, Blackfeet, Inupiat, Yup'ik, Central American Indian groups, or South American Indian groups.
Asian: a person having origins in any of the original peoples of East Asia, Southeast Asia, or South Asia, such as Cambodia, China, India, Japan, Korea, Malaysia, Pakistan, the Philippine Islands, Thailand, and Vietnam.[174]
Some other race: includes all other responses not included in the "White", "Black or African American", "American Indian or Alaska Native", "Asian", and "Native Hawaiian or other Pacific Islander" racial categories described above includes Asians from West Asia or Russia (non-European Russia) and White Africans.
Two or more races: people may choose to provide two or more races either by checking two or more race response check boxes, providing multiple responses, or some combination of check boxes and other responses.
Data about race and ethnicity are self-reported to the Census Bureau. Since the 2000 census, Congress has authorized people to identify themselves according to more than one racial classification by selecting more than one category. Only one ethnicity may be selected, however, because the Census Bureau recognizes only two ethnicities–"Hispanic or Latino" and "Not Hispanic or Latino"–which are mutually exclusive since you can be one or the other, but not both. The singular term Hispanic has been supplanted as a federally-recognized ethnicity by the combined "Hispanic or Latino," defined by the Census Bureau as a person of Cuban, Mexican, Puerto Rican, Cuban, South or Central American, or other Spanish culture or origin, regardless of race.[175]
Map of counties in United States by racial and ethnic plurality, per the 2020 U.S. census
According to the Census Bureau website, the racial composition of the United States in 2021 was:[176]
Asian and Native Hawaiian and other Pacific Islander
1.5
2.9
3.8
5.0
6.2
Some other race
3.0
3.9
5.5
6.2
8.4
Two or more races
2.4
2.9
10.2
Sum (%)
99.5
99.6
99.6
99.5
99.6
99.5
99.1
98.6
100
100
100
100
100
*Data are shown for the White, Black or African American, American Indian and Alaska Native, Asian and Native Hawaiian and Other Pacific Islander, and Some other race alone populations.
The U.S. Office of Management and Budget (OMB) defines "Hispanic or Latino" as a person of Cuban, Mexican, Puerto Rican, Dominican, South or Central American, or other Spanish culture or origin regardless of race. People who identify with the terms "Hispanic" or "Latino" are those who classify themselves in one of the specific Hispanic or Latino categories listed on the decennial census questionnaire and various Census Bureau survey questionnaires – "Mexican, Mexican Am., Chicano" or "Puerto Rican" or "Cuban" – as well as those who indicate that they are "another Hispanic, Latino, or Spanish origin."[192] People who identify their origin as Hispanic or Latino may be of any race.[173]
Hispanic or Latino and Race
Population (2022 est.)
Percentage of total population
United States population
333,287,550
100%
Hispanic or Latino (of any race)
63,553,640
19.1%
White
10,735,941
3.2%
Black or African American
1,020,695
0.3%
American Indian and Alaska Native
1,454,842
0.4%
Asian
181,231
0.1%
Native Hawaiian and Other Pacific Islander
75,468
0.0%
Some other race
22,531,802
6.8%
Two or more races
27,453,162
8.2%
Not Hispanic or Latino
269,733,920
80.9%
Population distribution by Hispanic origin 1970–2020 (in%)
Source: U.S. Census Bureau, decennial census of population, 1970 (5-percent sample), 1980 to 2020.[73]
As of 2020, there are 9,666,058 people identifying as American Indian and Alaska Native people in the United States, including those identifying with more than one race,[193] representing around 3% of the U.S. population. This number includes not only groups indigenous to the United States, but any Indigenous people of the Americas,[194] including Mesoamerican peoples such as the Maya, as well as Canadian and South American natives. In 2022, 634,503 Indigenous people in the United States identified with Central American Indigenous groups, 875,183 identified with the Indigenous people of Mexico, and 47,518 identified with Canadian First Nations.[195] Of the 3.2 million Americans who identified as American Indian or Alaska Native alone in 2022, around 45% were of Hispanic or Latino ethnicity,[196][197] with this number growing as increasing numbers of Indigenous people from Latin American countries immigrate to the U.S. and more Latinos self-identify with indigenous heritage. Of groups Indigenous to the contiguous United States, the largest self-reported tribes are Cherokee (1,449,888), Navajo (434,910), Choctaw (295,373), Blackfeet (288,255), and Sioux (220,739). Additionally, 205,954 identify with an Alaska Native tribe. There are 573 federally recognized tribal governments[198] in the United States.[199]
The U.S. Census Bureau classifies Native Hawaiians separately from American Indians and Alaska Natives, grouping them with Pacific Islanders instead. According to 2022 estimates, 714,847 Americans identified with Native Hawaiian ancestry.[200]
Other groups
Veterans
There were 15.8 million veterans in 2023,[201] with only 6.2% of Americans having served in the Armed Forces.[202] In 2023 the war with the highest number of veterans was the Korean War. Most veterans were male at 14 million and 1.7 million veterans were female.[201]
Illegal immigrants
In 2010, The Washington Post estimated that there were 11 million illegal immigrants in the country.[203] In 2017, the Pew Research Center reported an estimated 10.5 million illegal immigrants in the U.S.[204] In 2025, Pew announced that "the number of unauthorized immigrants in the United States reached an all-time high of 14 million in 2023 after two consecutive years of growth".[205]
Prisoners
In 2023, an estimated 1,850,595 adults were imprisoned in the United States.[206]
In 2016 it was reported that 92.7% of all prisoners were male, 6.9% female, 0.3% transgender, and 0.1% nonbinary.[207] In 2022, there were 180,684 women incarcerated in U.S. prisons and jails. Most women involved in the country's correctional system were actually under probation, with 717,811 being so classified. Female parolees numbered 76,870, while 87,874 women were held in prisons and 92,900 women were held in jails in 2022.[208]
Some 37% of all federal prisoners were Hispanic, 32% Black/African American, 21% white, and 2% Native American or Alaska Native. Asians, Native Hawaiians and other Pacific islanders made up 2% of the population, while "nearly 7% of federal prisoners identified as two or more races". In state prisons, 34% identified as Black/African American, 32% white, 21% Hispanic, 1% Native American or Alaskan Native, 1% as being either Asian/Native Hawaiian/Other Pacific Islander, and 11% "identified with two or more races".[207]
A report by the U.S. Census Bureauprojects a decrease in the ratio of non-Hispanic Whites between 2023 and 2060, a decline from 58.9% of the population to 44.9%. Non-Hispanic Whites are projected to no longer make up a majority of the population by 2050, but will remain the largest single ethnic group. Non-Hispanic whites made up 85% of the population in 1960.[210]
While non-Hispanic whites are projected to become a minority, the total White population (including Hispanics), will remain a majority from 2023 to 2060, falling from 75.5% to 72.3% of the population who are white alone according to the projections.[211] However, these projections are not directly comparable to other Census Bureau data, as they are based on a modified race dataset,[212] which does not include the "some other race" category used in census surveys.[213] Individuals identifying as “some other race” alone or in combination made up 16.2% of the population in 2022,[214] and they are reclassified into recognized race categories in the dataset used for the projections.[215] As a result, there is a significant discrepancy between the share of the white alone population in 2023 according to the projections (75.5%), and the estimated share of white alone (60.9%), as reported by the American Community Survey in 2022.[216]
The report foresees the Hispanic or Latino population rising from 19.1% today to 26.9% by 2060, the Black percentage barely rising from 13.6% to 14.8%, and Asian Americans upping their 6.3% share to 9.4%. The United States had a population of 333 million people in July 2023, and is projected to reach 355 million by 2040 and 364 million in 2060.[217][218][219][220][221] It is further projected that all of the increase in population from 2023 to 2060 will be due to immigrants.
Of the nation's children in 2060, 64% are expected to be of a minority ethnicity, up from 51% today. Approximately 32% are projected to be Hispanic or Latino (up from 26% in 2023), and 36% are projected to be single-race, non-Hispanic Whites (down from 49% in 2023). Racial and ethnic minorities surpassed non-Hispanic whites as the largest group of U.S. children under 5 years old in 2015.[222]
The fastest growing racial group in America is Asian Americans with a growth rate of 35%, however the multiracial mixed Asian group is growing even faster, with a growth rate of 55%. Multiracial Asians are therefore the fastest growing demographic group in America.[40][39]
In 2020, it was reported that 51.0% of births were to non-Hispanic white mothers.[131] In 2021, the percentage increased to 51.5%.[131][223] However, by 2022 the rate of births to white mothers had declined by 3%, dropping to 50% of all total births. In the same period, the rate of births to Asian and Hispanic women increased by 2% and 6%, respectively.[42][41]
Population pyramids of racial groups (of one race)
Note: All races modified and not Hispanic; American Indian/Alaska Native not shown.
The country's racial profile will be vastly different, and although whites will remain the single largest ethnic group in the U.S., they will no longer be a majority excluding White Hispanics by 2055 according to Pew Research Center. Growth in the Hispanic and Asian populations is predicted to almost triple over the next 40 years. By 2055, the breakdown is estimated to be 48% non-Hispanic white, 24% Hispanic, 16% Black, and 14% Asian.[225]
As of 2015[update], 14% of the United States' population is foreign born, compared to just 5% in 1965. Nearly 39 million immigrants have come to the U.S. since 1965, with most coming from Asia and Latin America. The 2015 Census Report predicts that the percentage of the U.S. population that is foreign-born will continue to increase, reaching 19% by 2060. This increase in the foreign-born population will account for a large share of the overall population growth.[225]
The average person in the U.S. of 2060 is likely to be older than the average person of 2018 today, and it is projected that almost one in four people will be 65 or older.[225]
Most common ancestry group in the United States by county
This table displays all self-reported ancestries with over 50,000 members, alone or in combination, according to estimates from the 2022 American Community Survey. The total population of the US according to the survey was 333,287,550, and 251,732,240 people reported an ancestry. Of these, 175,054,020 reported a single ancestry, and 76,678,224 reported two or more ancestries.[227] Hispanic groups are not distinguished between total and partial ancestry:
The table below is based mainly on selected data as reported to the United States Census Bureau. It only includes the voluntary self-reported membership of religious bodies with 750,000 or more. The definition of a member is determined by each religious body.[234]In 2004[update], the US census bureau reported that about 13% of the population did not identify themselves as a member of any religion.[235][clarification needed]
According to data from Pew Research, Americans are significantly more religious on average than populations in other developed Western nations, with 55% of Americans reporting praying daily, compared to only 25% of Canadians, 18% of Australians, 6% of British people, and 22% of Europeans as a whole.[236] The country has a smaller share of unaffiliated or atheist population than most other Western nations. However, this population has been growing significantly in recent decades. Surveys conducted in 2014 and 2019 by Pew indicated that the percentage of Americans unaffiliated with a religion increased from 16% in 2007 to 23% in 2014 and 26% of the population in 2019.[237][238] A Pew Research Survey performed in 2012 found that the number of Americans without a religion was approaching the number of Evangelical Protestants, and estimated that if the current growth rate in irreligion continued, around 51% of Americans will not have a religion by 2050.[239]
According to statistical data made by the Pew Research Center in 2023 about 62% of the US population is Christian, 29% is Unaffiliated, 2% is Jewish, 1% follows Buddhism, 1% follows Hinduism, 1% follows Islam and 3% follow traditional religions and others.[240] Currently, the United States has the largest Christian population in the world (approximately 210 million) and the largest Protestant Christian population (approximately 130 million). The country also has the second largest Jewish community in the world (after Israel) and the largest Buddhist and Hindu communities in the West, as well as the largest number of followers of Islam in North America. The country has about 99 million non-affiliates (only China and Japan have more).
Religious affiliation within each state that has the largest deviation compared to the national average, 2001
Percentage of state populations that identify with a religion rather than "no religion", 2014
Plurality religion by state, 2001. Data is unavailable for Alaska and Hawaii.
According to Pew Research Center study released in 2018, by 2040, Islam will surpass Judaism to become the second largest religion in the US due to higher immigration and birth rates.[266]
The United States government does not collect religious data in its census. The survey below, the American Religious Identification Survey (ARIS) 2008, was a random digit-dialed telephone survey of 54,461 American residential households in the contiguous United States. The 1990 sample size was 113,723; 2001 sample size was 50,281.
Adult respondents were asked the open-ended question, "What is your religion, if any?". Interviewers did not prompt or offer a suggested list of potential answers. The religion of the spouse or partner was also asked. If the initial answer was "Protestant" or "Christian" further questions were asked to probe which particular denomination. About one-third of the sample was asked more detailed demographic questions.
Religious Self-Identification of the U.S. Adult Population: 1990, 2001, 2008[267] Figures are not adjusted for refusals to reply; investigators suspect refusals are possibly more representative of "no religion" than any other group.
States in the United States by Catholic population according to the Pew Research Center 2014 Religious Landscape Survey.[268] States with Catholic population greater than the United States as a whole are in full red.
States in the United States by Evangelical Protestant population according to the Pew Research Center 2014 Religious Landscape Survey.[268] States with Evangelical Protestant populations greater than the United States as a whole are in full orange.
States in the United States by Mainline or Black Protestant population according to the Pew Research Center 2014 Religious Landscape Survey.[268] States with Mainline or Black Protestant population greater than the United States as a whole are in full purple.
States in the United States by non-Christian (e.g. Non-religious, Jewish, Muslim, Hindu, Buddhist) population according to the Pew Research Center 2014 Religious Landscape Survey.[268] States with non-Christian populations greater than the United States as a whole are in full blue.
States in the United States by non-Protestant and non-Catholic Christian (e.g. Mormon, Jehovah's Witness, Eastern Orthodox) population according to the Pew Research Center 2014 Religious Landscape Survey.[268] States with non-Catholic/non-Protestant Christian population greater than the United States as a whole are in full green.
The United States Census Bureau does not measure sexual orientation but plans are in place to start measuring it starting in 2027 with the American Community Survey.[269] In 2024, Gallup reported that 9.3% of adults were LGBTQ. The percentage of people who have reported being LGBTQ has risen during the 2010s and 2020s. Of LGBTQ adults in the United States, the most common identification was bisexual, with 56.3% of LGBTQ adults identifying as bisexual; bisexual people made up 5.2% of the adult U.S. population. The survey also reported that 13.9% of LGBTQ adults were transgender and made up 1.3% of the U.S. adult population.[270]
In June 2023, UCLA's Williams Institute reported that there were approximately 823,000 same-sex couples in the United States. Also according to the institute, most same-sex couples were female at 53% and males were 47% of same-sex couples.[271]
In recent decades, the U.S. has grown from having 9% (1990) to 15% (2020) of the population being born abroad. The slopes of the tops of the differently-colored columns show the rate of percent increase in foreign-born people living in the respective countries.Foreign born population percentage in the US over time from 1850 to 2020
As of 2017, an estimated 44,525,458 residents of the United States were foreign-born,[273] 13.5% of the country's total population. This demographic includes recent as well as longstanding immigrants; statistically Europeans have resided in the US longer than those from other regions with approximately 66% having arrived prior to 2000.[274]
Place of birth of the foreign-born population in the United States, 2017[273]
In 2017, out of the U.S. foreign-born population, some 45% (20.7 million) were naturalized citizens, 27% (12.3 million) were lawful permanent residents (including many eligible to become citizens), 6% (2.2 million) were temporary lawful residents, and 23% (10.5 million) were unauthorized immigrants.[276] The Pew Research Center estimated that "the number of unauthorized immigrants in the United States reached an all-time high of 14 million in 2023 after two consecutive years of growth".[277]
Among current living immigrants to the U.S., the top five countries of birth are Mexico (25% of immigrants), China (6%), India (6%), the Philippines (5%) and El Salvador (3%). Some 13% of current living immigrants come from Europe and Canada, and 10% from the Caribbean.[276] Among new arrivals, Asian immigrants have been more numerous than Hispanic immigrants since 2010; in 2017, 37.4% of immigrant arrivals were Asian, and 26.6% were Hispanic.[276] Until 2017 and 2018, the United States led the world in refugee resettlement for decades, admitting more refugees than the rest of the world combined.[278] From fiscal year 1980 until 2017, 55% of refugees came from Asia, 27% from Europe, 13% from Africa, and 4% from Latin America, fleeing war and persecution.[278]
Net migration rate (2024): 3 migrants/1,000 population.[7] Country comparison to the world: 38th[7]
Net migration rate* (2020-2021): 0.73 migrants/1,000 population.[279]
*(mid-year estimates)
As of 2017, 13.6% (44.4 million) of the population was foreign-born – an increase from 4.7% in 1970 but less than the 1890 record of 14.8%. Some 45% of the foreign-born population were naturalized US citizens. Around 23% (10.3 million) of the foreign-born community is undocumented, accounting for 3.2% of the total population.[276] According to the 2010 census, Latin America and the Caribbean is the largest region-of-birth group, accounting for 53% of the foreign-born population. As of 2018, this region is still the largest source of immigrants to the United States.[280][281][282] In 2018, there were almost 90 million immigrants and U.S. born children of immigrants (second-generation Americans) in the United States, accounting for 28% of the overall U.S. population.[283] In 2018, 1,096,611 immigrants were granted either permanent or temporary legal residence in the United States[284]
Inflow of New Legal Permanent Residents Sending Countries, 2023
As of April 2015, the U.S. State Department estimated that 8.7 million American citizens live overseas. Americans living abroad are not counted in the U.S. Census unless they are federal government employees or dependents of a federal employee.[287] A 2010 paper estimated the number of civilian Americans living abroad to be around 4 million.[288] So-called "accidental Americans" are citizens of a country other than the United States who may also be considered U.S. citizens or be eligible for U.S. citizenship under specific laws but are not aware of having such status (or became aware of it only recently).[289]
As of 2022, 1.6 million Americans live in Mexico, according to the State Department.[290]
In 2020, the median household income in the United States was around $67,521, 2.9 percent less than the 2019 median of $69,560.[291] Household and personal income depends on variables such as race, number of income earners, educational attainment and marital status.
Median household income by selected characteristics [292]
Source: US Census Bureau, 2021; income statistics for the year 2021
Counties in the United States by the percentage of the over 25-year-old population with bachelor's degrees according to the U.S. Census Bureau American Community Survey 2013–2017 5-Year Estimates.[295] Counties with higher percentages of bachelor's degrees than the United States as a whole are in full orange.
States in the United States by the percentage of the over 25-year-old population with bachelor's degrees according to the U.S. Census Bureau American Community Survey 2013–2017 5-Year Estimates.[295] States with higher percentages of bachelor's degrees than the United States as a whole are in full orange.
Counties in the United States by per capita income according to the U.S. Census Bureau American Community Survey 2013–2017 5-Year Estimates.[296] Counties with per capita incomes higher than the United States as a whole are in full green.
States in the United States by per capita income according to the U.S. Census Bureau American Community Survey 2013–2017 5-Year Estimates.[296] States with per capita incomes higher than the United States as a whole are in full green.
Counties in the United States by median nonfamily household income according to the U.S. Census Bureau American Community Survey 2013–2017 5-Year Estimates.[296] Counties with median nonfamily household incomes higher than the United States as a whole are in full green.
States in the United States by median nonfamily household income according to the U.S. Census Bureau American Community Survey 2013–2017 5-Year Estimates.[296] States with median nonfamily household incomes higher than the United States as a whole are in full green.
Counties in the United States by median family household income according to the U.S. Census Bureau American Community Survey 2013–2017 5-Year Estimates.[296] Counties with median family household incomes higher than the United States as a whole are in full green.
States in the United States by median family household income according to the U.S. Census Bureau American Community Survey 2013–2017 5-Year Estimates.[296] States with median family household incomes higher than the United States as a whole are in full green.
Social classes in the United States lack distinct boundaries and may overlap. Even their existence (when distinguished from economic strata) is controversial. The following table provides a summary of some prominent academic theories on the stratification of American society:
Top-level executives, high-rung politicians, heirs. Ivy League education common.
Upper class (1%)
Top-level executives, celebrities, heirs; income of $500,000+ common. Ivy League education common.
The super-rich (0.9%)
Multi-millionaires whose incomes commonly exceed $3.5 million or more; includes celebrities and powerful executives/politicians. Ivy League education common.
Highly-educated (often with graduate degrees) professionals & managers with household incomes varying from the high 5-figure range to commonly above $100,000.
The rich (5%)
Households with net worth of $1 million or more; largely in the form of home equity. Generally have college degrees.
Middle class (plurality/ majority?; ca. 46%)
College-educated workers with considerably higher-than-average incomes and compensation; a man making $57,000 and a woman making $40,000 may be typical.
Lower middle class (30%)
Semi-professionals and craftsmen with a roughly average standard of living. Most have some college education and are white-collar.
Lower middle class (32%)
Semi-professionals and craftsmen with some work autonomy; household incomes commonly range from $35,000 to $75,000. Typically, some college education.
Working class (30%)
Clerical and most blue-collar workers whose work is highly routinized. Standard of living varies depending on number of income earners, but is commonly just adequate. High school education.
Working class (32%)
Clerical, pink- and blue-collar workers with often low job security; common household incomes range from $16,000 to $30,000. High school education.
Working class (ca. 40–45%)
Blue-collar workers and those whose jobs are highly routinized with low economic security; a man making $40,000 and a woman making $26,000 may be typical. High school education.
Working poor (13%)
Service, low-rung clerical and some blue-collar workers. High economic insecurity and risk of poverty. Some high school education.
Lower class (ca. 14–20%)
Those who occupy poorly-paid positions or rely on government transfers. Some high school education.
Underclass (12%)
Those with limited or no participation in the labor force. Reliant on government transfers. Some high school education.
The poor (ca. 12%)
Those living below the poverty line with limited to no participation in the labor force; a household income of $18,000 may be typical. Some high school education.
Thompson, W. & Hickey, J. (2005). Society in Focus. Boston, MA: Pearson, Allyn & Bacon; Beeghley, L. (2004). The Structure of Social Stratification in the United States. Boston, MA: Pearson, Allyn & Bacon.
1 The upper middle class may also be referred to as "Professional class" Ehrenreich, B. (1989). The Inner Life of the Middle Class. NY, NY: Harper-Collins.
Unemployment rate (seasonally adjusted)
U.S. unemployment by state in December 2015 (official, or U3 rate)
The U6 unemployment rate as of April2017[update] was 8.6 percent.[302] The U6 unemployment rate counts not only people without work seeking full-time employment (the more familiar U3 rate), but also counts "marginally attached workers and those working part-time for economic reasons." Some of these part-time workers counted as employed by U6 could be working as little as an hour a week. And the "marginally attached workers" include those who have become discouraged and stopped looking, but still want to work. The age considered for this calculation is 16 years and over.
Urban Americans have more job opportunities than those in more rural areas. From 2008 to 2018, 72% of the nation's employment growth occurred in cities with more than one million residents, which account for 56% of the overall population.[303]
A definitive recent study of U.S. generational cohorts was done by Schuman and Scott (2012) in which a broad sample of adults of all ages was asked, "What world events are especially important to you?"[304] They found that 33 events were mentioned with great frequency. When the ages of the respondents were correlated with the expressed importance rankings, seven (some indicated eight or nine) distinct cohorts became evident.
Today the following descriptors are frequently used for these cohorts:
Birth rate, death rate and natural increase rate in the United States 1935–2021
Subdivided groups are present when peak boom years or inverted peak bust years are present, and may be represented by a normal or inverted bell-shaped curve (rather than a straight curve). The boom subdivided cohorts may be considered as "pre-peak" (including peak year) and "post-peak". The year 1957 was the baby boom peak with 4.3 million births and 122.7 fertility rate. Although post-peak births (such as trailing edge boomers) are in decline, and sometimes referred to as a "bust", there are still a relatively large number of births. The dearth-in-birth bust cohorts include those up to the valley birth year, and those including and beyond, leading up to the subsequent normal birth rate. The baby boom began around 1943 to 1946.[313]
From the decline in U.S. birth rates starting in 1958 and the introduction of the birth control pill in 1960, the Baby Boomer normal distribution curve is negatively skewed. The trend in birth rates from 1958 to 1961 show a tendency to end late in the decade at approximately 1969, thus returning to levels prior to World War II, with 12 years of rising and 12 years of declining birth rates. Pre-war birth rates were defined as anywhere between 1939 and 1941 by demographers such as the Taeuber's, Philip M. Hauser and William Fielding Ogburn.[314]
Mobility
In 2021, 27.1 million Americans said they were living in a different place than a year before, compared to 29.8 million in 2020. This reflects an 8.4% mover rate, the lowest recorded in more than 70 years.[315]
In 2022 the most common level of highest educational attainment among those 25 years old and up (who were civilian and not institutionalized) was completing high school.[316]
According to the 2020 United States Census, the country had a total of 140,498,736 housing units, of which 126,817,580 (90.3%) were occupied and 13,681,156 (9.7%) were classified as being vacant, irrespective of status ("for rent", "rented, not occupied", "for sale only", "sold, not occupied", "for seasonal, recreational, or occasional use", among others). Of the occupied units, 80,051,358 units (63.1%) were owner-occupied, while 46,766,222 units (36.9%) were occupied by tenants.[317]
↑In fertility rates, 2.1 and above is a stable population and has been marked blue, 2 and below leads to an aging population and the result is that the population decreases.
↑Xu, Jiaquan; Murphy, Sherry; Kochanek, Kenneth D.; Arias, Elizabeth (January 29, 2026). "Mortality in the United States 2024". National Center for Health Statistics Brief / CDC. Retrieved February 1, 2026.
↑Osterman, Michelle; Hamilton, Brady; etal. (4 April 2024). Births: Final Data for 2022(PDF). National Vital Statistics Reports (Technical report). U.S. Department of Health and Human Services, Centers for Disease Control and Prevention, National Center for Health Statistics. p.31. Retrieved 21 January 2025.
12"U.S. births in 2022 didn't return to pre-pandemic levels". STAT. Associated Press. 2023-06-01. Retrieved 2023-06-19. "Births to Hispanic moms rose 6% last year and surpassed 25% of the U.S. total. Births to white moms fell 3%, but still accounted for 50% of births. Births to Black moms fell 1%, and were 14% of the total."
12America, Good Morning (2023-06-01). "Teenage birth rates in the US hit record lows in 2022: CDC report". Good Morning America. Retrieved 2023-06-19. "Among race/ethnicity between 2021 and 2022, the provisional number of births declined 3% for American Indian/Alaska Native and white women and by 1% for Black women from 2021 to 2022. However, birth rates rose 2% for Asian women and 6% for Native Hawaiian/Pacific Islander and Hispanic women."
123Martin, Joyce A.; Hamilton, Brady E.; Driscoll, Anne K.; Osterman, Michelle J. K.; Valenzuela, Claudia P. (February 7, 2022). "Births: Final Data for 2020"(PDF). National Vital Statistics Reports. 70 (1). CDC: 12. PMID35157571.
↑Xu, Jiaquan; Murphy, Sherry; Kochanek, Kenneth D.; Arias, Elizabeth (January 29, 2026). "Mortality in the United States 2024". National Center for Health Statistics Brief / CDC. Retrieved February 1, 2026.
↑Xu, Jiaquan; Murphy, Sherry; Kochanek, Kenneth D.; Arias, Elizabeth (January 29, 2026). "Mortality in the United States 2024". National Center for Health Statistics Brief / CDC. Retrieved February 1, 2026.
↑Xu, Jiaquan; Murphy, Sherry; Kochanek, Kenneth D.; Arias, Elizabeth (January 29, 2026). "Mortality in the United States 2024". National Center for Health Statistics Brief / CDC. Retrieved February 1, 2026.
1234Arias, Elizabeth; Xu, Jiaquan (August 8, 2022). "United States Life Tables, 2020"(PDF). National Vital Statistics Reports: From the Centers for Disease Control and Prevention, National Center for Health Statistics, National Vital Statistics System. 71 (1): 1–64. PMID35947823. Retrieved August 9, 2022.
↑Xu, Jiaquan; Murphy, Sherry; Kochanek, Kenneth D.; Arias, Elizabeth (January 29, 2026). "Mortality in the United States 2024". National Center for Health Statistics Brief / CDC. Retrieved February 1, 2026.
↑"America's Changing Religious Landscape". Pew Forum on Religion & Public Life. Pew Research Center's Religion & Public Life Project. May 12, 2015. Retrieved October 9, 2016.
↑"Catholics". Adherents.com. Archived from the original on October 3, 2003. Retrieved September 19, 2011.
↑"Section 1. Population"(PDF). Statistical Abstract of the United States: 2004–2005. U.S. Census Bureau. p.55. Retrieved June 29, 2008. (Table No. 67. Self-described religious identification of adult population: 1990 and 2001; data for 2001).
↑"How Are We Counted?". American Citizens Abroad. April 2017. Retrieved 22 September 2019. The Federal Voting Assistance Program (FVAP) estimates that there are 4.5 million to 6.5 million overseas Americans while the State Department's most recent calculation (April 2015) of US citizens living overseas is 8.7 million{...}US citizens living outside the US who are not employed by the US Government, including dependents living with them – Not counted in the census.
↑Those are traditions and denominations that trace their history back to the Protestant Reformation or otherwise heavily borrow from the practices and beliefs of the Protestant Reformers.
123456This is more of a movement then an institutionalized denomination.
↑Denominations that don't fit in the subsets mentioned above.
↑Those are traditions and denominations that trace their origin back to the Great Awakenings and/or are joined together by a common belief that Christianity should be restored along the lines of what is known about the apostolic early church.
↑The Holiness movement is an interdenominational movement that spreads over multiple traditions (Methodist, Quakers, Anabaptist, Baptist, etc.). However, here are mentioned only those denominations that are part of Restorationism as well as the Holiness movement, but are not part of any other Protestant tradition.
This page is based on this Wikipedia article Text is available under the CC BY-SA 4.0 license; additional terms may apply. Images, videos and audio are available under their respective licenses.