According to the United Nations, Costa Rica had an estimated population of 5,265,575 people as of 2024.[4]White people make up 65.8% of the population, 17.8% identity as mestizos, 7.8% are black people (including mixed race), 2.4% Amerindians, and 6.2% other/none.[4]
In 2010, just under 3% of the population was of African descent. These are called Afro-Costa Ricans or West Indians and are English-speaking descendants of 19th-century black Jamaican immigrant workers. Another 1% is composed of those of Chinese origin, and less than 1% are West Asian, mainly of Lebanese descent but also Palestinians. The 2011 Census provided the following data: whites and mestizos make up 83.4% of the population, 7% are black people (including mixed race), 2.4% Amerindians, 0.2% Chinese, and 7% other/none.[citation needed]
Immigration to Costa Rica made up 9% of the population in 2012. This included permanent settlers as well as migrants who were hoping to reach the U.S.[5] In 2015, there were some 420,000 immigrants in Costa Rica[6] and the number of asylum seekers (mainly from Honduras, El Salvador, Guatemala and Nicaragua) rose to more than 110,000.[7] An estimated 10% of the Costa Rican population in 2014 was made up of Nicaraguans.[8] There is also a community of North American retirees from the United States and Canada, followed by relatively large numbers of European Union expatriates (chiefly Scandinavians and from Germany) come to retire as well, and Australians.[9]
Despite a low fertility rate of 1.67 children per woman (2024),[10] the population still grows steadily due to immigration and a relatively young population.
The indigenous population today numbers about 60,000 (just over 1% of the population), with some Miskito and Garifuna (a population of mixed African and Carib Amerindian descent) living in the coastal regions.
Costa Rica's emigration is the smallest in the Caribbean Basin and is among the smallest in the Americas. By 2015 about just 133,185 (2.77%) of the country's people live in another country as immigrants. The main destination countries are the United States (85,924), Nicaragua (10,772), Panama (7,760), Canada (5,039), Spain (3,339), Mexico (2,464), Germany (1,891), Italy (1,508), Guatemala (1,162) and Venezuela (1,127).[11]
In 2021, Costa Rica had a population of 5,153,957. The population is increasing at a rate of 1.5% per year. According to current trends, the population will increase to 9,158,000 in about 46 years.[12] The population density is 94 people per square km, the third highest in Central America.
Approximately 20% lived in rural areas and 80% in urban areas. The rate of urbanization estimated for the period 2005–2015 is 2.74% per annum,[13] one of the highest among developing countries. About 75% of the population lives above 500 meters, where the temperature is cooler and milder.
The 2011 census counted a population of 4.3 million people[14] distributed among the following groups: 71.1% Whites or Castizos,17% Mestizo, 6.7% Black/Mulatto mixed race, 2.4% Native American, 1.1% Black or Afro-Caribbean; the census showed 1.1% as Other.[15]
In 2011, there were over 104,000 Native American or indigenous inhabitants, representing 2.4% of the population. Most of them lived in secluded reservations, distributed among eight ethnic groups: Quitirrisí (in the Central Valley), Matambú or Chorotega (Guanacaste), Maleku (northern Alajuela), Bribri (southern Atlantic), Cabécar (Cordillera de Talamanca), Guaymí (southern Costa Rica, along the Panamá border), Boruca (southern Costa Rica) and Térraba (southern Costa Rica).
Costa Ricans of European origin are primarily of Spanish descent,[16] with significant numbers of Italian, German, English, Dutch, French, Irish, Portuguese, and Polish families, as well as a sizable Jewish community. The majority of the Afro-Costa Ricans are Creole English-speaking descendants of 19th century black Jamaican immigrant workers.
Costa Rican school children
The 2011 census classified 83.6% of the population as white and Mestizo; the latter have combined European and Native American descent. The Mulatto segment (mix of white and black) represented 6.7%, and Indigenous people made up 2.4% of the population.[16] Native and European mixed blood populations are far less than in other Latin American countries. Exceptions are the Guanacaste province, where almost half the population is visibly mestizo, a legacy of the more pervasive unions between Spanish colonists and Chorotega Amerindians through several generations, and Limón, where the vast majority of the Afro-Costa Rican community lives.
According to census data the vast majority of the population identifies itself as white or mestizo. The indigenous Amerindian population only constitutes 2.4% of the population in 2011, but has gone up from only 0.3% in 1950. About 7% has African roots.
Population of Costa Rica according to ethnic group[23]
European Costa Ricans are people from Costa Rica whose ancestry lies within the continent of Europe, most notably Spain. According to DNA studies, around 75%[27] of the population have some level of European ancestry.[24]
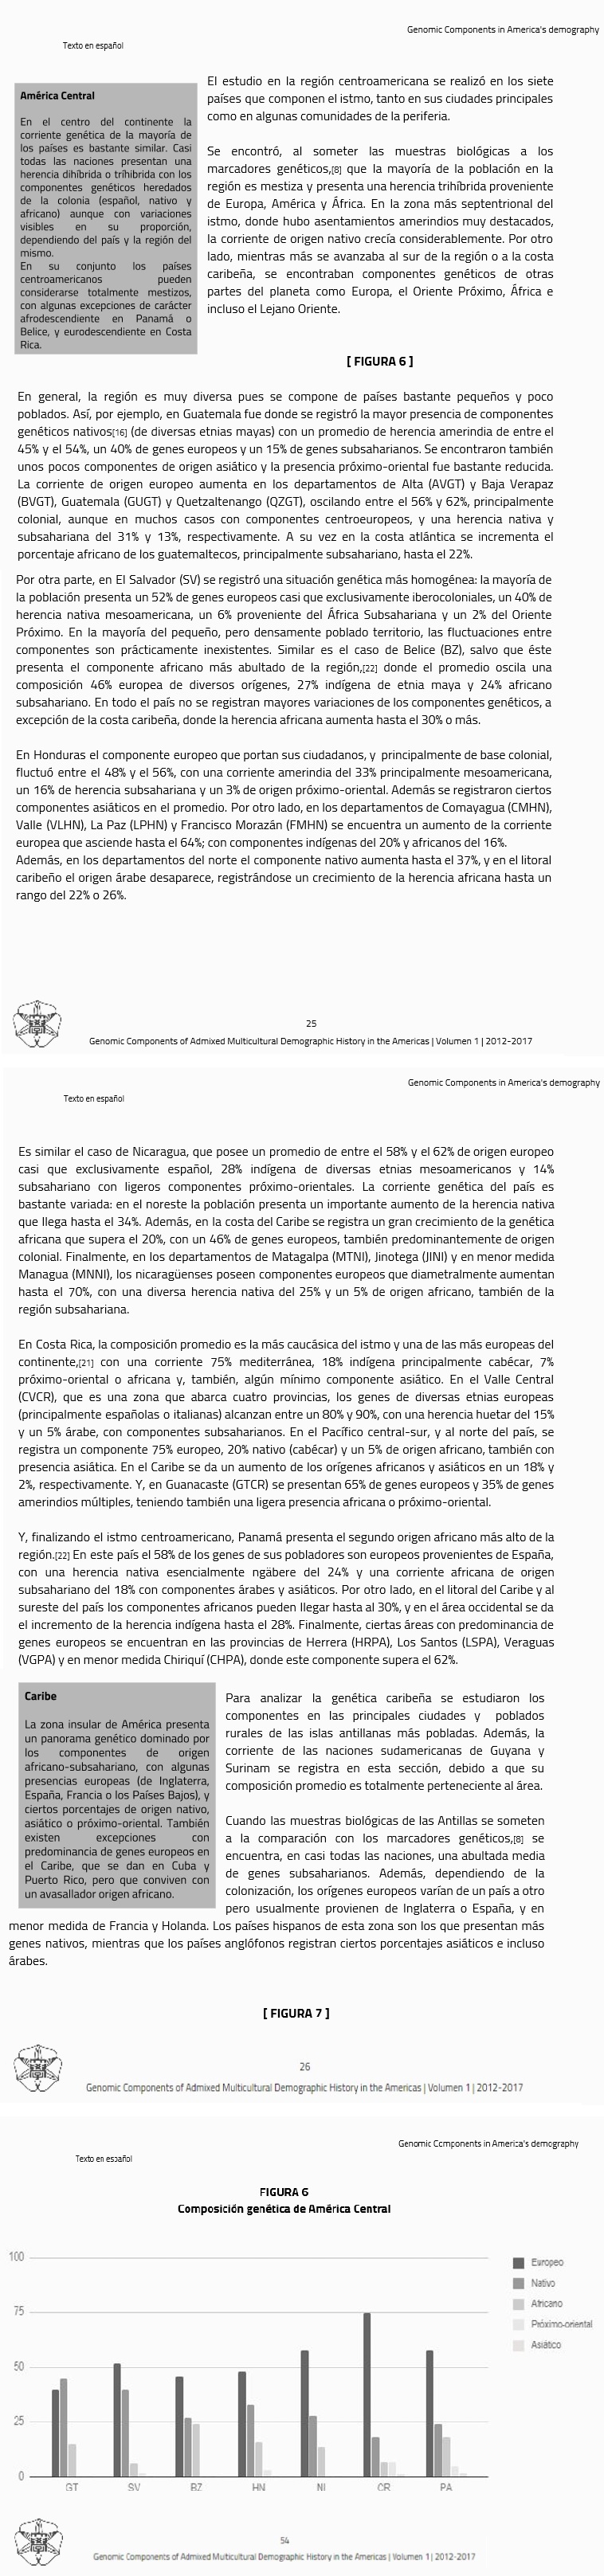
Percentages of the Costa Rican population by race are known as the national census, which includes the question of ethnicity in its form. As of 2012, 65.80% of Costa Ricans identify themselves as white/castizo and 17.80% as mestizo, giving around over 80% of the Caucasian population. This, however, is based on self-identification and not on scientific studies. According to the PLoSGenetics Geographic Patterns of Genome Admixture in Latin American Mestizos study of 2012, Costa Ricans have 73% of European ancestry, 25% Amerindian, and 2% African.[28] According to CIA Factbook, Costa Rica has a white or Castizo population of 83.6%.[16]
After independence, large migrations of wealthy Americans, Germans, French and British businessmen[29] came to the country encouraged by the government and followed by their families and employees (many of them technicians and professionals), thus creating colonies and mixing with the population, especially the high and middle classes.[30]
According to the World Factbook, the main faiths are Roman Catholic (76.3%), Evangelical (13.7%), Jehovah's Witnesses (1.3%), other Protestant (0.7%), other (4.8%), and none (3.2%).
The most recent nationwide survey of religion in Costa Rica, conducted in 2007 by the University of Costa Rica, found that 70.5 percent of the population identify themselves as Roman Catholics (with 44.9 percent practicing, 25.6 percent nonpracticing), 13.8 percent are Evangelical Protestants, 11.3 percent report that they do not have a religion, and 4.3 percent declare that they belong to another religion.[33]
Apart from the dominant Catholic religion, several other religious groups exist in the country.[33]Methodist, Lutheran, Episcopal, Baptist, and other Protestant groups have significant membership.[33]The Church of Jesus Christ of Latter-day Saints (LDS Church) claims more than 35,000 members and has a temple in San José that served as a regional worship center for Costa Rica, Panama, Nicaragua, and Honduras.[34]
Although they represent less than 1 percent of the population, Jehovah's Witnesses have a strong presence on the Caribbean coast.[33] Seventh-day Adventists operate a university that attracts students from throughout the Caribbean Basin.[33] The Unification Church maintains its continental headquarters for Latin America in San José.[33]
Non-Christian religious groups, including followers of Judaism, Islam, Taoism, Hare Krishna, Paganism, Wicca, Scientology, Tenrikyo, and the Baháʼí Faith, claim membership throughout the country, with the majority of worshipers residing in the Central Valley (the area of the capital).[33] While there is no general correlation between religion and ethnicity, indigenous peoples are more likely to practice animism than other religions.[33]
Article 75 of the Costa Rican Constitution states that the "Catholic, Apostolic, and Roman Religion is the official religion of the Republic."[35] That same article provides for freedom of religion. The government respects this right.[33] The US government found no reports of societal abuses or discrimination based on religious belief or practice in 2007.[33]
Migration
Emigration
Costa Rican emigration is among the smallest in the Caribbean Basin. About 2% of the country's population lives in another country as immigrants. The main destination countries are the United States, Spain, Mexico, and other Central American countries. In 2005, 127,061 Costa Ricans lived in another country as immigrants. Remittance s were $513,000,000 in 2006, which represented 2.3% of the national GDP.
Costa Rica's immigration is among the largest in the Caribbean Basin. According to the 2011 census, 385,899 residents were born abroad.[36] The vast majority were born in Nicaragua (287,766). Other countries of origin were Colombia (20,514), United States (16,898), Spain (16,482) and Panama (11,250). Outward remittances were $246,000,000 in 2006.
Migrants
According to the World Bank, about 489,200 migrants lived in the country in 2010; mainly from Nicaragua, Panama, El Salvador, Honduras, Guatemala, and Belize, while 125,306 Costa Ricans live abroad in the United States, Panama, Nicaragua, Spain, Mexico, Canada, Germany, Venezuela, Dominican Republic, and Ecuador.[37] The number of migrants declined in later years but in 2015, there were some 420,000 immigrants in Costa Rica[6] and the number of asylum seekers (mainly from Honduras, El Salvador, Guatemala and Nicaragua) rose to more than 110,000, a fivefold increase from 2012.[7] In 2016, the country was called a "magnet" for migrants from South and Central America and other countries who were hoping to reach the U.S.[38][39]
↑Costa Rica - Emigrantes totales (in Spanish) Según los últimos datos publicados Costa Rica tiene 133.185 emigrantes, lo que supone un 2,77% de la población de Costa Rica. Si miramos el ranking de emigrantes vemos que tiene un porcentaje de emigrantes medio, ya que está en el puesto 44º de los 195 del ranking de emigrantes.
This page is based on this Wikipedia article Text is available under the CC BY-SA 4.0 license; additional terms may apply. Images, videos and audio are available under their respective licenses.


