Related Research Articles

A census is the procedure of systematically acquiring, recording and calculating population information about the members of a given population. This term is used mostly in connection with national population and housing censuses; other common censuses include censuses of agriculture, traditional culture, business, supplies, and traffic censuses. The United Nations (UN) defines the essential features of population and housing censuses as "individual enumeration, universality within a defined territory, simultaneity and defined periodicity", and recommends that population censuses be taken at least every ten years. UN recommendations also cover census topics to be collected, official definitions, classifications and other useful information to co-ordinate international practices.

The demographics of Japan include birth and death rates, age distribution, population density, ethnicity, education level, healthcare system of the populace, economic status, religious affiliations, and other aspects regarding the Japanese population. According to the United Nations, the population of Japan was roughly 126.4 million people, and peaked at 128.5 million people in 2010. It is the 6th-most populous country in Asia, and the 11th-most populous country in the world.

The demographics of North Korea are determined through national censuses and international estimates. The Central Bureau of Statistics of North Korea conducted the most recent census in 2008, where the population reached 24 million inhabitants. The population density is 199.54 inhabitants per square kilometre, and the 2014 estimated life expectancy is 69.81 years. In 1980, the population rose at a near consistent, but low, rate. Since 2000, North Korea's birth rate has exceeded its death rate; the natural growth is positive. In terms of age structure, the population is dominated by the 15–64-year-old segment (68.09%). The median age of the population is 32.9 years, and the gender ratio is 0.95 males to 1.00 female. Since the early 1990s, the birth rate has been fairly stable, with an average of 2 children per woman, down from an average of 3 in the early 1980s.

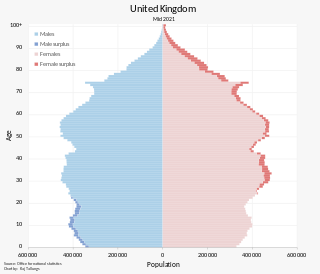
The population of the United Kingdom was estimated at 67,596,281 in 2022. It is the 21st most populated country in the world and has a population density of 279 people per square kilometre, with England having significantly greater density than Wales, Scotland, and Northern Ireland. Almost a third of the population lives in south east England, which is predominantly urban and suburban, with 8,866,180 people in the capital city, London, whose population density was 5,640 inhabitants per square kilometre (14,600/sq mi) in 2022.

Demography is the statistical study of human populations: their size, composition, and how they change through the interplay of fertility (births), mortality (deaths), and migration.

This is a demography of the population of Bhutan including population density, ethnicity, education level, health of the populace, economic status, religious affiliations and other aspects of the population.

The United States had an official estimated resident population of 334,914,895 on July 1, 2023, according to the U.S. Census Bureau. This figure includes the 50 states and Washington, D.C. but excludes the population of five unincorporated U.S. territories as well as several minor island possessions. The United States is the third most populous country in the world, and the most populous in the Americas and the Western Hemisphere. The Census Bureau showed a population increase of 0.4% for the twelve-month period ending in July 2022, below the world average annual rate of 0.9%. The total fertility rate in the United States estimated for 2022 is 1.665 children per woman, which is below the replacement fertility rate of approximately 2.1. By several metrics, including racial and ethnic background, religious affiliation, and percentage of rural and urban divide, Illinois is the most representative of the larger demography of the United States.
Population decline, also known as depopulation, is a reduction in a human population size. Throughout history, Earth's total human population has continued to grow; however, current projections suggest that this long-term trend of steady population growth may be coming to an end.

In actuarial science and demography, a life table is a table which shows, for each age, the probability that a person of that age will die before their next birthday. In other words, it represents the survivorship of people from a certain population. They can also be explained as a long-term mathematical way to measure a population's longevity. Tables have been created by demographers including John Graunt, Reed and Merrell, Keyfitz, and Greville.

Population censuses / by-censuses in Hong Kong are conducted by the Census and Statistics Department (C&SD) of the Hong Kong SAR Government. The aim is to provide up-to-date benchmark statistics on the demographic and socio-economic characteristics of the population and on its geographical distribution. Since 1961, a population census has been conducted in Hong Kong every 10 years and a by-census in the middle of the intercensal period. The last census, 2021 population census in Hong Kong was conducted by C&SD from 23 June to 4 August 2021.

As of 2020, Alaska has a population of 733,391.
In demographics, an intercensal estimate is an estimate of population between official census dates with both of the census counts being known. Some nations produce regular intercensal estimates while others do not. Intercensal estimates can be less or more informative than official census figures, depending on methodology, completeness, accuracy and date of data, and can be released by nations, subnational entities, or other organizations including those not affiliated with governments. They differ from population projections as they are from past dates, although intercensal estimates can be used to form population projections.
The Population Estimates Program (PEP) is a program of the U.S. Census Bureau that publishes annual population estimates and estimates of birth, death, and international migration rates for people in the United States. In addition to publishing those aggregate estimates for the entire country, the program also publishes those yearly estimates by age, sex, race, and Hispanic origin at the national, state, county and city and town level. By doing so, the Population Estimates Program provides up-to-date information on how the size and distribution of the US population has changed each year since the most recent 10-year US Census.

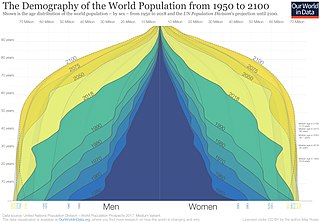
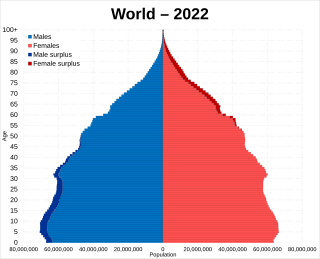
Earth has a human population of over 8 billion as of 2024, with an overall population density of 50 people per km2. Nearly 60% of the world's population lives in Asia, with almost 2.8 billion in the countries of India and China combined. The percentage shares of China, India and rest of South Asia of the world population have remained at similar levels for the last few thousand years of recorded history. The world's literacy rate has increased dramatically in the last 40 years, from 66.7% in 1979 to 86.3% today. Lower literacy levels are mostly attributable to poverty. Lower literacy rates are found mostly in South Asia and Sub-Saharan Africa.
The racial and ethnic demographics of the United States have changed dramatically throughout its history.
Beyond 2011, also known as The Beyond 2011 Programme, was a project initiated by the UK Statistics Authority to look at the alternatives to running a UK census in 2021. In 2008, the Treasury Select Committee had expressed concerns about the increasing cost of running the census and inaccuracies in data gathered only every ten years. In 2010 the newly elected coalition government reiterated such concerns responding to a report by the UK Statistics Authority.

The Kosovo Agency of Statistics monitors various demographic features of the population of Kosovo, such as population density, ethnicity, education level, health of the populace, economic status, religious affiliations and other aspects of the population. Censuses, normally conducted at ten-year intervals, record the demographic characteristics of the population. According to the first census conducted after the 2008 declaration of independence in 2011, the permanent population of Kosovo had reached 1,810,366.
The 2018 New Zealand census was the thirty-fourth national census in New Zealand, which took place on Tuesday 6 March 2018. The population of New Zealand was counted as 4,699,755 – an increase of 457,707 (10.79%) over the 2013 census.
References
- ↑ "Statista - The Statistics Portal". Statista. Retrieved 2024-06-28.
- ↑ "Demographics: How to Collect, Analyze, and Use Demographic Data". Investopedia. Retrieved 2024-06-28.
- ↑ "Population Pyramid". education.nationalgeographic.org. Retrieved 2024-06-28.
- ↑ "Life Table: Meaning, Types and Importance". Sociology Discussion - Discuss Anything About Sociology. 2016-07-21. Retrieved 2024-06-28.