
In probability theory and statistics, a normal distribution or Gaussian distribution is a type of continuous probability distribution for a real-valued random variable. The general form of its probability density function is The parameter is the mean or expectation of the distribution, while the parameter is the variance. The standard deviation of the distribution is (sigma). A random variable with a Gaussian distribution is said to be normally distributed, and is called a normal deviate.

In statistics, the standard deviation is a measure of the amount of variation of the values of a variable about its mean. A low standard deviation indicates that the values tend to be close to the mean of the set, while a high standard deviation indicates that the values are spread out over a wider range. The standard deviation is commonly used in the determination of what constitutes an outlier and what does not.

In probability theory and statistics, skewness is a measure of the asymmetry of the probability distribution of a real-valued random variable about its mean. The skewness value can be positive, zero, negative, or undefined.

In probability theory and statistics, the negative binomial distribution is a discrete probability distribution that models the number of failures in a sequence of independent and identically distributed Bernoulli trials before a specified (non-random) number of successes occurs. For example, we can define rolling a 6 on some dice as a success, and rolling any other number as a failure, and ask how many failure rolls will occur before we see the third success. In such a case, the probability distribution of the number of failures that appear will be a negative binomial distribution.

In probability theory, a log-normal (or lognormal) distribution is a continuous probability distribution of a random variable whose logarithm is normally distributed. Thus, if the random variable X is log-normally distributed, then Y = ln(X) has a normal distribution. Equivalently, if Y has a normal distribution, then the exponential function of Y, X = exp(Y), has a log-normal distribution. A random variable which is log-normally distributed takes only positive real values. It is a convenient and useful model for measurements in exact and engineering sciences, as well as medicine, economics and other topics (e.g., energies, concentrations, lengths, prices of financial instruments, and other metrics).
In probability theory, Chebyshev's inequality provides an upper bound on the probability of deviation of a random variable from its mean. More specifically, the probability that a random variable deviates from its mean by more than is at most , where is any positive constant and is the standard deviation.
In statistical inference, specifically predictive inference, a prediction interval is an estimate of an interval in which a future observation will fall, with a certain probability, given what has already been observed. Prediction intervals are often used in regression analysis.
In probability theory and statistics, the coefficient of variation (CV), also known as normalized root-mean-square deviation (NRMSD), percent RMS, and relative standard deviation (RSD), is a standardized measure of dispersion of a probability distribution or frequency distribution. It is defined as the ratio of the standard deviation to the mean , and often expressed as a percentage ("%RSD"). The CV or RSD is widely used in analytical chemistry to express the precision and repeatability of an assay. It is also commonly used in fields such as engineering or physics when doing quality assurance studies and ANOVA gauge R&R, by economists and investors in economic models, and in psychology/neuroscience.

In statistics, a multimodaldistribution is a probability distribution with more than one mode. These appear as distinct peaks in the probability density function, as shown in Figures 1 and 2. Categorical, continuous, and discrete data can all form multimodal distributions. Among univariate analyses, multimodal distributions are commonly bimodal.
In statistics, the Fano factor, like the coefficient of variation, is a measure of the dispersion of a counting process. It was originally used to measure the Fano noise in ion detectors. It is named after Ugo Fano, an Italian-American physicist.
In statistics, a pivotal quantity or pivot is a function of observations and unobservable parameters such that the function's probability distribution does not depend on the unknown parameters. A pivot need not be a statistic — the function and its 'value' can depend on the parameters of the model, but its 'distribution' must not. If it is a statistic, then it is known as an 'ancillary statistic'.
In statistics, the bias of an estimator is the difference between this estimator's expected value and the true value of the parameter being estimated. An estimator or decision rule with zero bias is called unbiased. In statistics, "bias" is an objective property of an estimator. Bias is a distinct concept from consistency: consistent estimators converge in probability to the true value of the parameter, but may be biased or unbiased.
A ratio distribution is a probability distribution constructed as the distribution of the ratio of random variables having two other known distributions. Given two random variables X and Y, the distribution of the random variable Z that is formed as the ratio Z = X/Y is a ratio distribution.
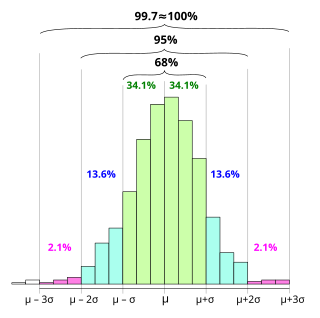
In statistics, the 68–95–99.7 rule, also known as the empirical rule, and sometimes abbreviated 3sr, is a shorthand used to remember the percentage of values that lie within an interval estimate in a normal distribution: approximately 68%, 95%, and 99.7% of the values lie within one, two, and three standard deviations of the mean, respectively.
In probability and statistics, the Tweedie distributions are a family of probability distributions which include the purely continuous normal, gamma and inverse Gaussian distributions, the purely discrete scaled Poisson distribution, and the class of compound Poisson–gamma distributions which have positive mass at zero, but are otherwise continuous. Tweedie distributions are a special case of exponential dispersion models and are often used as distributions for generalized linear models.
In probability and statistics, the class of exponential dispersion models (EDM), also called exponential dispersion family (EDF), is a set of probability distributions that represents a generalisation of the natural exponential family. Exponential dispersion models play an important role in statistical theory, in particular in generalized linear models because they have a special structure which enables deductions to be made about appropriate statistical inference.
Exact statistics, such as that described in exact test, is a branch of statistics that was developed to provide more accurate results pertaining to statistical testing and interval estimation by eliminating procedures based on asymptotic and approximate statistical methods. The main characteristic of exact methods is that statistical tests and confidence intervals are based on exact probability statements that are valid for any sample size. Exact statistical methods help avoid some of the unreasonable assumptions of traditional statistical methods, such as the assumption of equal variances in classical ANOVA. They also allow exact inference on variance components of mixed models.

In probability theory and statistics, the Poisson distribution is a discrete probability distribution that expresses the probability of a given number of events occurring in a fixed interval of time if these events occur with a known constant mean rate and independently of the time since the last event. It can also be used for the number of events in other types of intervals than time, and in dimension greater than 1.
Taylor's power law is an empirical law in ecology that relates the variance of the number of individuals of a species per unit area of habitat to the corresponding mean by a power law relationship. It is named after the ecologist who first proposed it in 1961, Lionel Roy Taylor (1924–2007). Taylor's original name for this relationship was the law of the mean. The name Taylor's law was coined by Southwood in 1966.

In probability theory and statistics, the Hermite distribution, named after Charles Hermite, is a discrete probability distribution used to model count data with more than one parameter. This distribution is flexible in terms of its ability to allow a moderate over-dispersion in the data.


