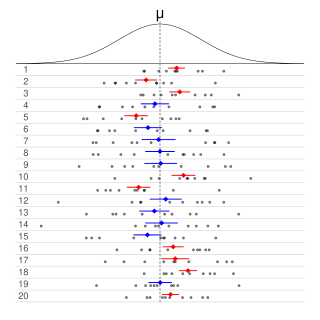
Analysis of variance (ANOVA) is a collection of statistical models and their associated estimation procedures used to analyze the differences among means. ANOVA was developed by the statistician Ronald Fisher. ANOVA is based on the law of total variance, where the observed variance in a particular variable is partitioned into components attributable to different sources of variation. In its simplest form, ANOVA provides a statistical test of whether two or more population means are equal, and therefore generalizes the t-test beyond two means. In other words, the ANOVA is used to test the difference between two or more means.
Biostatistics is a branch of statistics that applies statistical methods to a wide range of topics in biology. It encompasses the design of biological experiments, the collection and analysis of data from those experiments and the interpretation of the results.

The design of experiments, also known as experiment design or experimental design, is the design of any task that aims to describe and explain the variation of information under conditions that are hypothesized to reflect the variation. The term is generally associated with experiments in which the design introduces conditions that directly affect the variation, but may also refer to the design of quasi-experiments, in which natural conditions that influence the variation are selected for observation.
Observational error is the difference between a measured value of a quantity and its unknown true value. Such errors are inherent in the measurement process; for example lengths measured with a ruler calibrated in whole centimeters will have a measurement error of several millimeters. The error or uncertainty of a measurement can be estimated, and is specified with the measurement as, for example, 32.3 ± 0.5 cm.

Statistics is the discipline that concerns the collection, organization, analysis, interpretation, and presentation of data. In applying statistics to a scientific, industrial, or social problem, it is conventional to begin with a statistical population or a statistical model to be studied. Populations can be diverse groups of people or objects such as "all people living in a country" or "every atom composing a crystal". Statistics deals with every aspect of data, including the planning of data collection in terms of the design of surveys and experiments.

An experiment is a procedure carried out to support or refute a hypothesis, or determine the efficacy or likelihood of something previously untried. Experiments provide insight into cause-and-effect by demonstrating what outcome occurs when a particular factor is manipulated. Experiments vary greatly in goal and scale but always rely on repeatable procedure and logical analysis of the results. There also exist natural experimental studies.
In statistical hypothesis testing, a result has statistical significance when a result at least as "extreme" would be very infrequent if the null hypothesis were true. More precisely, a study's defined significance level, denoted by , is the probability of the study rejecting the null hypothesis, given that the null hypothesis is true; and the p-value of a result, , is the probability of obtaining a result at least as extreme, given that the null hypothesis is true. The result is statistically significant, by the standards of the study, when . The significance level for a study is chosen before data collection, and is typically set to 5% or much lower—depending on the field of study.
In scientific research, the null hypothesis is the claim that the effect being studied does not exist. The null hypothesis can also be described as the hypothesis in which no relationship exists between two sets of data or variables being analyzed. If the null hypothesis is true, any experimentally observed effect is due to chance alone, hence the term "null". In contrast with the null hypothesis, an alternative hypothesis is developed, which claims that a relationship does exist between two variables.
In statistics and psychometrics, reliability is the overall consistency of a measure. A measure is said to have a high reliability if it produces similar results under consistent conditions:
"It is the characteristic of a set of test scores that relates to the amount of random error from the measurement process that might be embedded in the scores. Scores that are highly reliable are precise, reproducible, and consistent from one testing occasion to another. That is, if the testing process were repeated with a group of test takers, essentially the same results would be obtained. Various kinds of reliability coefficients, with values ranging between 0.00 and 1.00, are usually used to indicate the amount of error in the scores."
Informally, in frequentist statistics, a confidence interval (CI) is an interval which is expected to typically contain the parameter being estimated. More specifically, given a confidence level , a CI is a random interval which contains the parameter being estimated % of the time. The confidence level, degree of confidence or confidence coefficient represents the long-run proportion of CIs that theoretically contain the true value of the parameter; this is tantamount to the nominal coverage probability. For example, out of all intervals computed at the 95% level, 95% of them should contain the parameter's true value.
In statistics, an effect size is a value measuring the strength of the relationship between two variables in a population, or a sample-based estimate of that quantity. It can refer to the value of a statistic calculated from a sample of data, the value of a parameter for a hypothetical population, or to the equation that operationalizes how statistics or parameters lead to the effect size value. Examples of effect sizes include the correlation between two variables, the regression coefficient in a regression, the mean difference, or the risk of a particular event happening. Effect sizes are a complement tool for statistical hypothesis testing, and play an important role in power analyses to assess the sample size required for new experiments. Effect size are fundamental in meta-analyses which aim to provide the combined effect size based on data from multiple studies. The cluster of data-analysis methods concerning effect sizes is referred to as estimation statistics.
Repeatability or test–retest reliability is the closeness of the agreement between the results of successive measurements of the same measure, when carried out under the same conditions of measurement. In other words, the measurements are taken by a single person or instrument on the same item, under the same conditions, and in a short period of time. A less-than-perfect test–retest reliability causes test–retest variability. Such variability can be caused by, for example, intra-individual variability and inter-observer variability. A measurement may be said to be repeatable when this variation is smaller than a predetermined acceptance criterion.
In probability theory and statistics, the coefficient of variation (CV), also known as normalized root-mean-square deviation (NRMSD), percent RMS, and relative standard deviation (RSD), is a standardized measure of dispersion of a probability distribution or frequency distribution. It is defined as the ratio of the standard deviation to the mean , and often expressed as a percentage ("%RSD"). The CV or RSD is widely used in analytical chemistry to express the precision and repeatability of an assay. It is also commonly used in fields such as engineering or physics when doing quality assurance studies and ANOVA gauge R&R, by economists and investors in economic models, and in psychology/neuroscience.
Sample size determination or estimation is the act of choosing the number of observations or replicates to include in a statistical sample. The sample size is an important feature of any empirical study in which the goal is to make inferences about a population from a sample. In practice, the sample size used in a study is usually determined based on the cost, time, or convenience of collecting the data, and the need for it to offer sufficient statistical power. In complex studies, different sample sizes may be allocated, such as in stratified surveys or experimental designs with multiple treatment groups. In a census, data is sought for an entire population, hence the intended sample size is equal to the population. In experimental design, where a study may be divided into different treatment groups, there may be different sample sizes for each group.
This glossary of statistics and probability is a list of definitions of terms and concepts used in the mathematical sciences of statistics and probability, their sub-disciplines, and related fields. For additional related terms, see Glossary of mathematics and Glossary of experimental design.
ANOVA gage repeatability and reproducibility is a measurement systems analysis technique that uses an analysis of variance (ANOVA) random effects model to assess a measurement system.
In statistics, inter-rater reliability is the degree of agreement among independent observers who rate, code, or assess the same phenomenon.
In statistics, the multiple comparisons, multiplicity or multiple testing problem occurs when one considers a set of statistical inferences simultaneously or estimates a subset of parameters selected based on the observed values.
Frequentist inference is a type of statistical inference based in frequentist probability, which treats “probability” in equivalent terms to “frequency” and draws conclusions from sample-data by means of emphasizing the frequency or proportion of findings in the data. Frequentist inference underlies frequentist statistics, in which the well-established methodologies of statistical hypothesis testing and confidence intervals are founded.

The replication crisis is an ongoing methodological crisis in which the results of many scientific studies are difficult or impossible to reproduce. Because the reproducibility of empirical results is an essential part of the scientific method, such failures undermine the credibility of theories building on them and potentially call into question substantial parts of scientific knowledge.
