A likelihood function measures how well a statistical model explains observed data by calculating the probability of seeing that data under different parameter values of the model. It is constructed from the joint probability distribution of the random variable that (presumably) generated the observations. When evaluated on the actual data points, it becomes a function solely of the model parameters.
In statistics, the likelihood-ratio test is a hypothesis test that involves comparing the goodness of fit of two competing statistical models, typically one found by maximization over the entire parameter space and another found after imposing some constraint, based on the ratio of their likelihoods. If the more constrained model is supported by the observed data, the two likelihoods should not differ by more than sampling error. Thus the likelihood-ratio test tests whether this ratio is significantly different from one, or equivalently whether its natural logarithm is significantly different from zero.
In statistics, maximum likelihood estimation (MLE) is a method of estimating the parameters of an assumed probability distribution, given some observed data. This is achieved by maximizing a likelihood function so that, under the assumed statistical model, the observed data is most probable. The point in the parameter space that maximizes the likelihood function is called the maximum likelihood estimate. The logic of maximum likelihood is both intuitive and flexible, and as such the method has become a dominant means of statistical inference.

In probability theory and statistics, the gamma distribution is a versatile two-parameter family of continuous probability distributions. The exponential distribution, Erlang distribution, and chi-squared distribution are special cases of the gamma distribution. There are two equivalent parameterizations in common use:
- With a shape parameter k and a scale parameter θ
- With a shape parameter and an inverse scale parameter , called a rate parameter.

In statistics, the logistic model is a statistical model that models the log-odds of an event as a linear combination of one or more independent variables. In regression analysis, logistic regression estimates the parameters of a logistic model. In binary logistic regression there is a single binary dependent variable, coded by an indicator variable, where the two values are labeled "0" and "1", while the independent variables can each be a binary variable or a continuous variable. The corresponding probability of the value labeled "1" can vary between 0 and 1, hence the labeling; the function that converts log-odds to probability is the logistic function, hence the name. The unit of measurement for the log-odds scale is called a logit, from logistic unit, hence the alternative names. See § Background and § Definition for formal mathematics, and § Example for a worked example.
In probability and statistics, an exponential family is a parametric set of probability distributions of a certain form, specified below. This special form is chosen for mathematical convenience, including the enabling of the user to calculate expectations, covariances using differentiation based on some useful algebraic properties, as well as for generality, as exponential families are in a sense very natural sets of distributions to consider. The term exponential class is sometimes used in place of "exponential family", or the older term Koopman–Darmois family. Sometimes loosely referred to as "the" exponential family, this class of distributions is distinct because they all possess a variety of desirable properties, most importantly the existence of a sufficient statistic.
In information geometry, the Fisher information metric is a particular Riemannian metric which can be defined on a smooth statistical manifold, i.e., a smooth manifold whose points are probability measures defined on a common probability space. It can be used to calculate the informational difference between measurements.
In statistics, the score is the gradient of the log-likelihood function with respect to the parameter vector. Evaluated at a particular point of the parameter vector, the score indicates the steepness of the log-likelihood function and thereby the sensitivity to infinitesimal changes to the parameter values. If the log-likelihood function is continuous over the parameter space, the score will vanish at a local maximum or minimum; this fact is used in maximum likelihood estimation to find the parameter values that maximize the likelihood function.
In mathematical statistics, the Fisher information is a way of measuring the amount of information that an observable random variable X carries about an unknown parameter θ of a distribution that models X. Formally, it is the variance of the score, or the expected value of the observed information.
In mathematical statistics, the Kullback–Leibler (KL) divergence, denoted , is a type of statistical distance: a measure of how one reference probability distribution P is different from a second probability distribution Q. Mathematically, it is defined as
In statistics, the score test assesses constraints on statistical parameters based on the gradient of the likelihood function—known as the score—evaluated at the hypothesized parameter value under the null hypothesis. Intuitively, if the restricted estimator is near the maximum of the likelihood function, the score should not differ from zero by more than sampling error. While the finite sample distributions of score tests are generally unknown, they have an asymptotic χ2-distribution under the null hypothesis as first proved by C. R. Rao in 1948, a fact that can be used to determine statistical significance.
In statistics, the Wald test assesses constraints on statistical parameters based on the weighted distance between the unrestricted estimate and its hypothesized value under the null hypothesis, where the weight is the precision of the estimate. Intuitively, the larger this weighted distance, the less likely it is that the constraint is true. While the finite sample distributions of Wald tests are generally unknown, it has an asymptotic χ2-distribution under the null hypothesis, a fact that can be used to determine statistical significance.
In Bayesian statistics, the Jeffreys prior is a non-informative prior distribution for a parameter space. Named after Sir Harold Jeffreys, its density function is proportional to the square root of the determinant of the Fisher information matrix:
In statistics, the delta method is a method of deriving the asymptotic distribution of a random variable. It is applicable when the random variable being considered can be defined as a differentiable function of a random variable which is asymptotically Gaussian.
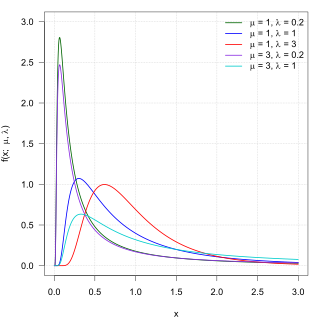
In probability theory, the inverse Gaussian distribution is a two-parameter family of continuous probability distributions with support on (0,∞).
In statistical quality control, the CUSUM is a sequential analysis technique developed by E. S. Page of the University of Cambridge. It is typically used for monitoring change detection. CUSUM was announced in Biometrika, in 1954, a few years after the publication of Wald's sequential probability ratio test (SPRT).
In statistical hypothesis testing, a uniformly most powerful (UMP) test is a hypothesis test which has the greatest power among all possible tests of a given size α. For example, according to the Neyman–Pearson lemma, the likelihood-ratio test is UMP for testing simple (point) hypotheses.

In probability theory and statistics, the Hermite distribution, named after Charles Hermite, is a discrete probability distribution used to model count data with more than one parameter. This distribution is flexible in terms of its ability to allow a moderate over-dispersion in the data.
Exponential Tilting (ET), Exponential Twisting, or Exponential Change of Measure (ECM) is a distribution shifting technique used in many parts of mathematics. The different exponential tiltings of a random variable is known as the natural exponential family of .
In statistics, when selecting a statistical model for given data, the relative likelihood compares the relative plausibilities of different candidate models or of different values of a parameter of a single model.


