CUSUM

Last updated
CUSUM chart
Originally proposed byE. S. Page
Process observations
Rational subgroup sizen = 1
Measurement typeCumulative sum of a quality characteristic
Quality characteristic type Variables data
Underlying distribution Normal distribution
Performance
Size of shift to detect≤ 1.5σ
Process variation chart
Not applicable
Process mean chart
Center lineThe target value, T, of the quality characteristic
Upper control limit
Lower control limit
Plotted statistic

In statistical quality control, the CUSUM (or cumulative sum control chart ) is a sequential analysis technique developed by E. S. Page of the University of Cambridge. It is typically used for monitoring change detection. [1] CUSUM was announced in Biometrika, in 1954, a few years after the publication of Wald's sequential probability ratio test (SPRT). [2]

Contents

E. S. Page referred to a "quality number" , by which he meant a parameter of the probability distribution; for example, the mean. He devised CUSUM as a method to determine changes in it, and proposed a criterion for deciding when to take corrective action. When the CUSUM method is applied to changes in mean, it can be used for step detection of a time series.

A few years later, George Alfred Barnard developed a visualization method, the V-mask chart, to detect both increases and decreases in . [3]

Method

As its name implies, CUSUM involves the calculation of a cumulative sum (which is what makes it "sequential"). Samples from a process are assigned weights , and summed as follows:

When the value of S exceeds a certain threshold value, a change in value has been found. The above formula only detects changes in the positive direction. When negative changes need to be found as well, the min operation should be used instead of the max operation, and this time a change has been found when the value of S is below the (negative) value of the threshold value.

Page did not explicitly say that represents the likelihood function, but this is common usage.

Note that this differs from SPRT by always using zero function as the lower "holding barrier" rather than a lower "holding barrier". [1] Also, CUSUM does not require the use of the likelihood function.

As a means of assessing CUSUM's performance, Page defined the average run length (A.R.L.) metric; "the expected number of articles sampled before action is taken." He further wrote: [2]

When the quality of the output is satisfactory the A.R.L. is a measure of the expense incurred by the scheme when it gives false alarms, i.e., Type I errors (Neyman & Pearson, 1936 [4] ). On the other hand, for constant poor quality the A.R.L. measures the delay and thus the amount of scrap produced before the rectifying action is taken, i.e., Type II errors.
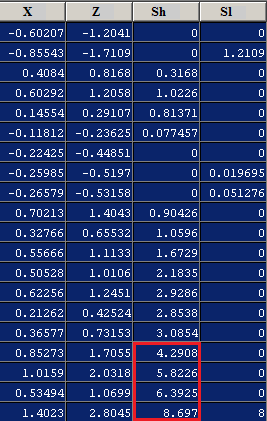
Example

The following example shows 20 observations of a process with a mean of 0 and a standard deviation of 0.5.

From the column, it can be seen that never deviates by 3 standard deviations (), so simply alerting on a high deviation will not detect a failure, whereas CUSUM shows that the value exceeds 4 at the 17th observation.

ColumnDescription
The observations of the process with an expected mean of 0 and an expected standard deviation of 0.5
The normalized observations, i.e. centered around the mean and scaled by the standard deviation
The high CUSUM value, detecting a positive anomaly,
The low CUSUM value, detecting a negative anomaly,

where is a critical level parameter (tunable, same as threshold T) that's used to adjust the sensitivity of change detection: larger makes CUSUM less sensitive to the change and vice versa.

Example cusum1.png

Example cusum2.png

Variants

Cumulative observed-minus-expected plots [1] are a related method.

Related Research Articles

<span class="mw-page-title-main">Probability distribution</span> Mathematical function for the probability a given outcome occurs in an experiment

In probability theory and statistics, a probability distribution is the mathematical function that gives the probabilities of occurrence of different possible outcomes for an experiment. It is a mathematical description of a random phenomenon in terms of its sample space and the probabilities of events.

<span class="mw-page-title-main">Random variable</span> Variable representing a random phenomenon

A random variable is a mathematical formalization of a quantity or object which depends on random events. The term 'random variable' can be misleading as its mathematical definition is not actually random nor a variable, but rather it is a function from possible outcomes in a sample space to a measurable space, often to the real numbers.

<span class="mw-page-title-main">Spearman's rank correlation coefficient</span> Nonparametric measure of rank correlation

In statistics, Spearman's rank correlation coefficient or Spearman's ρ, named after Charles Spearman and often denoted by the Greek letter (rho) or as , is a nonparametric measure of rank correlation. It assesses how well the relationship between two variables can be described using a monotonic function.

<span class="mw-page-title-main">Control chart</span> Process control tool to determine if a manufacturing process is in a state of control

Control charts are graphical plots used in production control to determine whether quality and manufacturing processes are being controlled under stable conditions. The hourly status is arranged on the graph, and the occurrence of abnormalities is judged based on the presence of data that differs from the conventional trend or deviates from the control limit line. Control charts are classified into Shewhart individuals control chart and CUSUM(CUsUM)(or cumulative sum control chart)(ISO 7870-4).

In signal processing, a finite impulse response (FIR) filter is a filter whose impulse response is of finite duration, because it settles to zero in finite time. This is in contrast to infinite impulse response (IIR) filters, which may have internal feedback and may continue to respond indefinitely.

Importance sampling is a Monte Carlo method for evaluating properties of a particular distribution, while only having samples generated from a different distribution than the distribution of interest. Its introduction in statistics is generally attributed to a paper by Teun Kloek and Herman K. van Dijk in 1978, but its precursors can be found in statistical physics as early as 1949. Importance sampling is also related to umbrella sampling in computational physics. Depending on the application, the term may refer to the process of sampling from this alternative distribution, the process of inference, or both.

<span class="mw-page-title-main">Otsu's method</span> In computer vision and image processing

In computer vision and image processing, Otsu's method, named after Nobuyuki Otsu, is used to perform automatic image thresholding. In the simplest form, the algorithm returns a single intensity threshold that separate pixels into two classes, foreground and background. This threshold is determined by minimizing intra-class intensity variance, or equivalently, by maximizing inter-class variance. Otsu's method is a one-dimensional discrete analogue of Fisher's Discriminant Analysis, is related to Jenks optimization method, and is equivalent to a globally optimal k-means performed on the intensity histogram. The extension to multi-level thresholding was described in the original paper, and computationally efficient implementations have since been proposed.

Robust statistics are statistics with good performance for data drawn from a wide range of probability distributions, especially for distributions that are not normal. Robust statistical methods have been developed for many common problems, such as estimating location, scale, and regression parameters. One motivation is to produce statistical methods that are not unduly affected by outliers. Another motivation is to provide methods with good performance when there are small departures from a parametric distribution. For example, robust methods work well for mixtures of two normal distributions with different standard deviations; under this model, non-robust methods like a t-test work poorly.

<span class="mw-page-title-main">Scoring rule</span> Measure for evaluating probabilistic forecasts

In decision theory, a scoring rule provides a summary measure for the evaluation of probabilistic predictions or forecasts. It is applicable to tasks in which predictions assign probabilities to events, i.e. one issues a probability distribution as prediction. This includes probabilistic classification of a set of mutually exclusive outcomes or classes.

In statistics the Cramér–von Mises criterion is a criterion used for judging the goodness of fit of a cumulative distribution function compared to a given empirical distribution function , or for comparing two empirical distributions. It is also used as a part of other algorithms, such as minimum distance estimation. It is defined as

Fiducial inference is one of a number of different types of statistical inference. These are rules, intended for general application, by which conclusions can be drawn from samples of data. In modern statistical practice, attempts to work with fiducial inference have fallen out of fashion in favour of frequentist inference, Bayesian inference and decision theory. However, fiducial inference is important in the history of statistics since its development led to the parallel development of concepts and tools in theoretical statistics that are widely used. Some current research in statistical methodology is either explicitly linked to fiducial inference or is closely connected to it.

The sequential probability ratio test (SPRT) is a specific sequential hypothesis test, developed by Abraham Wald and later proven to be optimal by Wald and Jacob Wolfowitz. Neyman and Pearson's 1933 result inspired Wald to reformulate it as a sequential analysis problem. The Neyman-Pearson lemma, by contrast, offers a rule of thumb for when all the data is collected.

The topological derivative is, conceptually, a derivative of a shape functional with respect to infinitesimal changes in its topology, such as adding an infinitesimal hole or crack. When used in higher dimensions than one, the term topological gradient is also used to name the first-order term of the topological asymptotic expansion, dealing only with infinitesimal singular domain perturbations. It has applications in shape optimization, topology optimization, image processing and mechanical modeling.

The combination of quality control and genetic algorithms led to novel solutions of complex quality control design and optimization problems. Quality is the degree to which a set of inherent characteristics of an entity fulfils a need or expectation that is stated, general implied or obligatory. ISO 9000 defines quality control as "A part of quality management focused on fulfilling quality requirements". Genetic algorithms are search algorithms, based on the mechanics of natural selection and natural genetics.

<span class="mw-page-title-main">Skew normal distribution</span> Probability distribution

In probability theory and statistics, the skew normal distribution is a continuous probability distribution that generalises the normal distribution to allow for non-zero skewness.

<span class="mw-page-title-main">German tank problem</span> Mathematical problem

In the statistical theory of estimation, the German tank problem consists of estimating the maximum of a discrete uniform distribution from sampling without replacement. In simple terms, suppose there exists an unknown number of items which are sequentially numbered from 1 to N. A random sample of these items is taken and their sequence numbers observed; the problem is to estimate N from these observed numbers.

<span class="mw-page-title-main">Generalized chi-squared distribution</span>

In probability theory and statistics, the generalized chi-squared distribution is the distribution of a quadratic form of a multinormal variable, or a linear combination of different normal variables and squares of normal variables. Equivalently, it is also a linear sum of independent noncentral chi-square variables and a normal variable. There are several other such generalizations for which the same term is sometimes used; some of them are special cases of the family discussed here, for example the gamma distribution.

<span class="mw-page-title-main">Step detection</span>

In statistics and signal processing, step detection is the process of finding abrupt changes in the mean level of a time series or signal. It is usually considered as a special case of the statistical method known as change detection or change point detection. Often, the step is small and the time series is corrupted by some kind of noise, and this makes the problem challenging because the step may be hidden by the noise. Therefore, statistical and/or signal processing algorithms are often required.

<span class="mw-page-title-main">Foreground detection</span>

Foreground detection is one of the major tasks in the field of computer vision and image processing whose aim is to detect changes in image sequences. Background subtraction is any technique which allows an image's foreground to be extracted for further processing.

<span class="mw-page-title-main">Event detection for WSN</span>

Wireless sensor networks (WSN) are a spatially distributed network of autonomous sensors used for monitoring an environment. Energy cost is a major limitation for WSN requiring the need for energy efficient networks and processing. One of major energy costs in WSN is the energy spent on communication between nodes and it is sometimes desirable to only send data to a gateway node when an event of interest is triggered at a sensor. Sensors will then only open communication during a probable event, saving on communication costs. Fields interested in this type of network include surveillance, home automation, disaster relief, traffic control, health care and more.

References

  1. 1 2 3 Grigg; Farewell, VT; Spiegelhalter, DJ; et al. (2003). "The Use of Risk-Adjusted CUSUM and RSPRT Charts for Monitoring in Medical Contexts". Statistical Methods in Medical Research. 12 (2): 147–170. doi:10.1177/096228020301200205. PMID   12665208.
  2. 1 2 Page, E. S. (June 1954). "Continuous Inspection Scheme". Biometrika. 41 (1/2): 100–115. doi:10.1093/biomet/41.1-2.100. hdl: 10338.dmlcz/135207 . JSTOR   2333009.
  3. Barnard, G.A. (1959). "Control charts and stochastic processes". Journal of the Royal Statistical Society . B (Methodological) (21, number 2): 239–71. JSTOR   2983801.
  4. "Sufficient statistics and uniformly most powerful tests of statistical hypotheses". Statistical Research Memoirs . I: 113–137.

Further reading