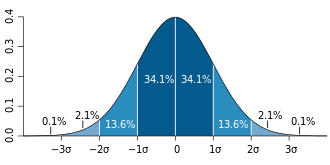
For a value that is sampled with an unbiased normally distributed error, the above depicts the proportion of samples that would fall between 0, 1, 2, and 3 standard deviations above and below the actual value.
The sampling distribution of a mean is generated by repeated sampling from the same population and recording the sample mean per sample. This forms a distribution of different sample means, and this distribution has its own mean and variance. Mathematically, the variance of the sampling mean distribution obtained is equal to the variance of the population divided by the sample size. This is because as the sample size increases, sample means cluster more closely around the population mean.
Therefore, the relationship between the standard error of the mean and the standard deviation is such that, for a given sample size, the standard error of the mean equals the standard deviation divided by the square root of the sample size.[1] In other words, the standard error of the mean is a measure of the dispersion of sample means around the population mean.
Suppose a statistically independent sample of observations is taken from a statistical population with a standard deviation of (the standard deviation of the population). The mean value calculated from the sample, , will have an associated standard error on the mean, , given by:[1]
Practically this tells us that when trying to estimate the value of a population mean, due to the factor , reducing the error on the estimate by a factor of two requires acquiring four times as many observations in the sample; reducing it by a factor of ten requires a hundred times as many observations.
Estimate
The standard deviation of the population being sampled is seldom known. Therefore, the standard error of the mean is usually estimated by replacing with the sample standard deviation instead:
As this is only an estimator for the true "standard error", it is common to see other notations here such as:
A common source of confusion occurs when failing to distinguish clearly between:
the standard deviation of the population (),
the standard deviation of the sample (),
the standard deviation of the sample mean itself (, which is the standard error), and
the estimator of the standard deviation of the sample mean (, which is the most often calculated quantity, and is also often colloquially called the standard error).
Accuracy of the estimator
When the sample size is small, using the standard deviation of the sample instead of the true standard deviation of the population will tend to systematically underestimate the population standard deviation, and therefore also the standard error. With n = 2, the underestimate is about 25%, but for n = 6, the underestimate is only 5%. Gurland and Tripathi (1971) provide a correction and equation for this effect.[4] Sokal and Rohlf (1981) give an equation of the correction factor for small samples of n < 20.[5] See unbiased estimation of standard deviation for further discussion.
Derivation
The standard error on the mean may be derived from the variance of a sum of independent random variables,[6] given the definition of variance and some properties thereof. If is a sample of independent observations from a population with mean and standard deviation , then we can define the total which due to the Bienaymé formula, will have variance
The mean of these measurements (sample mean) is given by The variance of the mean is then
where a propagation in variance is used in the 2nd equality. The standard error is, by definition, the standard deviation of which is the square root of the variance:
In other words, if there are a large number of observations per sampling ( is high compared with the population variance ), then the calculated mean per sample is expected to be close to the population mean .
Independent and identically distributed random variables with random sample size
There are cases when a sample is taken without knowing, in advance, how many observations will be acceptable according to some criterion. In such cases, the sample size is a random variable whose variation adds to the variation of such that,[7] which follows from the law of total variance.
If has a Poisson distribution, then with estimator . Hence the estimator of becomes , leading the following formula for standard error: (since the standard deviation is the square root of the variance).
In many practical applications, the true value of σ is unknown. As a result, we need to use a distribution that takes into account that spread of possible σ's. When the true underlying distribution is known to be Gaussian, although with unknown σ, then the resulting estimated distribution follows the Student t-distribution. The standard error is the standard deviation of the Student t-distribution. T-distributions are slightly different from Gaussian, and vary depending on the size of the sample. Small samples are somewhat more likely to underestimate the population standard deviation and have a mean that differs from the true population mean, and the Student t-distribution accounts for the probability of these events with somewhat heavier tails compared to a Gaussian. To estimate the standard error of a Student t-distribution it is sufficient to use the sample standard deviation "s" instead of σ, and we could use this value to calculate confidence intervals.
Note: The Student's probability distribution is approximated well by the Gaussian distribution when the sample size is over 100. For such samples one can use the latter distribution, which is much simpler. Also, even though the 'true' distribution of the population is unknown, assuming normality of the sampling distribution makes sense for a reasonable sample size, and under certain sampling conditions, see CLT. If these conditions are not met, then using a Bootstrap distribution to estimate the Standard Error is often a good workaround, but it can be computationally intensive.
An example of how (Standard Error) is used to make confidence intervals of the unknown population mean is shown. If the sampling distribution is normally distributed, the sample mean, the standard error, and the quantiles of the normal distribution can be used to calculate confidence intervals for the true population mean. The following expressions can be used to calculate the upper and lower 95% confidence limits, where is for the sample mean, is for the standard error for the sample mean (the standard deviation of sample mean values), and 1.96 is the approximate value of the 97.5 percentile point of the normal distribution:
Upper 95% limit = , and
Lower 95% limit = .
In particular, the standard error of a sample statistic (such as sample mean) is the actual or estimated standard deviation of the sample mean in the process by which it was generated. In other words, it is the actual or estimated standard deviation of the sampling distribution of the sample statistic. The notation for standard error can be any one of SE, SEM (for standard error of measurement or mean), or SE.
Standard errors provide simple measures of uncertainty in a value and are often used because:[citation needed]
in many cases, if the standard error of several individual quantities is known then the standard error of some function of the quantities can be easily calculated;
In scientific and technical literature, experimental data are often summarized either using the mean and standard deviation of the sample data or the mean with the standard error. This often leads to confusion about their interchangeability. However, the mean and standard deviation are descriptive statistics, whereas the standard error of the mean is descriptive of the random sampling process. The standard deviation of the sample data is a description of the variation in measurements, while the standard error of the mean is a probabilistic statement about how the sample size will provide a better bound on estimates of the population mean, in light of the central limit theorem.[8]
Put simply, the standard error of the sample mean is an estimate of how far the sample mean is likely to be from the population mean, whereas the standard deviation of the sample is the degree to which individuals within the sample differ from the sample mean.[9] If the population standard deviation is finite, the standard error of the mean of the sample will tend to zero with increasing sample size, because the estimate of the population mean will improve, while the standard deviation of the sample will tend to approximate the population standard deviation as the sample size increases.
Extensions
Finite population correction (FPC)
The formula given above for the standard error assumes that the population is infinite. Nonetheless, it is often used for finite populations when people are interested in measuring the process that created the existing finite population (this is called an analytic study). Though the above formula is not exactly correct when the population is finite, the difference between the finite- and infinite-population versions will be small when sampling fraction is small (e.g. a small proportion of a finite population is studied). In this case people often do not correct for the finite population, essentially treating it as an "approximately infinite" population.
If one is interested in measuring an existing finite population that will not change over time, then it is necessary to adjust for the population size (called an enumerative study). When the sampling fraction (often termed f) is large (approximately at 5% or more) in an enumerative study, the estimate of the standard error must be corrected by multiplying by a ''finite population correction'' (a.k.a.: FPC):[10][11] which, for large N: to account for the added precision gained by sampling close to a larger percentage of the population. The effect of the FPC is that the error becomes zero when the sample size n is equal to the population size N.
Expected error in the mean of A for a sample of n data points with sample bias coefficientρ. The unbiased standard error plots as the ρ=0 diagonal line with log-log slope−1⁄2.
If values of the measured quantity A are not statistically independent but have been obtained from known locations in parameter spacex, an unbiased estimate of the true standard error of the mean (actually a correction on the standard deviation part) may be obtained by multiplying the calculated standard error of the sample by the factorf: where the sample bias coefficient ρ is the widely used Prais–Winsten estimate of the autocorrelation-coefficient (a quantity between −1 and +1) for all sample point pairs. This approximate formula is for moderate to large sample sizes; the reference gives the exact formulas for any sample size, and can be applied to heavily autocorrelated time series like Wall Street stock quotes. Moreover, this formula works for positive and negative ρ alike.[12] See also unbiased estimation of standard deviation for more discussion.
↑Gurland, J; Tripathi RC (1971). "A simple approximation for unbiased estimation of the standard deviation". American Statistician. 25 (4): 30–32. doi:10.2307/2682923. JSTOR2682923.
This page is based on this Wikipedia article Text is available under the CC BY-SA 4.0 license; additional terms may apply. Images, videos and audio are available under their respective licenses.