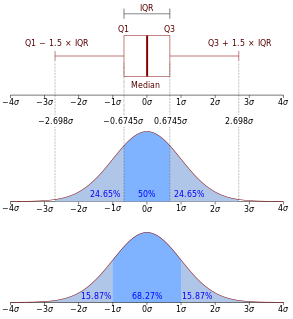
In descriptive statistics, the interquartile range (IQR), also called the midspread, middle 50%, or H‑spread, is a measure of statistical dispersion, being equal to the difference between 75th and 25th percentiles, or between upper and lower quartiles, IQR = Q3 − Q1. In other words, the IQR is the first quartile subtracted from the third quartile; these quartiles can be clearly seen on a box plot on the data. It is a trimmed estimator, defined as the 25% trimmed range, and is a commonly used robust measure of scale.

In statistics and probability theory, a median is a value separating the higher half from the lower half of a data sample, a population, or a probability distribution. For a data set, it may be thought of as "the middle" value. The basic advantage of the median in describing data compared to the mean is that it is not skewed so much by a small proportion of extremely large or small values, and so it may give a better idea of a "typical" value. For example, in understanding statistics like household income or assets, which vary greatly, the mean may be skewed by a small number of extremely high or low values. Median income, for example, may be a better way to suggest what a "typical" income is. Because of this, the median is of central importance in robust statistics, as it is the most resistant statistic, having a breakdown point of 50%: so long as no more than half the data are contaminated, the median will not give an arbitrarily large or small result.

In probability theory, a normaldistribution is a type of continuous probability distribution for a real-valued random variable. The general form of its probability density function is

In statistics, the standard deviation is a measure of the amount of variation or dispersion of a set of values. A low standard deviation indicates that the values tend to be close to the mean of the set, while a high standard deviation indicates that the values are spread out over a wider range.

In probability and statistics, Student's t-distribution is any member of a family of continuous probability distributions that arise when estimating the mean of a normally-distributed population in situations where the sample size is small and the population's standard deviation is unknown. It was developed by English statistician William Sealy Gosset under the pseudonym "Student".
In statistics, a confidence interval (CI) is a type of estimate computed from the statistics of the observed data. This proposes a range of plausible values for an unknown parameter. The interval has an associated confidence level that the true parameter is in the proposed range. The confidence level is chosen by the investigator. For a given estimation in a given sample, using a higher confidence level generates a wider confidence interval. In general terms, a confidence interval for an unknown parameter is based on sampling the distribution of a corresponding estimator.

In the military science of ballistics, circular error probable (CEP) is a measure of a weapon system's precision. It is defined as the radius of a circle; centered on the mean, whose boundary is expected to include the landing points of 50% of the rounds; said otherwise, it is the median error radius. That is, if a given munitions design has a CEP of 100 m, when 100 are targeted at the same point, 50 will fall within a circle with a radius of 100 m around their average impact point.

A Z-test is any statistical test for which the distribution of the test statistic under the null hypothesis can be approximated by a normal distribution. Z-test tests the mean of a distribution. For each significance level in the confidence interval, the Z-test has a single critical value which makes it more convenient than the Student's t-test whose critical values are defined by the sample size.

In statistics and optimization, errors and residuals are two closely related and easily confused measures of the deviation of an observed value of an element of a statistical sample from its "theoretical value". The error of an observed value is the deviation of the observed value from the (unobservable) true value of a quantity of interest, and the residual of an observed value is the difference between the observed value and the estimated value of the quantity of interest. The distinction is most important in regression analysis, where the concepts are sometimes called the regression errors and regression residuals and where they lead to the concept of studentized residuals.
In statistics, a sampling distribution or finite-sample distribution is the probability distribution of a given random-sample-based statistic. If an arbitrarily large number of samples, each involving multiple observations, were separately used in order to compute one value of a statistic for each sample, then the sampling distribution is the probability distribution of the values that the statistic takes on. In many contexts, only one sample is observed, but the sampling distribution can be found theoretically.
In statistical inference, specifically predictive inference, a prediction interval is an estimate of an interval in which a future observation will fall, with a certain probability, given what has already been observed. Prediction intervals are often used in regression analysis.
The standard error (SE) of a statistic is the standard deviation of its sampling distribution or an estimate of that standard deviation. If the statistic is the sample mean, it is called the standard error of the mean (SEM).
In statistics, propagation of uncertainty is the effect of variables' uncertainties on the uncertainty of a function based on them. When the variables are the values of experimental measurements they have uncertainties due to measurement limitations which propagate due to the combination of variables in the function.
A tolerance interval is a statistical interval within which, with some confidence level, a specified proportion of a sampled population falls. "More specifically, a 100×p%/100×(1−α) tolerance interval provides limits within which at least a certain proportion (p) of the population falls with a given level of confidence (1−α)." "A tolerance interval (TI) based on a sample is constructed so that it would include at least a proportion p of the sampled population with confidence 1−α; such a TI is usually referred to as p-content − (1−α) coverage TI." "A upper tolerance limit (TL) is simply a 1−α upper confidence limit for the 100 p percentile of the population."
In probability theory and statistics, the coefficient of variation (CV), also known as relative standard deviation (RSD), is a standardized measure of dispersion of a probability distribution or frequency distribution. It is often expressed as a percentage, and is defined as the ratio of the standard deviation to the mean . The CV or RSD is widely used in analytical chemistry to express the precision and repeatability of an assay. It is also commonly used in fields such as engineering or physics when doing quality assurance studies and ANOVA gauge R&R. In addition, CV is utilized by economists and investors in economic models.
The following is a glossary of terms used in the mathematical sciences statistics and probability.
In statistics and applications of statistics, normalization can have a range of meanings. In the simplest cases, normalization of ratings means adjusting values measured on different scales to a notionally common scale, often prior to averaging. In more complicated cases, normalization may refer to more sophisticated adjustments where the intention is to bring the entire probability distributions of adjusted values into alignment. In the case of normalization of scores in educational assessment, there may be an intention to align distributions to a normal distribution. A different approach to normalization of probability distributions is quantile normalization, where the quantiles of the different measures are brought into alignment.

In statistics, the 68–95–99.7 rule, also known as the empirical rule, is a shorthand used to remember the percentage of values that lie within a band around the mean in a normal distribution with a width of two, four and six standard deviations, respectively; more precisely, 68.27%, 95.45% and 99.73% of the values lie within one, two and three standard deviations of the mean, respectively.
In statistics, the median absolute deviation (MAD) is a robust measure of the variability of a univariate sample of quantitative data. It can also refer to the population parameter that is estimated by the MAD calculated from a sample.
In statistics, the t-statistic is the ratio of the departure of the estimated value of a parameter from its hypothesized value to its standard error. It is used in hypothesis testing via Student's t-test. The t-statistic is used in a t-test to determine if you should support or reject the null hypothesis. It is very similar to the Z-score but with the difference that t-statistic is used when the sample size is small or the population standard deviation is unknown. For example, the t-statistic is used in estimating the population mean from a sampling distribution of sample means if the population standard deviation is unknown. It is also used along with p-value when running hypothesis tests where the p-value tells us what the odds are of the results to have happened.
