Central tendency

Last updated

In statistics, a central tendency (or measure of central tendency) is a central or typical value for a probability distribution. [1]

Contents

Colloquially, measures of central tendency are often called averages. The term central tendency dates from the late 1920s. [2]

The most common measures of central tendency are the arithmetic mean, the median, and the mode. A middle tendency can be calculated for either a finite set of values or for a theoretical distribution, such as the normal distribution. Occasionally authors use central tendency to denote "the tendency of quantitative data to cluster around some central value." [2] [3]

The central tendency of a distribution is typically contrasted with its dispersion or variability; dispersion and central tendency are the often characterized properties of distributions. Analysis may judge whether data has a strong or a weak central tendency based on its dispersion.

Measures

The following may be applied to one-dimensional data. Depending on the circumstances, it may be appropriate to transform the data before calculating a central tendency. Examples are squaring the values or taking logarithms. Whether a transformation is appropriate and what it should be, depend heavily on the data being analyzed.

Arithmetic mean or simply, mean
the sum of all measurements divided by the number of observations in the data set.
Median
the middle value that separates the higher half from the lower half of the data set. The median and the mode are the only measures of central tendency that can be used for ordinal data, in which values are ranked relative to each other but are not measured absolutely.
Mode
the most frequent value in the data set. This is the only central tendency measure that can be used with nominal data, which have purely qualitative category assignments.
Generalized mean
A generalization of the Pythagorean means, specified by an exponent.
Geometric mean
the nth root of the product of the data values, where there are n of these. This measure is valid only for data that are measured absolutely on a strictly positive scale.
Harmonic mean
the reciprocal of the arithmetic mean of the reciprocals of the data values. This measure too is valid only for data that are measured absolutely on a strictly positive scale.
Weighted arithmetic mean
an arithmetic mean that incorporates weighting to certain data elements.
Truncated mean or trimmed mean
the arithmetic mean of data values after a certain number or proportion of the highest and lowest data values have been discarded.
Interquartile mean
a truncated mean based on data within the interquartile range.
Midrange
the arithmetic mean of the maximum and minimum values of a data set.
Midhinge
the arithmetic mean of the first and third quartiles.
Quasi-arithmetic mean
A generalization of the generalized mean, specified by a continuous injective function.
Trimean
the weighted arithmetic mean of the median and two quartiles.
Winsorized mean
an arithmetic mean in which extreme values are replaced by values closer to the median.

Any of the above may be applied to each dimension of multi-dimensional data, but the results may not be invariant to rotations of the multi-dimensional space.

Geometric median
the point minimizing the sum of distances to a set of sample points. This is the same as the median when applied to one-dimensional data, but it is not the same as taking the median of each dimension independently. It is not invariant to different rescaling of the different dimensions.
Quadratic mean (often known as the root mean square)
useful in engineering, but not often used in statistics. This is because it is not a good indicator of the center of the distribution when the distribution includes negative values.
Simplicial depth
the probability that a randomly chosen simplex with vertices from the given distribution will contain the given center
Tukey median
a point with the property that every halfspace containing it also contains many sample points

Solutions to variational problems

Several measures of central tendency can be characterized as solving a variational problem, in the sense of the calculus of variations, namely minimizing variation from the center. That is, given a measure of statistical dispersion, one asks for a measure of central tendency that minimizes variation: such that variation from the center is minimal among all choices of center. In a quip, "dispersion precedes location". These measures are initially defined in one dimension, but can be generalized to multiple dimensions. This center may or may not be unique. In the sense of Lp spaces, the correspondence is:

Lpdispersioncentral tendency
L0 variation ratio mode [lower-alpha 1]
L1 average absolute deviation median (geometric median) [lower-alpha 2]
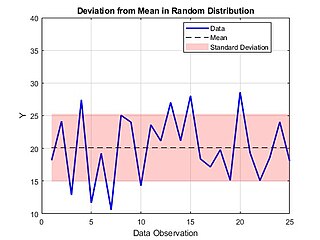
L2 standard deviation mean (centroid) [lower-alpha 3]
L maximum deviation midrange [lower-alpha 4]

The associated functions are called p-norms: respectively 0-"norm", 1-norm, 2-norm, and ∞-norm. The function corresponding to the L0 space is not a norm, and is thus often referred to in quotes: 0-"norm".

In equations, for a given (finite) data set X, thought of as a vector x = (x1,…,xn), the dispersion about a point c is the "distance" from x to the constant vector c = (c,…,c) in the p-norm (normalized by the number of points n):

For p = 0 and p = ∞ these functions are defined by taking limits, respectively as p → 0 and p → ∞. For p = 0 the limiting values are 00 = 0 and a0 = 0 or a ≠ 0, so the difference becomes simply equality, so the 0-norm counts the number of unequal points. For p = ∞ the largest number dominates, and thus the ∞-norm is the maximum difference.

Uniqueness

The mean (L2 center) and midrange (L center) are unique (when they exist), while the median (L1 center) and mode (L0 center) are not in general unique. This can be understood in terms of convexity of the associated functions (coercive functions).

The 2-norm and ∞-norm are strictly convex, and thus (by convex optimization) the minimizer is unique (if it exists), and exists for bounded distributions. Thus standard deviation about the mean is lower than standard deviation about any other point, and the maximum deviation about the midrange is lower than the maximum deviation about any other point.

The 1-norm is not strictly convex, whereas strict convexity is needed to ensure uniqueness of the minimizer. Correspondingly, the median (in this sense of minimizing) is not in general unique, and in fact any point between the two central points of a discrete distribution minimizes average absolute deviation.

The 0-"norm" is not convex (hence not a norm). Correspondingly, the mode is not unique – for example, in a uniform distribution any point is the mode.

Clustering

Instead of a single central point, one can ask for multiple points such that the variation from these points is minimized. This leads to cluster analysis, where each point in the data set is clustered with the nearest "center". Most commonly, using the 2-norm generalizes the mean to k-means clustering, while using the 1-norm generalizes the (geometric) median to k-medians clustering. Using the 0-norm simply generalizes the mode (most common value) to using the k most common values as centers.

Unlike the single-center statistics, this multi-center clustering cannot in general be computed in a closed-form expression, and instead must be computed or approximated by an iterative method; one general approach is expectation–maximization algorithms.

Information geometry

The notion of a "center" as minimizing variation can be generalized in information geometry as a distribution that minimizes divergence (a generalized distance) from a data set. The most common case is maximum likelihood estimation, where the maximum likelihood estimate (MLE) maximizes likelihood (minimizes expected surprisal), which can be interpreted geometrically by using entropy to measure variation: the MLE minimizes cross-entropy (equivalently, relative entropy, Kullback–Leibler divergence).

A simple example of this is for the center of nominal data: instead of using the mode (the only single-valued "center"), one often uses the empirical measure (the frequency distribution divided by the sample size) as a "center". For example, given binary data, say heads or tails, if a data set consists of 2 heads and 1 tails, then the mode is "heads", but the empirical measure is 2/3 heads, 1/3 tails, which minimizes the cross-entropy (total surprisal) from the data set. This perspective is also used in regression analysis, where least squares finds the solution that minimizes the distances from it, and analogously in logistic regression, a maximum likelihood estimate minimizes the surprisal (information distance).

Relationships between the mean, median and mode

For unimodal distributions the following bounds are known and are sharp: [4]

where μ is the mean, ν is the median, θ is the mode, and σ is the standard deviation.

For every distribution, [5] [6]

See also

Notes

  1. Unlike the other measures, the mode does not require any geometry on the set, and thus applies equally in one dimension, multiple dimensions, or even for categorical variables.
  2. The median is only defined in one dimension; the geometric median is a multidimensional generalization.
  3. The mean can be defined identically for vectors in multiple dimensions as for scalars in one dimension; the multidimensional form is often called the centroid.
  4. In multiple dimensions, the midrange can be define coordinate-wise (take the midrange of each coordinate), though this is not common.

Related Research Articles

In mathematics and statistics, the arithmetic mean, arithmetic average, or just the mean or average is the sum of a collection of numbers divided by the count of numbers in the collection. The collection is often a set of results from an experiment, an observational study, or a survey. The term "arithmetic mean" is preferred in some mathematics and statistics contexts because it helps distinguish it from other types of means, such as geometric and harmonic.

<span class="mw-page-title-main">Median</span> Middle quantile of a data set or probability distribution

In statistics and probability theory, the median is the value separating the higher half from the lower half of a data sample, a population, or a probability distribution. For a data set, it may be thought of as "the middle" value. The basic feature of the median in describing data compared to the mean is that it is not skewed by a small proportion of extremely large or small values, and therefore provides a better representation of the center. Median income, for example, may be a better way to describe center of the income distribution because increases in the largest incomes alone have no effect on median. For this reason, the median is of central importance in robust statistics.

A mean is quantity that has a value which is intermediate to the extreme values of a set of numbers. There are several kinds of means in mathematics, especially in statistics. Each mean serves to summarize a given group of data, often to better understand the overall value of a given data set.

<span class="mw-page-title-main">Summary statistics</span> Type of statistics

In descriptive statistics, summary statistics are used to summarize a set of observations, in order to communicate the largest amount of information as simply as possible. Statisticians commonly try to describe the observations in

<span class="mw-page-title-main">Skewness</span> Measure of the asymmetry of random variables

In probability theory and statistics, skewness is a measure of the asymmetry of the probability distribution of a real-valued random variable about its mean. The skewness value can be positive, zero, negative, or undefined.

The average absolute deviation (AAD) of a data set is the average of the absolute deviations from a central point. It is a summary statistic of statistical dispersion or variability. In the general form, the central point can be a mean, median, mode, or the result of any other measure of central tendency or any reference value related to the given data set. AAD includes the mean absolute deviation and the median absolute deviation.

In probability theory and statistics, the geometric standard deviation (GSD) describes how spread out are a set of numbers whose preferred average is the geometric mean. For such data, it may be preferred to the more usual standard deviation. Note that unlike the usual arithmetic standard deviation, the geometric standard deviation is a multiplicative factor, and thus is dimensionless, rather than having the same dimension as the input values. Thus, the geometric standard deviation may be more appropriately called geometric SD factor. When using geometric SD factor in conjunction with geometric mean, it should be described as "the range from to, and one cannot add/subtract "geometric SD factor" to/from geometric mean.

In probability and statistics, a mixture distribution is the probability distribution of a random variable that is derived from a collection of other random variables as follows: first, a random variable is selected by chance from the collection according to given probabilities of selection, and then the value of the selected random variable is realized. The underlying random variables may be random real numbers, or they may be random vectors, in which case the mixture distribution is a multivariate distribution.

In statistics, the mode is the value that appears most often in a set of data values. If X is a discrete random variable, the mode is the value x at which the probability mass function takes its maximum value. In other words, it is the value that is most likely to be sampled.

This glossary of statistics and probability is a list of definitions of terms and concepts used in the mathematical sciences of statistics and probability, their sub-disciplines, and related fields. For additional related terms, see Glossary of mathematics and Glossary of experimental design.

In statistics, the mid-range or mid-extreme is a measure of central tendency of a sample defined as the arithmetic mean of the maximum and minimum values of the data set:

Robust statistics are statistics with good performance for data drawn from a wide range of probability distributions, especially for distributions that are not normal. Robust statistical methods have been developed for many common problems, such as estimating location, scale, and regression parameters. One motivation is to produce statistical methods that are not unduly affected by outliers. Another motivation is to provide methods with good performance when there are small departures from a parametric distribution. For example, robust methods work well for mixtures of two normal distributions with different standard deviations; under this model, non-robust methods like a t-test work poorly.

In estimation theory and decision theory, a Bayes estimator or a Bayes action is an estimator or decision rule that minimizes the posterior expected value of a loss function. Equivalently, it maximizes the posterior expectation of a utility function. An alternative way of formulating an estimator within Bayesian statistics is maximum a posteriori estimation.

<span class="mw-page-title-main">Deviation (statistics)</span> Difference between a variables observed value and a reference value

In mathematics and statistics, deviation is a measure of difference between the observed value of a variable and some other value, often that variable's mean. The sign of the deviation reports the direction of that difference. The magnitude of the value indicates the size of the difference.

In statistics, the median absolute deviation (MAD) is a robust measure of the variability of a univariate sample of quantitative data. It can also refer to the population parameter that is estimated by the MAD calculated from a sample.

In probability theory and statistics, the index of dispersion, dispersion index,coefficient of dispersion,relative variance, or variance-to-mean ratio (VMR), like the coefficient of variation, is a normalized measure of the dispersion of a probability distribution: it is a measure used to quantify whether a set of observed occurrences are clustered or dispersed compared to a standard statistical model.

<span class="mw-page-title-main">Statistical dispersion</span> Statistical property quantifying how much a collection of data is spread out

In statistics, dispersion is the extent to which a distribution is stretched or squeezed. Common examples of measures of statistical dispersion are the variance, standard deviation, and interquartile range. For instance, when the variance of data in a set is large, the data is widely scattered. On the other hand, when the variance is small, the data in the set is clustered.

In statistics and probability theory, the nonparametric skew is a statistic occasionally used with random variables that take real values. It is a measure of the skewness of a random variable's distribution—that is, the distribution's tendency to "lean" to one side or the other of the mean. Its calculation does not require any knowledge of the form of the underlying distribution—hence the name nonparametric. It has some desirable properties: it is zero for any symmetric distribution; it is unaffected by a scale shift; and it reveals either left- or right-skewness equally well. In some statistical samples it has been shown to be less powerful than the usual measures of skewness in detecting departures of the population from normality.

Univariate is a term commonly used in statistics to describe a type of data which consists of observations on only a single characteristic or attribute. A simple example of univariate data would be the salaries of workers in industry. Like all the other data, univariate data can be visualized using graphs, images or other analysis tools after the data is measured, collected, reported, and analyzed.

References

  1. Weisberg H.F (1992) Central Tendency and Variability, Sage University Paper Series on Quantitative Applications in the Social Sciences, ISBN   0-8039-4007-6 p.2
  2. 1 2 Upton, G.; Cook, I. (2008) Oxford Dictionary of Statistics, OUP ISBN   978-0-19-954145-4 (entry for "central tendency")
  3. Dodge, Y. (2003) The Oxford Dictionary of Statistical Terms, OUP for International Statistical Institute. ISBN   0-19-920613-9 (entry for "central tendency")
  4. Johnson NL, Rogers CA (1951) "The moment problem for unimodal distributions". Annals of Mathematical Statistics, 22 (3) 433–439
  5. Hotelling H, Solomons LM (1932) The limits of a measure of skewness. Annals Math Stat 3, 141–114
  6. Garver (1932) Concerning the limits of a mesuare of skewness. Ann Math Stats 3(4) 141–142