Binary data

Last updated

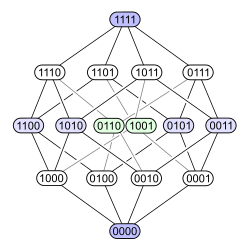
Binary data is data whose unit can take on only two possible states. These are often labelled as 0 and 1 in accordance with the binary numeral system and Boolean algebra.

Contents

Binary data occurs in many different technical and scientific fields, where it can be called by different names including bit (binary digit) in computer science, truth value in mathematical logic and related domains and binary variable in statistics.

Mathematical and combinatoric foundations

A discrete variable that can take only one state contains zero information, and 2 is the next natural number after 1. That is why the bit, a variable with only two possible values, is a standard primary unit of information.

A collection of n bits may have 2n states: see binary number for details. Number of states of a collection of discrete variables depends exponentially on the number of variables, and only as a power law on number of states of each variable. Ten bits have more (1024) states than three decimal digits (1000). 10k bits are more than sufficient to represent an information (a number or anything else) that requires 3k decimal digits, so information contained in discrete variables with 3, 4, 5, 6, 7, 8, 9, 10... states can be ever superseded by allocating two, three, or four times more bits. So, the use of any other small number than 2 does not provide an advantage.

A Hasse diagram: representation of a Boolean algebra as a directed graph Hypercubeorder binary.svg
A Hasse diagram: representation of a Boolean algebra as a directed graph

Moreover, Boolean algebra provides a convenient mathematical structure for collection of bits, with a semantic of a collection of propositional variables. Boolean algebra operations are known as "bitwise operations" in computer science. Boolean functions are also well-studied theoretically and easily implementable, either with computer programs or by so-named logic gates in digital electronics. This contributes to the use of bits to represent different data, even those originally not binary.

In statistics

In statistics, binary data is a statistical data type consisting of categorical data that can take exactly two possible values, such as "A" and "B", or "heads" and "tails". It is also called dichotomous data, and an older term is quantal data. [1] The two values are often referred to generically as "success" and "failure". [1] As a form of categorical data, binary data is nominal data, meaning the values are qualitatively different and cannot be compared numerically. However, the values are frequently represented as 1 or 0, which corresponds to counting the number of successes in a single trial: 1 (success…) or 0 (failure); see § Counting.

Often, binary data is used to represent one of two conceptually opposed values, e.g.:

However, it can also be used for data that is assumed to have only two possible values, even if they are not conceptually opposed or conceptually represent all possible values in the space. For example, binary data is often used to represent the party choices of voters in elections in the United States, i.e. Republican or Democratic. In this case, there is no inherent reason why only two political parties should exist, and indeed, other parties do exist in the U.S., but they are so minor that they are generally simply ignored. Modeling continuous data (or categorical data of more than 2 categories) as a binary variable for analysis purposes is called dichotomization (creating a dichotomy). Like all discretization, it involves discretization error, but the goal is to learn something valuable despite the error: treating it as negligible for the purpose at hand, but remembering that it cannot be assumed to be negligible in general.

Binary variables

A binary variable is a random variable of binary type, meaning with two possible values. Independent and identically distributed (i.i.d.) binary variables follow a Bernoulli distribution, but in general binary data need not come from i.i.d. variables. Total counts of i.i.d. binary variables (equivalently, sums of i.i.d. binary variables coded as 1 or 0) follow a binomial distribution, but when binary variables are not i.i.d., the distribution need not be binomial.

Counting

Like categorical data, binary data can be converted to a vector of count data by writing one coordinate for each possible value, and counting 1 for the value that occurs, and 0 for the value that does not occur. [2] For example, if the values are A and B, then the data set A, A, B can be represented in counts as (1, 0), (1, 0), (0, 1). Once converted to counts, binary data can be grouped and the counts added. For instance, if the set A, A, B is grouped, the total counts are (2, 1): 2 A's and 1 B (out of 3 trials).

Since there are only two possible values, this can be simplified to a single count (a scalar value) by considering one value as "success" and the other as "failure", coding a value of the success as 1 and of the failure as 0 (using only the coordinate for the "success" value, not the coordinate for the "failure" value). For example, if the value A is considered "success" (and thus B is considered "failure"), the data set A, A, B would be represented as 1, 1, 0. When this is grouped, the values are added, while the number of trial is generally tracked implicitly. For example, A, A, B would be grouped as 1 + 1 + 0 = 2 successes (out of trials). Going the other way, count data with is binary data, with the two classes being 0 (failure) or 1 (success).

Counts of i.i.d. binary variables follow a binomial distribution, with the total number of trials (points in the grouped data).

Regression

Regression analysis on predicted outcomes that are binary variables is known as binary regression; when binary data is converted to count data and modeled as i.i.d. variables (so they have a binomial distribution), binomial regression can be used. The most common regression methods for binary data are logistic regression, probit regression, or related types of binary choice models.

Similarly, counts of i.i.d. categorical variables with more than two categories can be modeled with a multinomial regression. Counts of non-i.i.d. binary data can be modeled by more complicated distributions, such as the beta-binomial distribution (a compound distribution). Alternatively, the relationship can be modeled without needing to explicitly model the distribution of the output variable using techniques from generalized linear models, such as quasi-likelihood and a quasibinomial model; see Overdispersion § Binomial.

In computer science

A binary image of a QR code, representing 1 bit per pixel, as opposed to a typical 24-bit true color image. Commons QR code.png
A binary image of a QR code, representing 1 bit per pixel, as opposed to a typical 24-bit true color image.

In modern computers, binary data refers to any data represented in binary form rather than interpreted on a higher level or converted into some other form. At the lowest level, bits are stored in a bistable device such as a flip-flop. While most binary data has symbolic meaning (except for don't cares) not all binary data is numeric. Some binary data corresponds to computer instructions, such as the data within processor registers decoded by the control unit along the fetch-decode-execute cycle. Computers rarely modify individual bits for performance reasons. Instead, data is aligned in groups of a fixed number of bits, usually 1 byte (8 bits). Hence, "binary data" in computers are actually sequences of bytes. On a higher level, data is accessed in groups of 1 word (4 bytes) for 32-bit systems and 2 words for 64-bit systems.

In applied computer science and in the information technology field, the term binary data is often specifically opposed to text-based data , referring to any sort of data that cannot be interpreted as text. The "text" vs. "binary" distinction can sometimes refer to the semantic content of a file (e.g. a written document vs. a digital image). However, it often refers specifically to whether the individual bytes of a file are interpretable as text (see character encoding) or cannot so be interpreted. When this last meaning is intended, the more specific terms binary format and text(ual) format are sometimes used. Semantically textual data can be represented in binary format (e.g. when compressed or in certain formats that intermix various sorts of formatting codes, as in the doc format used by Microsoft Word); contrarily, image data is sometimes represented in textual format (e.g. the X PixMap image format used in the X Window System).

1 and 0 are nothing but just two different voltage levels. You can make the computer understand 1 for higher voltage and 0 for lower voltage. There are many different ways to store two voltage levels. If you have seen floppy, then you will find a magnetic tape that has a coating of ferromagnetic material, this is a type of paramagnetic material that has domains aligned in a particular direction to give a remnant magnetic field even after removal of currents through materials or magnetic field. During loading of data in the magnetic tape, the magnetic field is passed in one direction to call the saved orientation of the domain 1 and for the magnetic field is passed in another direction, then the saved orientation of the domain is 0. In this way, generally, 1 and 0 data are stored. [3]

See also

Related Research Articles

<span class="mw-page-title-main">Probability distribution</span> Mathematical function for the probability a given outcome occurs in an experiment

In probability theory and statistics, a probability distribution is the mathematical function that gives the probabilities of occurrence of different possible outcomes for an experiment. It is a mathematical description of a random phenomenon in terms of its sample space and the probabilities of events.

<span class="mw-page-title-main">Negative binomial distribution</span> Probability distribution

In probability theory and statistics, the negative binomial distribution is a discrete probability distribution that models the number of failures in a sequence of independent and identically distributed Bernoulli trials before a specified (non-random) number of successes occurs. For example, we can define rolling a 6 on a dice as a success, and rolling any other number as a failure, and ask how many failure rolls will occur before we see the third success. In such a case, the probability distribution of the number of failures that appear will be a negative binomial distribution.

<span class="mw-page-title-main">Probability mass function</span> Discrete-variable probability distribution

In probability and statistics, a probability mass function is a function that gives the probability that a discrete random variable is exactly equal to some value. Sometimes it is also known as the discrete probability density function. The probability mass function is often the primary means of defining a discrete probability distribution, and such functions exist for either scalar or multivariate random variables whose domain is discrete.

<span class="mw-page-title-main">Bernoulli distribution</span> Probability distribution modeling a coin toss which need not be fair

In probability theory and statistics, the Bernoulli distribution, named after Swiss mathematician Jacob Bernoulli, is the discrete probability distribution of a random variable which takes the value 1 with probability and the value 0 with probability . Less formally, it can be thought of as a model for the set of possible outcomes of any single experiment that asks a yes–no question. Such questions lead to outcomes that are Boolean-valued: a single bit whose value is success/yes/true/one with probability p and failure/no/false/zero with probability q. It can be used to represent a coin toss where 1 and 0 would represent "heads" and "tails", respectively, and p would be the probability of the coin landing on heads. In particular, unfair coins would have

<span class="mw-page-title-main">Logistic regression</span> Statistical model for a binary dependent variable

In statistics, the logistic model is a statistical model that models the log-odds of an event as a linear combination of one or more independent variables. In regression analysis, logistic regression is estimating the parameters of a logistic model. Formally, in binary logistic regression there is a single binary dependent variable, coded by an indicator variable, where the two values are labeled "0" and "1", while the independent variables can each be a binary variable or a continuous variable. The corresponding probability of the value labeled "1" can vary between 0 and 1, hence the labeling; the function that converts log-odds to probability is the logistic function, hence the name. The unit of measurement for the log-odds scale is called a logit, from logistic unit, hence the alternative names. See § Background and § Definition for formal mathematics, and § Example for a worked example.

In regression analysis, a dummy variable is one that takes a binary value to indicate the absence or presence of some categorical effect that may be expected to shift the outcome. For example, if we were studying the relationship between biological sex and income, we could use a dummy variable to represent the sex of each individual in the study. The variable could take on a value of 1 for males and 0 for females. In machine learning this is known as one-hot encoding.

In statistics, a generalized linear model (GLM) is a flexible generalization of ordinary linear regression. The GLM generalizes linear regression by allowing the linear model to be related to the response variable via a link function and by allowing the magnitude of the variance of each measurement to be a function of its predicted value.

In statistics, a categorical variable is a variable that can take on one of a limited, and usually fixed, number of possible values, assigning each individual or other unit of observation to a particular group or nominal category on the basis of some qualitative property. In computer science and some branches of mathematics, categorical variables are referred to as enumerations or enumerated types. Commonly, each of the possible values of a categorical variable is referred to as a level. The probability distribution associated with a random categorical variable is called a categorical distribution.

<span class="mw-page-title-main">Mathematical statistics</span> Branch of statistics

Mathematical statistics is the application of probability theory, a branch of mathematics, to statistics, as opposed to techniques for collecting statistical data. Specific mathematical techniques which are used for this include mathematical analysis, linear algebra, stochastic analysis, differential equations, and measure theory.

In statistics, classification is the problem of identifying which of a set of categories (sub-populations) an observation belongs to. Examples are assigning a given email to the "spam" or "non-spam" class, and assigning a diagnosis to a given patient based on observed characteristics of the patient.

In statistics, binomial regression is a regression analysis technique in which the response has a binomial distribution: it is the number of successes in a series of independent Bernoulli trials, where each trial has probability of success . In binomial regression, the probability of a success is related to explanatory variables: the corresponding concept in ordinary regression is to relate the mean value of the unobserved response to explanatory variables.

In probability theory and statistics, a categorical distribution is a discrete probability distribution that describes the possible results of a random variable that can take on one of K possible categories, with the probability of each category separately specified. There is no innate underlying ordering of these outcomes, but numerical labels are often attached for convenience in describing the distribution,. The K-dimensional categorical distribution is the most general distribution over a K-way event; any other discrete distribution over a size-K sample space is a special case. The parameters specifying the probabilities of each possible outcome are constrained only by the fact that each must be in the range 0 to 1, and all must sum to 1.

In statistics, count data is a statistical data type describing countable quantities, data which can take only the counting numbers, non-negative integer values {0, 1, 2, 3, ...}, and where these integers arise from counting rather than ranking. The statistical treatment of count data is distinct from that of binary data, in which the observations can take only two values, usually represented by 0 and 1, and from ordinal data, which may also consist of integers but where the individual values fall on an arbitrary scale and only the relative ranking is important.

<span class="mw-page-title-main">Digital signal</span> Signal used to represent data as a sequence of discrete values

A digital signal is a signal that represents data as a sequence of discrete values; at any given time it can only take on, at most, one of a finite number of values. This contrasts with an analog signal, which represents continuous values; at any given time it represents a real number within a continuous range of values.

In statistics, groups of individual data points may be classified as belonging to any of various statistical data types, e.g. categorical, real number, odd number (1,3,5) etc. The data type is a fundamental component of the semantic content of the variable, and controls which sorts of probability distributions can logically be used to describe the variable, the permissible operations on the variable, the type of regression analysis used to predict the variable, etc. The concept of data type is similar to the concept of level of measurement, but more specific: For example, count data require a different distribution than non-negative real-valued data require, but both fall under the same level of measurement.

In statistics, a zero-inflated model is a statistical model based on a zero-inflated probability distribution, i.e. a distribution that allows for frequent zero-valued observations.

<span class="mw-page-title-main">Continuous or discrete variable</span> Types of quantitative variables in mathematics

In mathematics and statistics, a quantitative variable may be continuous or discrete if they are typically obtained by measuring or counting, respectively. If it can take on two particular real values such that it can also take on all real values between them, the variable is continuous in that interval. If it can take on a value such that there is a non-infinitesimal gap on each side of it containing no values that the variable can take on, then it is discrete around that value. In some contexts a variable can be discrete in some ranges of the number line and continuous in others.

In probability theory and statistics, the discrete Weibull distribution is the discrete variant of the Weibull distribution. The Discrete Weibull Distribution, first introduced by Toshio Nakagawa and Shunji Osaki, is a discrete analog of the continuous Weibull distribution, predominantly used in reliability engineering. It is particularly applicable for modeling failure data measured in discrete units like cycles or shocks. This distribution provides a versatile tool for analyzing scenarios where the timing of events is counted in distinct intervals, making it distinctively useful in fields that deal with discrete data patterns and reliability analysis.

In statistics, specifically regression analysis, a binary regression estimates a relationship between one or more explanatory variables and a single output binary variable. Generally the probability of the two alternatives is modeled, instead of simply outputting a single value, as in linear regression.

References

  1. 1 2 Collett 2002, p. 1.
  2. Agresti, Alan (2012). "1.2.2 Multinomial Distribution". Categorical Data Analysis (3rd ed.). Wiley. p. 6. ISBN   978-0470463635.
  3. Gul, Najam (2022-08-18). "How do different types of Data get stored in form of 0 and 1?". Curiosity Tea. Retrieved 2023-01-05.