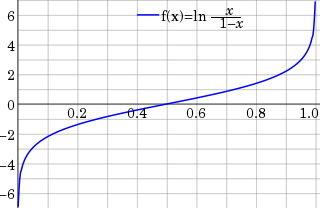
In statistics, the logit function is the quantile function associated with the standard logistic distribution. It has many uses in data analysis and machine learning, especially in data transformations.
In statistics, the logistic model is used to model the probability of a certain class or event taking place, such as the probability of a team winning, of a patient being healthy, etc. This can be extended to model several classes of events such as determining whether an image contains a cat, dog, lion, etc. Each object being detected in the image would be assigned a probability between 0 and 1, with a sum of one.
In statistics and econometrics, particularly in regression analysis, a dummy variable is one that takes only the value 0 or 1 to indicate the absence or presence of some categorical effect that may be expected to shift the outcome. They can be thought of as numeric stand-ins for qualitative facts in a regression model, sorting data into mutually exclusive categories.
In statistics, a generalized linear model (GLM) is a flexible generalization of ordinary linear regression. The GLM generalizes linear regression by allowing the linear model to be related to the response variable via a link function and by allowing the magnitude of the variance of each measurement to be a function of its predicted value.

In statistical modeling, regression analysis is a set of statistical processes for estimating the relationships between a dependent variable and one or more independent variables. The most common form of regression analysis is linear regression, in which one finds the line that most closely fits the data according to a specific mathematical criterion. For example, the method of ordinary least squares computes the unique line that minimizes the sum of squared differences between the true data and that line. For specific mathematical reasons, this allows the researcher to estimate the conditional expectation of the dependent variable when the independent variables take on a given set of values. Less common forms of regression use slightly different procedures to estimate alternative location parameters or estimate the conditional expectation across a broader collection of non-linear models.
The general linear model or general multivariate regression model is a compact way of simultaneously writing several multiple linear regression models. In that sense it is not a separate statistical linear model. The various multiple linear regression models may be compactly written as
In statistics, classification is the problem of identifying which of a set of categories (sub-populations) an observation belongs to. Examples are assigning a given email to the "spam" or "non-spam" class, and assigning a diagnosis to a given patient based on observed characteristics of the patient.
In statistics, a linear probability model is a special case of a binary regression model. Here the dependent variable for each observation takes values which are either 0 or 1. The probability of observing a 0 or 1 in any one case is treated as depending on one or more explanatory variables. For the "linear probability model", this relationship is a particularly simple one, and allows the model to be fitted by linear regression.
In statistics, a probit model is a type of regression where the dependent variable can take only two values, for example married or not married. The word is a portmanteau, coming from probability + unit. The purpose of the model is to estimate the probability that an observation with particular characteristics will fall into a specific one of the categories; moreover, classifying observations based on their predicted probabilities is a type of binary classification model.
In statistics, the ordered logit model is an ordinal regression model—that is, a regression model for ordinal dependent variables—first considered by Peter McCullagh. For example, if one question on a survey is to be answered by a choice among "poor", "fair", "good", and "excellent", and the purpose of the analysis is to see how well that response can be predicted by the responses to other questions, some of which may be quantitative, then ordered logistic regression may be used. It can be thought of as an extension of the logistic regression model that applies to dichotomous dependent variables, allowing for more than two (ordered) response categories.
In statistics, multinomial logistic regression is a classification method that generalizes logistic regression to multiclass problems, i.e. with more than two possible discrete outcomes. That is, it is a model that is used to predict the probabilities of the different possible outcomes of a categorically distributed dependent variable, given a set of independent variables.
In economics, discrete choice models, or qualitative choice models, describe, explain, and predict choices between two or more discrete alternatives, such as entering or not entering the labor market, or choosing between modes of transport. Such choices contrast with standard consumption models in which the quantity of each good consumed is assumed to be a continuous variable. In the continuous case, calculus methods can be used to determine the optimum amount chosen, and demand can be modeled empirically using regression analysis. On the other hand, discrete choice analysis examines situations in which the potential outcomes are discrete, such that the optimum is not characterized by standard first-order conditions. Thus, instead of examining "how much" as in problems with continuous choice variables, discrete choice analysis examines "which one". However, discrete choice analysis can also be used to examine the chosen quantity when only a few distinct quantities must be chosen from, such as the number of vehicles a household chooses to own and the number of minutes of telecommunications service a customer decides to purchase. Techniques such as logistic regression and probit regression can be used for empirical analysis of discrete choice.
In statistics, binomial regression is a regression analysis technique in which the response has a binomial distribution: it is the number of successes in a series of independent Bernoulli trials, where each trial has probability of success . In binomial regression, the probability of a success is related to explanatory variables: the corresponding concept in ordinary regression is to relate the mean value of the unobserved response to explanatory variables.
In statistics and econometrics, the multivariate probit model is a generalization of the probit model used to estimate several correlated binary outcomes jointly. For example, if it is believed that the decisions of sending at least one child to public school and that of voting in favor of a school budget are correlated, then the multivariate probit model would be appropriate for jointly predicting these two choices on an individual-specific basis. J.R. Ashford and R.R. Sowden initially proposed an approach for multivariate probit analysis. Siddhartha Chib and Edward Greenberg extended this idea and also proposed simulation-based inference methods for the multivariate probit model which simplified and generalized parameter estimation.
In statistics and econometrics, the multinomial probit model is a generalization of the probit model used when there are several possible categories that the dependent variable can fall into. As such, it is an alternative to the multinomial logit model as one method of multiclass classification. It is not to be confused with the multivariate probit model, which is used to model correlated binary outcomes for more than one independent variable.
In statistics, ordinal regression, also called ordinal classification, is a type of regression analysis used for predicting an ordinal variable, i.e. a variable whose value exists on an arbitrary scale where only the relative ordering between different values is significant. It can be considered an intermediate problem between regression and classification. Examples of ordinal regression are ordered logit and ordered probit. Ordinal regression turns up often in the social sciences, for example in the modeling of human levels of preference, as well as in information retrieval. In machine learning, ordinal regression may also be called ranking learning.
In statistics and in machine learning, a linear predictor function is a linear function of a set of coefficients and explanatory variables, whose value is used to predict the outcome of a dependent variable. This sort of function usually comes in linear regression, where the coefficients are called regression coefficients. However, they also occur in various types of linear classifiers, as well as in various other models, such as principal component analysis and factor analysis. In many of these models, the coefficients are referred to as "weights".
In statistics and econometrics, the maximum score estimator is a nonparametric estimator for discrete choice models developed by Charles Manski in 1975. Unlike the multinomial probit and multinomial logit estimators, it makes no assumptions about the distribution of the unobservable part of utility. However, its statistical properties are more complicated than the multinomial probit and logit models, making statistical inference difficult. To address these issues, Joel Horowitz proposed a variant, called the smoothed maximum score estimator.
In statistics, linear regression is a linear approach for modelling the relationship between a scalar response and one or more explanatory variables. The case of one explanatory variable is called simple linear regression; for more than one, the process is called multiple linear regression. This term is distinct from multivariate linear regression, where multiple correlated dependent variables are predicted, rather than a single scalar variable.
In statistics, the class of vector generalized linear models (VGLMs) was proposed to enlarge the scope of models catered for by generalized linear models (GLMs). In particular, VGLMs allow for response variables outside the classical exponential family and for more than one parameter. Each parameter can be transformed by a link function. The VGLM framework is also large enough to naturally accommodate multiple responses; these are several independent responses each coming from a particular statistical distribution with possibly different parameter values.


