The likelihood function is the joint probability of observed data viewed as a function of the parameters of a statistical model.
In statistics, the likelihood-ratio test assesses the goodness of fit of two competing statistical models, specifically one found by maximization over the entire parameter space and another found after imposing some constraint, based on the ratio of their likelihoods. If the constraint is supported by the observed data, the two likelihoods should not differ by more than sampling error. Thus the likelihood-ratio test tests whether this ratio is significantly different from one, or equivalently whether its natural logarithm is significantly different from zero.
In statistics, maximum likelihood estimation (MLE) is a method of estimating the parameters of an assumed probability distribution, given some observed data. This is achieved by maximizing a likelihood function so that, under the assumed statistical model, the observed data is most probable. The point in the parameter space that maximizes the likelihood function is called the maximum likelihood estimate. The logic of maximum likelihood is both intuitive and flexible, and as such the method has become a dominant means of statistical inference.

In probability theory and statistics, the Weibull distribution is a continuous probability distribution. It models a broad range of random variables, largely in the nature of a time to failure or time between events. Examples are maximum one-day rainfalls and the time a user spends on a web page.

In probability theory and statistics, the gamma distribution is a two-parameter family of continuous probability distributions. The exponential distribution, Erlang distribution, and chi-squared distribution are special cases of the gamma distribution. There are two equivalent parameterizations in common use:
- With a shape parameter and a scale parameter .
- With a shape parameter and an inverse scale parameter , called a rate parameter.
In probability theory and statistics, a Gaussian process is a stochastic process, such that every finite collection of those random variables has a multivariate normal distribution, i.e. every finite linear combination of them is normally distributed. The distribution of a Gaussian process is the joint distribution of all those random variables, and as such, it is a distribution over functions with a continuous domain, e.g. time or space.
In numerical analysis and computational statistics, rejection sampling is a basic technique used to generate observations from a distribution. It is also commonly called the acceptance-rejection method or "accept-reject algorithm" and is a type of exact simulation method. The method works for any distribution in with a density.
In mathematical statistics, the Fisher information is a way of measuring the amount of information that an observable random variable X carries about an unknown parameter θ of a distribution that models X. Formally, it is the variance of the score, or the expected value of the observed information.
In probability theory, a Lévy process, named after the French mathematician Paul Lévy, is a stochastic process with independent, stationary increments: it represents the motion of a point whose successive displacements are random, in which displacements in pairwise disjoint time intervals are independent, and displacements in different time intervals of the same length have identical probability distributions. A Lévy process may thus be viewed as the continuous-time analog of a random walk.
In mathematical statistics, the Kullback–Leibler divergence, denoted , is a type of statistical distance: a measure of how one probability distribution P is different from a second, reference probability distribution Q. A simple interpretation of the KL divergence of P from Q is the expected excess surprise from using Q as a model when the actual distribution is P. While it is a distance, it is not a metric, the most familiar type of distance: it is not symmetric in the two distributions, and does not satisfy the triangle inequality. Instead, in terms of information geometry, it is a type of divergence, a generalization of squared distance, and for certain classes of distributions, it satisfies a generalized Pythagorean theorem.
In convex analysis, a non-negative function f : Rn → R+ is logarithmically concave if its domain is a convex set, and if it satisfies the inequality
In statistics, the score test assesses constraints on statistical parameters based on the gradient of the likelihood function—known as the score—evaluated at the hypothesized parameter value under the null hypothesis. Intuitively, if the restricted estimator is near the maximum of the likelihood function, the score should not differ from zero by more than sampling error. While the finite sample distributions of score tests are generally unknown, they have an asymptotic χ2-distribution under the null hypothesis as first proved by C. R. Rao in 1948, a fact that can be used to determine statistical significance.

In monotone comparative statics, the single-crossing condition or single-crossing property refers to a condition where the relationship between two or more functions is such that they will only cross once. For example, a mean-preserving spread will result in an altered probability distribution whose cumulative distribution function will intersect with the original's only once.
Stochastic approximation methods are a family of iterative methods typically used for root-finding problems or for optimization problems. The recursive update rules of stochastic approximation methods can be used, among other things, for solving linear systems when the collected data is corrupted by noise, or for approximating extreme values of functions which cannot be computed directly, but only estimated via noisy observations.
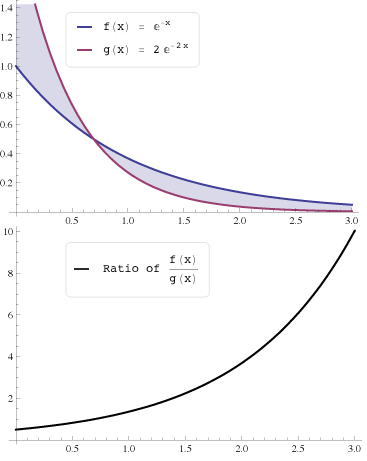
A ratio distribution is a probability distribution constructed as the distribution of the ratio of random variables having two other known distributions. Given two random variables X and Y, the distribution of the random variable Z that is formed as the ratio Z = X/Y is a ratio distribution.
In probability theory and statistics, a stochastic order quantifies the concept of one random variable being "bigger" than another. These are usually partial orders, so that one random variable may be neither stochastically greater than, less than nor equal to another random variable . Many different orders exist, which have different applications.
In statistical hypothesis testing, a uniformly most powerful (UMP) test is a hypothesis test which has the greatest power among all possible tests of a given size α. For example, according to the Neyman–Pearson lemma, the likelihood-ratio test is UMP for testing simple (point) hypotheses.
In particle physics, CLs represents a statistical method for setting upper limits on model parameters, a particular form of interval estimation used for parameters that can take only non-negative values. Although CLs are said to refer to Confidence Levels, "The method's name is ... misleading, as the CLs exclusion region is not a confidence interval." It was first introduced by physicists working at the LEP experiment at CERN and has since been used by many high energy physics experiments. It is a frequentist method in the sense that the properties of the limit are defined by means of error probabilities, however it differs from standard confidence intervals in that the stated confidence level of the interval is not equal to its coverage probability. The reason for this deviation is that standard upper limits based on a most powerful test necessarily produce empty intervals with some fixed probability when the parameter value is zero, and this property is considered undesirable by most physicists and statisticians.
In probability theory and statistics, empirical likelihood (EL) is a nonparametric method for estimating the parameters of statistical models. It requires fewer assumptions about the error distribution while retaining some of the merits in likelihood-based inference. The estimation method requires that the data are independent and identically distributed (iid). It performs well even when the distribution is asymmetric or censored. EL methods can also handle constraints and prior information on parameters. Art Owen pioneered work in this area with his 1988 paper.
Exponential Tilting (ET), Exponential Twisting, or Exponential Change of Measure (ECM) is a distribution shifting technique used in many parts of mathematics. The different exponential tiltings of a random variable is known as the natural exponential family of .