Causal or moderating relationship between statistical variables
Interaction effect of education and ideology on concern about sea level rise
In statistics, an interaction may arise when considering the relationship among three or more variables, and describes a situation in which the effect of one causal variable on an outcome depends on the state of a second causal variable (that is, when effects of the two causes are not additive).[1][2] Although commonly thought of in terms of causal relationships, the concept of an interaction can also describe non-causal associations (then also called moderation or effect modification). Interactions are often considered in the context of regression analyses or factorial experiments.
The presence of interactions can have important implications for the interpretation of statistical models. If two variables of interest interact, the relationship between each of the interacting variables and a third "dependent variable" depends on the value of the other interacting variable. In practice, this makes it more difficult to predict the consequences of changing the value of a variable, particularly if the variables it interacts with are hard to measure or difficult to control.
The notion of "interaction" is closely related to that of moderation that is common in social and health science research: the interaction between an explanatory variable and an environmental variable suggests that the effect of the explanatory variable has been moderated or modified by the environmental variable.[1]
Introduction
An interaction variable or interaction feature is a variable constructed from an original set of variables to try to represent either all of the interaction present or some part of it. In exploratory statistical analyses it is common to use products of original variables as the basis of testing whether interaction is present with the possibility of substituting other more realistic interaction variables at a later stage. When there are more than two explanatory variables, several interaction variables are constructed, with pairwise-products representing pairwise-interactions and higher order products representing higher order interactions.
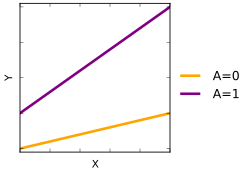
The binary factor A and the quantitative variable X interact (are non-additive) when analyzed with respect to the outcome variable Y.
Thus, for a response Y and two variables x1 and x2 an additive model would be:
In contrast to this,
is an example of a model with an interaction between variables x1 and x2 ("error" refers to the random variable whose value is that by which Y differs from the expected value of Y; see errors and residuals in statistics). Often, models are presented without the interaction term , but this confounds the main effect and interaction effect (i.e., without specifying the interaction term, it is possible that any main effect found is actually due to an interaction).
Moreover, the hierarchical principle rules that if a model includes interaction between variables, it is also necessary to include the main effects, regardless of their own statistical significance.[3]
In modeling
In ANOVA
A simple setting in which interactions can arise is a two-factor experiment analyzed using Analysis of Variance (ANOVA). Suppose we have two binary factors A and B. For example, these factors might indicate whether either of two treatments were administered to a patient, with the treatments applied either singly, or in combination. We can then consider the average treatment response (e.g. the symptom levels following treatment) for each patient, as a function of the treatment combination that was administered. The following table shows one possible situation:
B=0
B=1
A=0
6
7
A=1
4
5
In this example, there is no interaction between the two treatments — their effects are additive. The reason for this is that the difference in mean response between those subjects receiving treatment A and those not receiving treatment A is −2 regardless of whether treatment B is administered (−2=4−6) or not (−2=5−7). Note that it automatically follows that the difference in mean response between those subjects receiving treatment B and those not receiving treatment B is the same regardless of whether treatment A is administered (7−6=5−4).
In contrast, if the following average responses are observed
B=0
B=1
A=0
1
4
A=1
7
6
then there is an interaction between the treatments — their effects are not additive. Supposing that greater numbers correspond to a better response, in this situation treatment B is helpful on average if the subject is not also receiving treatment A, but is detrimental on average if given in combination with treatment A. Treatment A is helpful on average regardless of whether treatment B is also administered, but it is more helpful in both absolute and relative terms if given alone, rather than in combination with treatment B. Similar observations are made for this particular example in the next section.
Qualitative and quantitative interactions
In many applications it is useful to distinguish between qualitative and quantitative interactions.[4] A quantitative interaction between A and B is a situation where the magnitude of the effect of B depends on the value of A, but the direction of the effect of B is constant for all A. A qualitative interaction between A and B refers to a situation where both the magnitude and direction of each variable's effect can depend on the value of the other variable.
The table of means on the left, below, shows a quantitative interaction — treatment A is beneficial both when B is given, and when B is not given, but the benefit is greater when B is not given (i.e. when A is given alone). The table of means on the right shows a qualitative interaction. A is harmful when B is given, but it is beneficial when B is not given. Note that the same interpretation would hold if we consider the benefit of B based on whether A is given.
B=0
B=1
B=0
B=1
A=0
2
1
A=0
2
6
A=1
5
3
A=1
5
3
The distinction between qualitative and quantitative interactions depends on the order in which the variables are considered (in contrast, the property of additivity is invariant to the order of the variables). In the following table, if we focus on the effect of treatment A, there is a quantitative interaction — giving treatment A will improve the outcome on average regardless of whether treatment B is or is not already being given (although the benefit is greater if treatment A is given alone). However, if we focus on the effect of treatment B, there is a qualitative interaction — giving treatment B to a subject who is already receiving treatment A will (on average) make things worse, whereas giving treatment B to a subject who is not receiving treatment A will improve the outcome on average.
B=0
B=1
A=0
1
4
A=1
7
6
Unit treatment additivity
In its simplest form, the assumption of treatment unit additivity states that the observed response yij from experimental unit i when receiving treatment j can be written as the sum yij=yi+tj.[5][6][7] The assumption of unit treatment additivity implies that every treatment has exactly the same additive effect on each experimental unit. Since any given experimental unit can only undergo one of the treatments, the assumption of unit treatment additivity is a hypothesis that is not directly falsifiable, according to Cox[citation needed] and Kempthorne.[citation needed]
However, many consequences of treatment-unit additivity can be falsified.[citation needed] For a randomized experiment, the assumption of treatment additivity implies that the variance is constant for all treatments. Therefore, by contraposition, a necessary condition for unit treatment additivity is that the variance is constant.[citation needed]
The property of unit treatment additivity is not invariant under a change of scale,[citation needed] so statisticians often use transformations to achieve unit treatment additivity. If the response variable is expected to follow a parametric family of probability distributions, then the statistician may specify (in the protocol for the experiment or observational study) that the responses be transformed to stabilize the variance.[8] In many cases, a statistician may specify that logarithmic transforms be applied to the responses, which are believed to follow a multiplicative model.[6][9]
The assumption of unit treatment additivity was enunciated in experimental design by Kempthorne[citation needed] and Cox[citation needed]. Kempthorne's use of unit treatment additivity and randomization is similar to the design-based analysis of finite population survey sampling.
In recent years, it has become common[citation needed] to use the terminology of Donald Rubin, which uses counterfactuals. Suppose we are comparing two groups of people with respect to some attribute y. For example, the first group might consist of people who are given a standard treatment for a medical condition, with the second group consisting of people who receive a new treatment with unknown effect. Taking a "counterfactual" perspective, we can consider an individual whose attribute has value y if that individual belongs to the first group, and whose attribute has value τ(y) if the individual belongs to the second group. The assumption of "unit treatment additivity" is that τ(y)=τ, that is, the "treatment effect" does not depend on y. Since we cannot observe both y and τ(y) for a given individual, this is not testable at the individual level. However, unit treatment additivity implies that the cumulative distribution functionsF1 and F2 for the two groups satisfy F2(y) =F1(y−τ), as long as the assignment of individuals to groups 1 and 2 is independent of all other factors influencing y (i.e. there are no confounders). Lack of unit treatment additivity can be viewed as a form of interaction between the treatment assignment (e.g. to groups 1 or 2), and the baseline, or untreated value of y.
Categorical variables
Sometimes the interacting variables are categorical variables rather than real numbers and the study might then be dealt with as an analysis of variance problem. For example, members of a population may be classified by religion and by occupation. If one wishes to predict a person's height based only on the person's religion and occupation, a simple additive model, i.e., a model without interaction, would add to an overall average height an adjustment for a particular religion and another for a particular occupation. A model with interaction, unlike an additive model, could add a further adjustment for the "interaction" between that religion and that occupation. This example may cause one to suspect that the word interaction is something of a misnomer.
Statistically, the presence of an interaction between categorical variables is generally tested using a form of analysis of variance (ANOVA). If one or more of the variables is continuous in nature, however, it would typically be tested using moderated multiple regression.[10] This is so-called because a moderator is a variable that affects the strength of a relationship between two other variables.
Designed experiments
Genichi Taguchi contended[11] that interactions could be eliminated from a system by appropriate choice of response variable and transformation. However George Box and others have argued that this is not the case in general.[12]
Model size
Given n predictors, the number of terms in a linear model that includes a constant, every predictor, and every possible interaction is . Since this quantity grows exponentially, it readily becomes impractically large. One method to limit the size of the model is to limit the order of interactions. For example, if only two-way interactions are allowed, the number of terms becomes . The below table shows the number of terms for each number of predictors and maximum order of interaction.
Number of terms
Predictors
Including up to m-way interactions
2
3
4
5
∞
1
2
2
2
2
2
2
4
4
4
4
4
3
7
8
8
8
8
4
11
15
16
16
16
5
16
26
31
32
32
6
22
42
57
63
64
7
29
64
99
120
128
8
37
93
163
219
256
9
46
130
256
382
512
10
56
176
386
638
1,024
11
67
232
562
1,024
2,048
12
79
299
794
1,586
4,096
13
92
378
1,093
2,380
8,192
14
106
470
1,471
3,473
16,384
15
121
576
1,941
4,944
32,768
20
211
1,351
6,196
21,700
1,048,576
25
326
2,626
15,276
68,406
33,554,432
50
1,276
20,876
251,176
2,369,936
1015
100
5,051
166,751
4,087,976
79,375,496
1030
1,000
500,501
166,667,501
1010
1012
10300
In regression
The most general approach to modeling interaction effects involves regression, starting from the elementary version given above:
where the interaction term could be formed explicitly by multiplying two (or more) variables, or implicitly using factorial notation in modern statistical packages such as Stata. The components x1 and x2 might be measurements or {0,1} dummy variables in any combination. Interactions involving a dummy variable multiplied by a measurement variable are termed slope dummy variables,[13] because they estimate and test the difference in slopes between groups 0 and 1.
When measurement variables are employed in interactions, it is often desirable to work with centered versions, where the variable's mean (or some other reasonably central value) is set as zero. Centering can make the main effects in interaction models more interpretable, as it reduces the multicollinearity between the interaction term and the main effects.[14] The coefficient a in the equation above, for example, represents the effect of x1 when x2 equals zero.
Interaction of education and political party affecting beliefs about climate change
Regression approaches to interaction modeling are very general because they can accommodate additional predictors, and many alternative specifications or estimation strategies beyond ordinary least squares. Robust, quantile, and mixed-effects (multilevel) models are among the possibilities, as is generalized linear modeling encompassing a wide range of categorical, ordered, counted or otherwise limited dependent variables. The graph depicts an education*politics interaction, from a probability-weighted logit regression analysis of survey data.[15]
Interaction plots
Interaction plots, also called simple-slope plots, show possible interactions among variables.
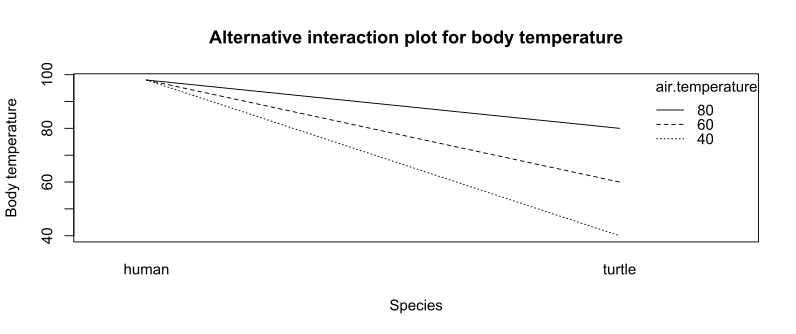
Example: Interaction of species and air temperature and their effect on body temperature
Consider a study of the body temperature of different species at different air temperatures, in degrees Fahrenheit. The data are shown in the table below.
The interaction plot may use either the air temperature or the species as the x axis. The second factor is represented by lines on the interaction plot.
There is an interaction between the two factors (air temperature and species) in their effect on the response (body temperature), because the effect of the air temperature depends on the species. The interaction is indicated on the plot because the lines are not parallel.
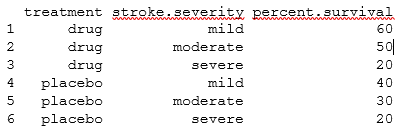
Example: effect of stroke severity and treatment on recovery
As a second example, consider a clinical trial on the interaction between stroke severity and the efficacy of a drug on patient survival. The data are shown in the table below.
In the interaction plot, the lines for the mild and moderate stroke groups are parallel, indicating that the drug has the same effect in both groups, so there is no interaction. The line for the severe stroke group is not parallel to the other lines, indicating that there is an interaction between stroke severity and drug effect on survival. The line for the severe stroke group is flat, indicating that, among these patients, there is no difference in survival between the drug and placebo treatments. In contrast, the lines for the mild and moderate stroke groups slope down to the right, indicating that, among these patients, the placebo group has lower survival than drug-treated group.
Hypothesis tests for interactions
Analysis of variance and regression analysis are used to test for significant interactions.
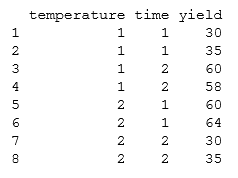
Example: Interaction of temperature and time in cookie baking
Is the yield of good cookies affected by the baking temperature and time in the oven? The table shows data for 8 batches of cookies.
The data show that the yield of good cookies is best when either (i) temperature is high and time in the oven is short, or (ii) temperature is low and time in the oven is long. If the cookies are left in the oven for a long time at a high temperature, there are burnt cookies and the yield is low.
From the graph and the data, it is clear that the lines are not parallel, indicating that there is an interaction. This can be tested using analysis of variance (ANOVA). The first ANOVA model will not include the interaction term. That is, the first ANOVA model ignores possible interaction. The second ANOVA model will include the interaction term. That is, the second ANOVA model explicitly performs a hypothesis test for interaction.
ANOVA model 1: no interaction term; yield ~ temperature + time
In the ANOVA model that ignores interaction, neither temperature nor time has a significant effect on yield (p=0.91), which is clearly the incorrect conclusion. The more appropriate ANOVA model should test for possible interaction.
ANOVA model 2: include interaction term; yield ~ temperature * time
The temperature:time interaction term is significant (p=0.000180). Based on the interaction test and the interaction plot, it appears that the effect of time on yield depends on temperature and vice versa.
Examples
Real-world examples of interaction include:
Interaction between adding sugar to coffee and stirring the coffee. Neither of the two individual variables has much effect on sweetness but a combination of the two does.
Interaction between adding carbon to steel and quenching. Neither of the two individually has much effect on strength but a combination of the two has a dramatic effect.
Interaction between smoking and inhaling asbestos fibres: Both raise lung carcinoma risk, but exposure to asbestos multiplies the cancer risk in smokers and non-smokers. Here, the joint effect of inhaling asbestos and smoking is higher than the sum of both effects.[16]
Interaction between genetic risk factors for type 2 diabetes and diet (specifically, a "western" dietary pattern). The western dietary pattern was shown to increase diabetes risk for subjects with a high "genetic risk score", but not for other subjects.[17]
Interaction between education and political orientation, affecting general-public perceptions about climate change. For example, US surveys often find that acceptance of the reality of anthropogenic climate change rises with education among moderate or liberal survey respondents, but declines with education among the most conservative.[18][19] Similar interactions have been observed to affect some non-climate science or environmental perceptions,[20] and to operate with science literacy or other knowledge indicators in place of education.[21][22]
↑ Hinkelmann, Klaus and Kempthorne, Oscar (2008). Design and Analysis of Experiments, Volume I: Introduction to Experimental Design (Seconded.). Wiley. Chapters 5-6. ISBN978-0-471-72756-9.{{cite book}}: CS1 maint: multiple names: authors list (link)
↑ Hinkelmann, Klaus and Kempthorne, Oscar (2008). Design and Analysis of Experiments, Volume I: Introduction to Experimental Design (Seconded.). Wiley. Chapters 7-8. ISBN978-0-471-72756-9.{{cite book}}: CS1 maint: multiple names: authors list (link)
↑ Overton, R. C. (2001). "Moderated multiple regression for interactions involving categorical variables: a statistical control for heterogeneous variance across two groups". Psychol Methods. 6 (3): 218–33. doi:10.1037/1082-989X.6.3.218. PMID11570229.
This page is based on this Wikipedia article Text is available under the CC BY-SA 4.0 license; additional terms may apply. Images, videos and audio are available under their respective licenses.