
In vector calculus, the gradient of a scalar-valued differentiable function of several variables is the vector field whose value at a point is the "direction and rate of fastest increase". If the gradient of a function is non-zero at a point , the direction of the gradient is the direction in which the function increases most quickly from , and the magnitude of the gradient is the rate of increase in that direction, the greatest absolute directional derivative. Further, a point where the gradient is the zero vector is known as a stationary point. The gradient thus plays a fundamental role in optimization theory, where it is used to maximize a function by gradient ascent. In coordinate-free terms, the gradient of a function may be defined by:

In engineering, applied mathematics, and physics, the Buckingham π theorem is a key theorem in dimensional analysis. It is a formalization of Rayleigh's method of dimensional analysis. Loosely, the theorem states that if there is a physically meaningful equation involving a certain number n of physical variables, then the original equation can be rewritten in terms of a set of p = n − k dimensionless parameters π1, π2, ..., πp constructed from the original variables, where k is the number of physical dimensions involved; it is obtained as the rank of a particular matrix.
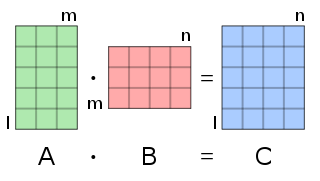
In mathematics, particularly in linear algebra, matrix multiplication is a binary operation that produces a matrix from two matrices. For matrix multiplication, the number of columns in the first matrix must be equal to the number of rows in the second matrix. The resulting matrix, known as the matrix product, has the number of rows of the first and the number of columns of the second matrix. The product of matrices A and B is denoted as AB.
In statistics, the Gauss–Markov theorem states that the ordinary least squares (OLS) estimator has the lowest sampling variance within the class of linear unbiased estimators, if the errors in the linear regression model are uncorrelated, have equal variances and expectation value of zero. The errors do not need to be normal, nor do they need to be independent and identically distributed. The requirement that the estimator be unbiased cannot be dropped, since biased estimators exist with lower variance. See, for example, the James–Stein estimator, ridge regression, or simply any degenerate estimator.

In probability theory and statistics, a covariance matrix is a square matrix giving the covariance between each pair of elements of a given random vector. Any covariance matrix is symmetric and positive semi-definite and its main diagonal contains variances.

In vector calculus, the Jacobian matrix of a vector-valued function of several variables is the matrix of all its first-order partial derivatives. When this matrix is square, that is, when the function takes the same number of variables as input as the number of vector components of its output, its determinant is referred to as the Jacobian determinant. Both the matrix and the determinant are often referred to simply as the Jacobian in literature.
In the mathematical field of differential geometry, a metric tensor is an additional structure on a manifold M that allows defining distances and angles, just as the inner product on a Euclidean space allows defining distances and angles there. More precisely, a metric tensor at a point p of M is a bilinear form defined on the tangent space at p, and a metric tensor on M consists of a metric tensor at each point p of M that varies smoothly with p.
In linear algebra, a QR decomposition, also known as a QR factorization or QU factorization, is a decomposition of a matrix A into a product A = QR of an orthonormal matrix Q and an upper triangular matrix R. QR decomposition is often used to solve the linear least squares problem and is the basis for a particular eigenvalue algorithm, the QR algorithm.
In mathematics, the Hessian matrix or Hessian is a square matrix of second-order partial derivatives of a scalar-valued function, or scalar field. It describes the local curvature of a function of many variables. The Hessian matrix was developed in the 19th century by the German mathematician Ludwig Otto Hesse and later named after him. Hesse originally used the term "functional determinants".
In control engineering, model based fault detection and system identification a state-space representation is a mathematical model of a physical system specified as a set of input, output and variables related by first-order differential equations or difference equations. Such variables, called state variables, evolve over time in a way that depends on the values they have at any given instant and on the externally imposed values of input variables. Output variables’ values depend on the values of the state variables.
In mathematics, the matrix exponential is a matrix function on square matrices analogous to the ordinary exponential function. It is used to solve systems of linear differential equations. In the theory of Lie groups, the matrix exponential gives the exponential map between a matrix Lie algebra and the corresponding Lie group.
In mathematics, the real coordinate space of dimension n, denoted Rn or , is the set of the n-tuples of real numbers, that is the set of all sequences of n real numbers. Special cases are called the real lineR1 and the real coordinate planeR2. With component-wise addition and scalar multiplication, it is a real vector space, and its elements are called coordinate vectors.
In statistics, ordinary least squares (OLS) is a type of linear least squares method for choosing the unknown parameters in a linear regression model by the principle of least squares: minimizing the sum of the squares of the differences between the observed dependent variable in the input dataset and the output of the (linear) function of the independent variable.

In statistics, a full factorial experiment is an experiment whose design consists of two or more factors, each with discrete possible values or "levels", and whose experimental units take on all possible combinations of these levels across all such factors. A full factorial design may also be called a fully crossed design. Such an experiment allows the investigator to study the effect of each factor on the response variable, as well as the effects of interactions between factors on the response variable.
In linear algebra, an eigenvector or characteristic vector of a linear transformation is a nonzero vector that changes at most by a scalar factor when that linear transformation is applied to it. The corresponding eigenvalue, often denoted by , is the factor by which the eigenvector is scaled.

In mathematics, the Weierstrass–Enneper parameterization of minimal surfaces is a classical piece of differential geometry.
A multi-compartment model is a type of mathematical model used for describing the way materials or energies are transmitted among the compartments of a system. Sometimes, the physical system that we try to model in equations is too complex, so it is much easier to discretize the problem and reduce the number of parameters. Each compartment is assumed to be a homogeneous entity within which the entities being modeled are equivalent. A multi-compartment model is classified as a lumped parameters model. Similar to more general mathematical models, multi-compartment models can treat variables as continuous, such as a differential equation, or as discrete, such as a Markov chain. Depending on the system being modeled, they can be treated as stochastic or deterministic.
In mathematics, the discrete Fourier transform over a ring generalizes the discrete Fourier transform (DFT), of a function whose values are commonly complex numbers, over an arbitrary ring.
In statistics, polynomial regression is a form of regression analysis in which the relationship between the independent variable x and the dependent variable y is modelled as an nth degree polynomial in x. Polynomial regression fits a nonlinear relationship between the value of x and the corresponding conditional mean of y, denoted E(y |x). Although polynomial regression fits a nonlinear model to the data, as a statistical estimation problem it is linear, in the sense that the regression function E(y | x) is linear in the unknown parameters that are estimated from the data. For this reason, polynomial regression is considered to be a special case of multiple linear regression.
In analytical mechanics, the mass matrix is a symmetric matrix M that expresses the connection between the time derivative of the generalized coordinate vector q of a system and the kinetic energy T of that system, by the equation
Myers, Raymond H. Response Surface Methodology. Boston: Allyn and Bacon, Inc., 1971


