Stratified sampling

Last updated

In statistics, stratified sampling is a method of sampling from a population which can be partitioned into subpopulations.

Contents

Stratified sampling example Stratified sampling.PNG
Stratified sampling example

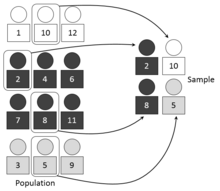
In statistical surveys, when subpopulations within an overall population vary, it could be advantageous to sample each subpopulation (stratum) independently.

Stratification is the process of dividing members of the population into homogeneous subgroups before sampling. The strata should define a partition of the population. That is, it should be collectively exhaustive and mutually exclusive : every element in the population must be assigned to one and only one stratum. Then sampling is done in each stratum, for example: by simple random sampling. The objective is to improve the precision of the sample by reducing sampling error. It can produce a weighted mean that has less variability than the arithmetic mean of a simple random sample of the population.

In computational statistics, stratified sampling is a method of variance reduction when Monte Carlo methods are used to estimate population statistics from a known population. [1]

Example

Assume that we need to estimate the average number of votes for each candidate in an election. Assume that a country has 3 towns: Town A has 1 million factory workers, Town B has 2 million office workers and Town C has 3 million retirees. We can choose to get a random sample of size 60 over the entire population but there is some chance that the resulting random sample is poorly balanced across these towns and hence is biased, causing a significant error in estimation (when the outcome of interest has a different distribution, in terms of the parameter of interest, between the towns). Instead, if we choose to take a random sample of 10, 20 and 30 from Town A, B and C respectively, then we can produce a smaller error in estimation for the same total sample size. This method is generally used when a population is not a homogeneous group.

Stratified sampling strategies

  1. Proportionate allocation uses a sampling fraction in each of the strata that are proportional to that of the total population. For instance, if the population consists of n total individuals, m of which are male and f female (and where m + f = n), then the relative size of the two samples (x1 = m/n males, x2 = f/n females) should reflect this proportion.
  2. Optimum allocation (or disproportionate allocation) – The sampling fraction of each stratum is proportionate to both the proportion (as above) and the standard deviation of the distribution of the variable. Larger samples are taken in the strata with the greatest variability to generate the least possible overall sampling variance.

A real-world example of using stratified sampling would be for a political survey. If the respondents needed to reflect the diversity of the population, the researcher would specifically seek to include participants of various minority groups such as race or religion, based on their proportionality to the total population as mentioned above. A stratified survey could thus claim to be more representative of the population than a survey of simple random sampling or systematic sampling. Both mean and variance can be corrected for disproportionate sampling costs using stratified sample sizes.

Advantages

The reasons to use stratified sampling rather than simple random sampling include [2]

  1. If measurements within strata have a lower standard deviation (as compared to the overall standard deviation in the population), stratification gives a smaller error in estimation.
  2. For many applications, measurements become more manageable and/or cheaper when the population is grouped into strata.
  3. When it is desirable to have estimates of the population parameters for groups within the population – stratified sampling verifies we have enough samples from the strata of interest.

If the population density varies greatly within a region, stratified sampling will ensure that estimates can be made with equal accuracy in different parts of the region, and that comparisons of sub-regions can be made with equal statistical power. For example, in Ontario a survey taken throughout the province might use a larger sampling fraction in the less populated north, since the disparity in population between north and south is so great that a sampling fraction based on the provincial sample as a whole might result in the collection of only a handful of data from the north.

Disadvantages

It would be a misapplication of the technique to make subgroups' sample sizes proportional to the amount of data available from the subgroups, rather than scaling sample sizes to subgroup sizes (or to their variances, if known to vary significantly—e.g. using an F test). Data representing each subgroup are taken to be of equal importance if suspected variation among them warrants stratified sampling. If subgroup variances differ significantly and the data needs to be stratified by variance, it is not possible to simultaneously make each subgroup sample size proportional to subgroup size within the total population. For an efficient way to partition sampling resources among groups that vary in their means, variance and costs, see "optimum allocation". The problem of stratified sampling in the case of unknown class priors (ratio of subpopulations in the entire population) can have a deleterious effect on the performance of any analysis on the dataset, e.g. classification. [3] In that regard, minimax sampling ratio can be used to make the dataset robust with respect to uncertainty in the underlying data generating process. [3]

Combining sub-strata to ensure adequate numbers can lead to Simpson's paradox, where trends that exist in different groups of data disappear or even reverse when the groups are combined.

Mean and standard error

The mean and variance of stratified random sampling are given by: [2]

where

number of strata
the sum of all stratum sizes
size of stratum
sample mean of stratum
number of observations in stratum
sample standard deviation of stratum

Note that the term , which equals , is a finite population correction and must be expressed in "sample units". Foregoing the finite population correction gives:

where the is the population weight of stratum .

Sample size allocation

For the proportional allocation strategy, the size of the sample in each stratum is taken in proportion to the size of the stratum. Suppose that in a company there are the following staff: [4]

and we are asked to take a sample of 40 staff, stratified according to the above categories.

The first step is to calculate the percentage of each group of the total.

This tells us that of our sample of 40,

Another easy way without having to calculate the percentage is to multiply each group size by the sample size and divide by the total population size (size of entire staff):

See also

Related Research Articles

<span class="mw-page-title-main">Cluster sampling</span> Sampling methodology in statistics

In statistics, cluster sampling is a sampling plan used when mutually homogeneous yet internally heterogeneous groupings are evident in a statistical population. It is often used in marketing research.

<span class="mw-page-title-main">Standard deviation</span> In statistics, a measure of variation

In statistics, the standard deviation is a measure of the amount of variation of a random variable expected about its mean. A low standard deviation indicates that the values tend to be close to the mean of the set, while a high standard deviation indicates that the values are spread out over a wider range. The standard deviation is commonly used in the determination of what constitutes an outlier and what does not.

<span class="mw-page-title-main">Sampling (statistics)</span> Selection of data points in statistics.

In statistics, quality assurance, and survey methodology, sampling is the selection of a subset or a statistical sample of individuals from within a statistical population to estimate characteristics of the whole population. The subset is meant to reflect the whole population and statisticians attempt to collect samples that are representative of the population. Sampling has lower costs and faster data collection compared to recording data from the entire population, and thus, it can provide insights in cases where it is infeasible to measure an entire population.

<span class="mw-page-title-main">Pearson correlation coefficient</span> Measure of linear correlation

In statistics, the Pearson correlation coefficient (PCC) is a correlation coefficient that measures linear correlation between two sets of data. It is the ratio between the covariance of two variables and the product of their standard deviations; thus, it is essentially a normalized measurement of the covariance, such that the result always has a value between −1 and 1. As with covariance itself, the measure can only reflect a linear correlation of variables, and ignores many other types of relationships or correlations. As a simple example, one would expect the age and height of a sample of children from a primary school to have a Pearson correlation coefficient significantly greater than 0, but less than 1.

<i>Z</i>-test Statistical test

A Z-test is any statistical test for which the distribution of the test statistic under the null hypothesis can be approximated by a normal distribution. Z-test tests the mean of a distribution. For each significance level in the confidence interval, the Z-test has a single critical value which makes it more convenient than the Student's t-test whose critical values are defined by the sample size. Both the Z-test and Student's t-test have similarities in that they both help determine the significance of a set of data. However, the z-test is rarely used in practice because the population deviation is difficult to determine.

In statistics, an effect size is a value measuring the strength of the relationship between two variables in a population, or a sample-based estimate of that quantity. It can refer to the value of a statistic calculated from a sample of data, the value of a parameter for a hypothetical population, or to the equation that operationalizes how statistics or parameters lead to the effect size value. Examples of effect sizes include the correlation between two variables, the regression coefficient in a regression, the mean difference, or the risk of a particular event happening. Effect sizes are a complement tool for statistical hypothesis testing, and play an important role in power analyses to assess the sample size required for new experiments. Effect size are fundamental in meta-analyses which aim at provide the combined effect size based on data from multiple studies. The cluster of data-analysis methods concerning effect sizes is referred to as estimation statistics.

In statistics and optimization, errors and residuals are two closely related and easily confused measures of the deviation of an observed value of an element of a statistical sample from its "true value". The error of an observation is the deviation of the observed value from the true value of a quantity of interest. The residual is the difference between the observed value and the estimated value of the quantity of interest. The distinction is most important in regression analysis, where the concepts are sometimes called the regression errors and regression residuals and where they lead to the concept of studentized residuals. In econometrics, "errors" are also called disturbances.

In statistics, a sampling distribution or finite-sample distribution is the probability distribution of a given random-sample-based statistic. If an arbitrarily large number of samples, each involving multiple observations, were separately used in order to compute one value of a statistic for each sample, then the sampling distribution is the probability distribution of the values that the statistic takes on. In many contexts, only one sample is observed, but the sampling distribution can be found theoretically.

<span class="mw-page-title-main">Monte Carlo integration</span> Numerical technique

In mathematics, Monte Carlo integration is a technique for numerical integration using random numbers. It is a particular Monte Carlo method that numerically computes a definite integral. While other algorithms usually evaluate the integrand at a regular grid, Monte Carlo randomly chooses points at which the integrand is evaluated. This method is particularly useful for higher-dimensional integrals.

The effective population size (Ne) is size of an idealised population would experience the same rate of genetic drift or increase in inbreeding as in the real population. Idealised populations are based on unrealistic but convenient assumptions including random mating, simultaneous birth of each new generation, constant population size. For most quantities of interest and most real populations, Ne is smaller than the census population size N of a real population. The same population may have multiple effective population sizes for different properties of interest, including genetic drift and inbreeding.

Sample size determination or estimation is the act of choosing the number of observations or replicates to include in a statistical sample. The sample size is an important feature of any empirical study in which the goal is to make inferences about a population from a sample. In practice, the sample size used in a study is usually determined based on the cost, time, or convenience of collecting the data, and the need for it to offer sufficient statistical power. In complex studies, different sample sizes may be allocated, such as in stratified surveys or experimental designs with multiple treatment groups. In a census, data is sought for an entire population, hence the intended sample size is equal to the population. In experimental design, where a study may be divided into different treatment groups, there may be different sample sizes for each group.

<span class="mw-page-title-main">Variance reduction</span>

In mathematics, more specifically in the theory of Monte Carlo methods, variance reduction is a procedure used to increase the precision of the estimates obtained for a given simulation or computational effort. Every output random variable from the simulation is associated with a variance which limits the precision of the simulation results. In order to make a simulation statistically efficient, i.e., to obtain a greater precision and smaller confidence intervals for the output random variable of interest, variance reduction techniques can be used. The main variance reduction methods are

<span class="mw-page-title-main">Jackknife resampling</span> Statistical method for resampling

In statistics, the jackknife is a cross-validation technique and, therefore, a form of resampling. It is especially useful for bias and variance estimation. The jackknife pre-dates other common resampling methods such as the bootstrap. Given a sample of size , a jackknife estimator can be built by aggregating the parameter estimates from each subsample of size obtained by omitting one observation.

In statistics and in particular statistical theory, unbiased estimation of a standard deviation is the calculation from a statistical sample of an estimated value of the standard deviation of a population of values, in such a way that the expected value of the calculation equals the true value. Except in some important situations, outlined later, the task has little relevance to applications of statistics since its need is avoided by standard procedures, such as the use of significance tests and confidence intervals, or by using Bayesian analysis.

Tukey's range test, also known as Tukey's test, Tukey method, Tukey's honest significance test, or Tukey's HSDtest, is a single-step multiple comparison procedure and statistical test. It can be used to correctly interpret the statistical significance of the difference between means that have been selected for comparison because of their extreme values.

Balanced repeated replication is a statistical technique for estimating the sampling variability of a statistic obtained by stratified sampling.

Stratification of clinical trials is the partitioning of subjects and results by a factor other than the treatment given.

In survey research, the design effect is a number that shows how well a sample of people may represent a larger group of people for a specific measure of interest. This is important when the sample comes from a sampling method that is different than just picking people using a simple random sample.

In statistics, the Horvitz–Thompson estimator, named after Daniel G. Horvitz and Donovan J. Thompson, is a method for estimating the total and mean of a pseudo-population in a stratified sample by applying inverse probability weighting to account for the difference in the sampling distribution between the collected data and the a target population. The Horvitz–Thompson estimator is frequently applied in survey analyses and can be used to account for missing data, as well as many sources of unequal selection probabilities.

<span class="mw-page-title-main">Stratified randomization</span> Method of statistical sampling

In statistics, stratified randomization is a method of sampling which first stratifies the whole study population into subgroups with same attributes or characteristics, known as strata, then followed by simple random sampling from the stratified groups, where each element within the same subgroup are selected unbiasedly during any stage of the sampling process, randomly and entirely by chance. Stratified randomization is considered a subdivision of stratified sampling, and should be adopted when shared attributes exist partially and vary widely between subgroups of the investigated population, so that they require special considerations or clear distinctions during sampling. This sampling method should be distinguished from cluster sampling, where a simple random sample of several entire clusters is selected to represent the whole population, or stratified systematic sampling, where a systematic sampling is carried out after the stratification process.

References

  1. Botev, Z.; Ridder, A. (2017). "Variance Reduction". Wiley StatsRef: Statistics Reference Online: 1–6. doi:10.1002/9781118445112.stat07975. ISBN   9781118445112.
  2. 1 2 "6.1 How to Use Stratified Sampling | STAT 506". onlinecourses.science.psu.edu. Retrieved 2015-07-23.
  3. 1 2 Shahrokh Esfahani, Mohammad; Dougherty, Edward R. (2014). "Effect of separate sampling on classification accuracy". Bioinformatics. 30 (2): 242–250. doi: 10.1093/bioinformatics/btt662 . PMID   24257187.
  4. Hunt, Neville; Tyrrell, Sidney (2001). "Stratified Sampling". Webpage at Coventry University. Archived from the original on 13 October 2013. Retrieved 12 July 2012.

Further reading