Software testing is the act of checking whether software satisfies expectations.
A hidden Markov model (HMM) is a Markov model in which the observations are dependent on a latent Markov process. An HMM requires that there be an observable process whose outcomes depend on the outcomes of in a known way. Since cannot be observed directly, the goal is to learn about state of by observing . By definition of being a Markov model, an HMM has an additional requirement that the outcome of at time must be "influenced" exclusively by the outcome of at and that the outcomes of and at must be conditionally independent of at given at time . Estimation of the parameters in an HMM can be performed using maximum likelihood estimation. For linear chain HMMs, the Baum–Welch algorithm can be used to estimate parameters.
Six Sigma (6σ) is a set of techniques and tools for process improvement. It was introduced by American engineer Bill Smith while working at Motorola in 1986.

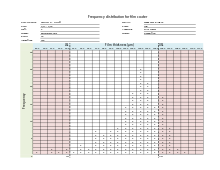
Control charts are graphical plots used in production control to determine whether quality and manufacturing processes are being controlled under stable conditions. The hourly status is arranged on the graph, and the occurrence of abnormalities is judged based on the presence of data that differs from the conventional trend or deviates from the control limit line. Control charts are classified into Shewhart individuals control chart and CUSUM(CUsUM)(or cumulative sum control chart)(ISO 7870-4).
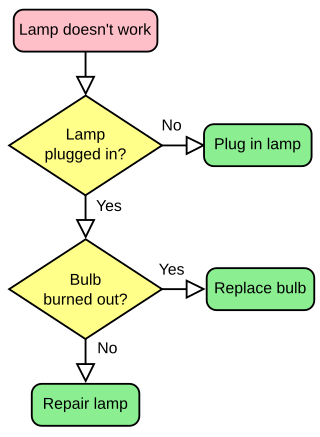
A flowchart is a type of diagram that represents a workflow or process. A flowchart can also be defined as a diagrammatic representation of an algorithm, a step-by-step approach to solving a task.

Life cycle assessment (LCA), also known as life cycle analysis, is a methodology for assessing environmental impacts associated with all the stages of the life cycle of a commercial product, process, or service. For instance, in the case of a manufactured product, environmental impacts are assessed from raw material extraction and processing (cradle), through the product's manufacture, distribution and use, to the recycling or final disposal of the materials composing it (grave).

Mathematical statistics is the application of probability theory and other mathematical concepts to statistics, as opposed to techniques for collecting statistical data. Specific mathematical techniques that are commonly used in statistics include mathematical analysis, linear algebra, stochastic analysis, differential equations, and measure theory.
A data-flow diagram is a way of representing a flow of data through a process or a system. The DFD also provides information about the outputs and inputs of each entity and the process itself. A data-flow diagram has no control flow — there are no decision rules and no loops. Specific operations based on the data can be represented by a flowchart.
When classification is performed by a computer, statistical methods are normally used to develop the algorithm.
DMAIC or define, measure, analyze, improve and control refers to a data-driven improvement cycle used for optimizing and stabilizing business processes and designs. The DMAIC improvement cycle is the core tool used to drive Six Sigma projects. However, DMAIC is not exclusive to Six Sigma and can be used as the framework for other improvement applications.
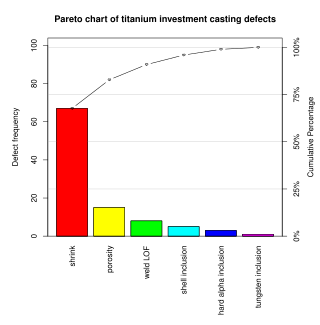
A Pareto chart is a type of chart that contains both bars and a line graph, where individual values are represented in descending order by bars, and the cumulative total is represented by the line. The chart is named for the Pareto principle, which, in turn, derives its name from Vilfredo Pareto, a noted Italian economist.
The seven management and planning tools have their roots in operations research work done after World War II and the Japanese total quality control (TQC) research.
Eight Disciplines Methodology (8D) is a method or model developed at Ford Motor Company used to approach and to resolve problems, typically employed by quality engineers or other professionals. Focused on product and process improvement, its purpose is to identify, correct, and eliminate recurring problems. It establishes a permanent corrective action based on statistical analysis of the problem and on the origin of the problem by determining the root causes. Although it originally comprised eight stages, or 'disciplines', it was later augmented by an initial planning stage. 8D follows the logic of the PDCA cycle. The disciplines are:
The Windows software trace preprocessor is a preprocessor that simplifies the use of WMI event tracing to implement efficient software tracing in drivers and applications that target Windows 2000 and later operating systems. WPP was created by Microsoft and is included in the Windows DDK. Although WPP is wide in its applicability, it is not included in the Windows SDK, and therefore is primarily used for drivers and driver support software produced by software vendors that purchase the Windows DDK.

Value-stream mapping, also known as material- and information-flow mapping, is a lean-management method for analyzing the current state and designing a future state for the series of events that take a product or service from the beginning of the specific process until it reaches the customer. A value stream map is a visual tool that displays all critical steps in a specific process and easily quantifies the time and volume taken at each stage. Value stream maps show the flow of both materials and information as they progress through the process.

Official statistics are statistics published by government agencies or other public bodies such as international organizations as a public good. They provide quantitative or qualitative information on all major areas of citizens' lives, such as economic and social development, living conditions, health, education, and the environment.

A plot is a graphical technique for representing a data set, usually as a graph showing the relationship between two or more variables. The plot can be drawn by hand or by a computer. In the past, sometimes mechanical or electronic plotters were used. Graphs are a visual representation of the relationship between variables, which are very useful for humans who can then quickly derive an understanding which may not have come from lists of values. Given a scale or ruler, graphs can also be used to read off the value of an unknown variable plotted as a function of a known one, but this can also be done with data presented in tabular form. Graphs of functions are used in mathematics, sciences, engineering, technology, finance, and other areas.
In geophysics, seismic inversion is the process of transforming seismic reflection data into a quantitative rock-property description of a reservoir. Seismic inversion may be pre- or post-stack, deterministic, random or geostatistical; it typically includes other reservoir measurements such as well logs and cores.
Software reliability testing is a field of software-testing that relates to testing a software's ability to function, given environmental conditions, for a particular amount of time. Software reliability testing helps discover many problems in the software design and functionality.

Land change models (LCMs) describe, project, and explain changes in and the dynamics of land use and land-cover. LCMs are a means of understanding ways that humans change the Earth's surface in the past, present, and future.