Pareto chart

Last updated
Pareto chart
Pareto chart of titanium investment casting defects.svg
One of the Seven Basic Tools of Quality
PurposeTo assess the most frequently occurring defects by category†
Simple example of a Pareto chart using hypothetical data showing the relative frequency of reasons for arriving late at work Pareto.PNG
Simple example of a Pareto chart using hypothetical data showing the relative frequency of reasons for arriving late at work

A Pareto chart is a type of chart that contains both bars and a line graph, where individual values are represented in descending order by bars, and the cumulative total is represented by the line. The chart is named for the Pareto principle, which, in turn, derives its name from Vilfredo Pareto, a noted Italian economist.

Contents

Description

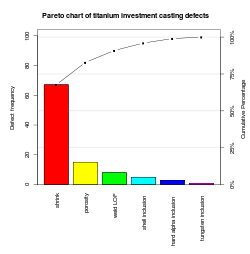
The left vertical axis is the frequency of occurrence, but it can alternatively represent cost or another important unit of measure. The right vertical axis is the cumulative percentage of the total number of occurrences, total cost, or total of the particular unit of measure. Because the values are in decreasing order, the cumulative function is a concave function. To take the example below, in order to lower the amount of late arrivals by 78%, it is sufficient to solve the first three issues.

The purpose of the Pareto chart is to highlight the most important among a (typically large) set of factors. In quality control, Pareto charts are useful to find the defects to prioritize in order to observe the greatest overall improvement. It often represents the most common sources of defects, the highest occurring type of defect, or the most frequent reasons for customer complaints, and so on. Wilkinson (2006) devised an algorithm for producing statistically based acceptance limits (similar to confidence intervals) for each bar in the Pareto chart.

These charts can be generated by simple spreadsheet programs, specialized statistical software tools, and online quality charts generators.

The Pareto chart is one of the seven basic tools of quality control. [1] [2]

See also

Related Research Articles

<span class="mw-page-title-main">Histogram</span> Graphical representation of the distribution of numerical data

A histogram is an approximate representation of the distribution of numerical data. The term was first introduced by Karl Pearson. To construct a histogram, the first step is to "bin" the range of values—that is, divide the entire range of values into a series of intervals—and then count how many values fall into each interval. The bins are usually specified as consecutive, non-overlapping intervals of a variable. The bins (intervals) must be adjacent and are often of equal size.

<span class="mw-page-title-main">Pareto principle</span> Statistical principle about ratio of effects to causes

The Pareto principle states that for many outcomes, roughly 80% of consequences come from 20% of causes. Other names for this principle are the 80/20 rule, the law of the vital few, or the principle of factor sparsity.

<span class="mw-page-title-main">Quality control</span> Project management process making sure produced products are good

Quality control (QC) is a process by which entities review the quality of all factors involved in production. ISO 9000 defines quality control as "A part of quality management focused on fulfilling quality requirements".

Total quality management (TQM) consists of organization-wide efforts to "install and make permanent climate where employees continuously improve their ability to provide on demand products and services that customers will find of particular value." "Total" emphasizes that departments in addition to production are obligated to improve their operations; "management" emphasizes that executives are obligated to actively manage quality through funding, training, staffing, and goal setting. While there is no widely agreed-upon approach, TQM efforts typically draw heavily on the previously developed tools and techniques of quality control. TQM enjoyed widespread attention during the late 1980s and early 1990s before being overshadowed by ISO 9000, Lean manufacturing, and Six Sigma.

<span class="mw-page-title-main">Chart</span> Graphical representation of data

A chart is a graphical representation for data visualization, in which "the data is represented by symbols, such as bars in a bar chart, lines in a line chart, or slices in a pie chart". A chart can represent tabular numeric data, functions or some kinds of quality structure and provides different info.

Six Sigma () is a set of techniques and tools for process improvement. It was introduced by American engineer Bill Smith while working at Motorola in 1986.

Quality assurance (QA) is the term used in both manufacturing and service industries to describe the systematic efforts taken to insure that the product(s) delivered to customer(s) meet with the contractual and other agreed upon performance, design, reliability, and maintainability expectations of that customer. The core purpose of Quality Assurance is to prevent mistakes and defects in the development and production of both manufactured products, such as automobiles and shoes, and delivered services, such as automotive repair and athletic shoe design. Assuring quality and therefore avoiding problems and delays when delivering products or services to customers is what ISO 9000 defines as that "part of quality management focused on providing confidence that quality requirements will be fulfilled". This defect prevention aspect of quality assurance differs from the defect detection aspect of quality control and has been referred to as a shift left since it focuses on quality efforts earlier in product development and production and on avoiding defects in the first place rather than correcting them after the fact.

<span class="mw-page-title-main">Bar chart</span> Type of chart

A bar chart or bar graph is a chart or graph that presents categorical data with rectangular bars with heights or lengths proportional to the values that they represent. The bars can be plotted vertically or horizontally. A vertical bar chart is sometimes called a column chart.

<span class="mw-page-title-main">Kaoru Ishikawa</span>

Kaoru Ishikawa was a Japanese organizational theorist and a professor in the engineering faculty at the University of Tokyo noted for his quality management innovations. He is considered a key figure in the development of quality initiatives in Japan, particularly the quality circle. He is best known outside Japan for the Ishikawa or cause and effect diagram, often used in the analysis of industrial processes.

Pareto analysis Statistical concept

Pareto analysis is a formal technique useful where many possible courses of action are competing for attention. In essence, the problem-solver estimates the benefit delivered by each action, then selects a number of the most effective actions that deliver a total benefit reasonably close to the maximal possible one.

In the context of software engineering, software quality refers to two related but distinct notions:

A quality circle or quality control circle is a group of workers who do the same or similar work, who meet regularly to identify, analyze and solve work-related problems. It consists of minimum three and maximum twelve members in number. Normally small in size, the group is usually led by a supervisor or manager and presents its solutions to management; where possible, workers implement the solutions themselves in order to improve the performance of the organization and motivate employees. Quality circles were at their most popular during the 1980s, but continue to exist in the form of Kaizen groups and similar worker participation schemes.

DMAIC refers to a data-driven improvement cycle used for improving, optimizing and stabilizing business processes and designs. The DMAIC improvement cycle is the core tool used to drive Six Sigma projects. However, DMAIC is not exclusive to Six Sigma and can be used as the framework for other improvement applications.

Certified Quality Engineer, often abbreviated CQE, is a certification given by the American Society for Quality (ASQ). These engineers are professionally educated in quality engineering and quality control.

<span class="mw-page-title-main">Seven basic tools of quality</span> Fixed set of graphical techniques for troubleshooting issues related to quality

The seven basic tools of quality is a designation given to a fixed set of graphical techniques identified as being most helpful in troubleshooting issues related to quality. They are called basic because they are suitable for people with little formal training in statistics and because they can be used to solve the vast majority of quality-related issues.

Quality engineering is the discipline of engineering concerned with the principles and practice of product and service quality assurance and control. In software development, it is the management, development, operation and maintenance of IT systems and enterprise architectures with a high quality standard.

<span class="mw-page-title-main">Joseph M. Juran</span>

Joseph Moses Juran was a Romanian-born American engineer and management consultant. He was an evangelist for quality and quality management, having written several books on those subjects. He was the brother of Academy Award winner Nathan Juran.

The acceptable quality limit (AQL) is the worst tolerable process average (mean) in percentage or ratio that is still considered acceptable; that is, it is at an acceptable quality level. Closely related terms are the rejectable quality limit and rejectable quality level (RQL). In a quality control procedure, a process is said to be at an acceptable quality level if the appropriate statistic used to construct a control chart does not fall outside the bounds of the acceptable quality limits. Otherwise, the process is said to be at a rejectable control level.

In quality control, multi-vari charts are a visual way of presenting variability through a series of charts. The content and format of the charts has evolved over time.

<span class="mw-page-title-main">Dorian Shainin</span>

Dorian Shainin was an American quality consultant, aeronautics engineer, author, and college professor most notable for his contributions in the fields of industrial problem solving, product reliability, and quality engineering, particularly the creation and development of the "Red X" concept.

References

  1. Nancy R. Tague (2004). "Seven Basic Quality Tools". The Quality Toolbox. Milwaukee, Wisconsin: American Society for Quality. p. 15. Retrieved 2010-02-05.
  2. "What is a Pareto Chart? Analysis & Diagram | ASQ". asq.org. Retrieved 2019-05-10.

Further reading